Mälardalen University
This is an accepted version of a paper published in Applied Energy. This paper has been peer-reviewed but does not include the final publisher proof-corrections or journal pagination.
Citation for the published paper:
Li, H., Jakobsen, J., Wilhelmsen, Ø., Yan, J. (2011)
"PVTxy properties of CO2 mixtures relevant for CO2 capture, transport and storage: Review of available experimental data and theoretical models"
Applied Energy, 88(11): 3567-3579
URL: http://dx.doi.org/10.1016/j.apenergy.2011.03.052
Access to the published version may require subscription. Permanent link to this version:
http://urn.kb.se/resolve?urn=urn:nbn:se:mdh:diva-13347
PVTxy properties of CO
2
mixtures relevant for CO
2
capture, transport and storage: Review of available
experimental data and theoretical models
Hailong Li*
1 SINTEF Energy, Kolbjørn Hejes vei 1A, 7465 Trondheim, Norway
1
, Jana P. Jakobsen1,Øivind Wilhelmsen1, Jinyue Yan2,3
2 Energy Process, Royal Institute of Technology, 10044 Stockholm, Sweden
3 School of Sustainable Development of Society and Technology, Mälardalen University, Västerås, Sweden
Abstr act:
The knowledge about pressure-volume-temperature-composition (PVTxy) properties plays an important role in the design and operation of many processes involved in CO2 capture and storage (CCS) systems.
A literature survey was conducted on both the available experimental data and the theoretical models associated with the thermodynamic properties of CO2 mixtures within the operation window of CCS.
Some gaps were identified between available experimental data and requirements of the system design and operation. The major concerns are: for the vapour-liquid-equilibrium, there are no data about CO2/COS and few data about the CO2/N2O4 mixture. For the volume property, there are no published
* Corresponding author. Present address Mälardalen University, PO Box 883, 72123 Västeras, Sweden; Email: lihailong@gmail.com; Tel: 0046-21-103159; Fax: 0046 21101480
experimental data for CO2/O2, CO2/CO, CO2/N2O4, CO2/COS and CO2/NH3 and the liquid volume of
CO2/H2. The experimental data available for multi-component CO2 mixtures are also scarce. Many
equations of state are available for thermodynamic calculations of CO2 mixtures. The cubic equations of
state have the simplest structure and are capable of giving reasonable results for the PVTxy properties. More complex equations of state such as Lee-Kesler, SAFT and GERG typically give better results for the volume property, but not necessarily for the vapour-liquid equilibrium. None of the equations of state evaluated in the literature show any clear advantage in CCS applications for the calculation of all PVTxy properties. A reference equation of state for CCS should thus be a future goal.
Keywords: CO2 mixtures, thermodynamic property, VLE, density, equation of state, CO2 capture and
storage
1. Intr oduction
Currently, there are several running commercial projects about CO2 capture, transport and storage
(CCS). For example, the Snøhvit project (Northern Norway) operated by Statoil runs a 153km offshore pipeline transporting liquid CO2 from an LNG plant to a subsea well. In the Sleipner project (North Sea)
which is also operated by Statoil, the CO2 is transported a short distance near the critical point between
two connected offshore platforms. Here, the CO2 capture unit is on one platform, while the wellhead is
connected to the other [1]. From those projects, many Research & Development requests have been raised to improve the Health, Safety and Environment and reduce the costs in existing and future CCS chains.
Carbon dioxide captured from an energy conversion process always contains impurities. Previous work has revealed that the existences of impurities will clearly impact the design and operation of CCS systems [2,3]. Therefore, the knowledge of thermodynamic properties, especially the pressure-volume-temperature-composition (PVTxy) properties, is essential to the design and operation of CO2
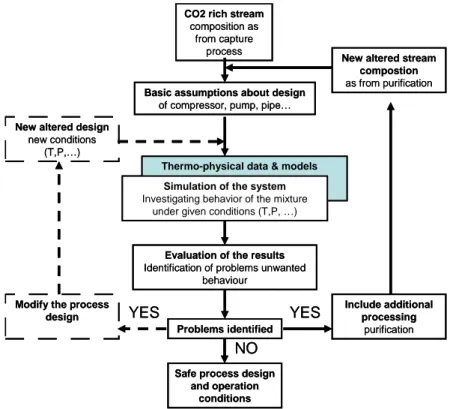
conditioning and transport. The knowledge of the behaviour of the mixture under the conditions of the particular process will allow (as shown in Figure 1):
• Identification of possibly encountered problems;
• Specification of safe concentration limits for the involved impurities; • Definition of the requirements for purification if necessary; and • Designing efficient, safe and economic processes
Figure 1 Importance of the knowledge of CO2 mixture properties and behaviour for design and
operation of safe and cost and energy efficient processes
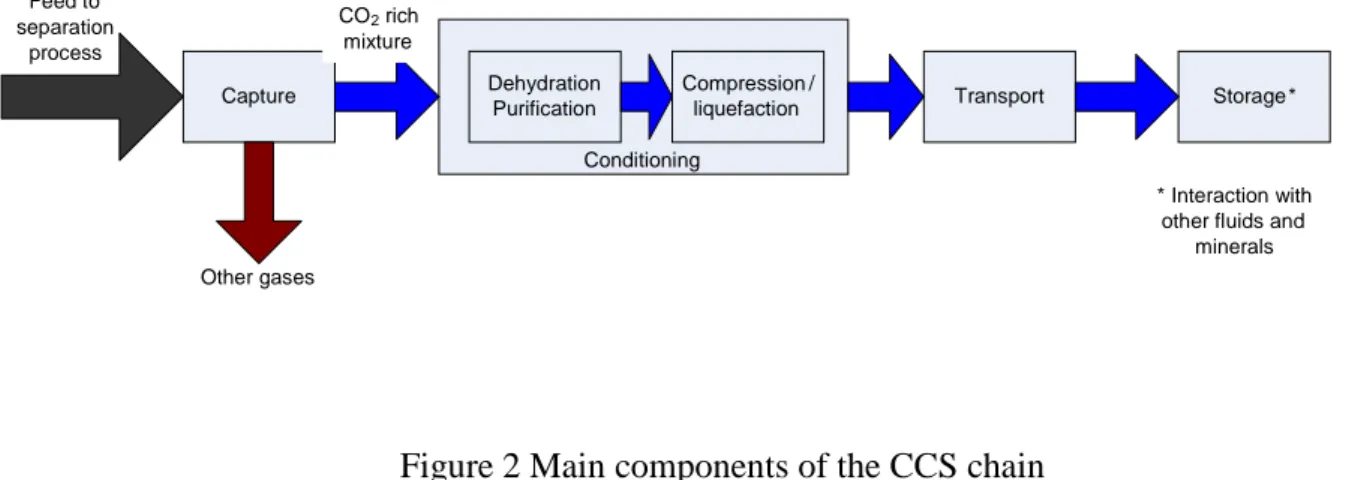
A typical CO2 capture and storage (CCS) chain normally consists of four main steps: CO2 capture,
CO2 conditioning (dehydration, non-condensable gas separation and/or liquefaction, and
compression/pumping), CO2 transport and CO2 storage. Figure 2 illustrates how these steps are linked
together.
Thermo-physical data & models CO2 rich stream
composition as from capture
process
Basic assumptions about design
of compressor, pump, pipe…
Simulation of the system
Investigating behavior of the mixture under given conditions (T,P, …)
Evaluation of the results
Identification of problems unwanted behaviour
Problems identified
Safe process design and operation
conditions Modify the process
design
Include additional processing
purification
New altered stream compostion
as from purification
New altered design
new conditions (T,P,…)
NO
YES YES
Figure 2 Main components of the CCS chain
The vapour-liquid equilibrium (VLE) of CO2 mixtures is, for example, one of the basic parameters to
design the capture of CO2 and also to design non-condensable gas separation processes. The volume
property is important in the design and operation of compression, transportation and storage. It could be said that the development and technical breakthrough of new CCS systems relies on a deeper understanding of the thermodynamic properties of CO2 mixtures. PVTxy properties can be measured
directly. However, because CCS processes cover a large range of operation conditions from atmospheric pressure to supercritical states, and involve multi-component mixtures, experiments alone cannot satisfy the requirements of engineering applications. In order to exceed the limitations of the experiments, theoretical models have been developed based on the experimental data.
This work contains a review of both the experimental data and the thermodynamic models for PVTxy properties of CO2 mixtures with impurities. The purpose of the work is to summarize and evaluate the
available experimental data, identify knowledge gaps and investigate which available theoretical models that have been proposed and tested in the literature. The work will also provide suggestions for future research on the PVTxy properties of CO2 mixtures.
2. Oper ating windows of CO2 conditioning and tr ansport
The operating windows of the process determine the relevant ranges of temperature, pressure and composition, in which experimental data are required and property models should preferably be validated to minimize the uncertainties in the design criteria of the different processes.
Conditioning Capture Feed to separation process Other gases Dehydration Purification Compression/
liquefaction Transport Storage*
* Interaction with
other fluids and minerals
CO2rich
2.1 Temperature and pressure windows
The operating conditions of CO2 capture, transport and storage (CCS) are estimated in Table 1 [4,5].
Some sub-processes or options for these are indicated in Table 1 as well. The table shows that the CCS chain covers pressures from ~ 0 MPa to 50 MPa and temperatures from 218K to 1620 K.
Table 1 Estimated operating conditions (P and T) of CCS processes
CCS pr ocess P (MPa) T (K) CO2 capture 0.05 to 8 298.15 to 1620 Post-combustion 0.05 to 0.3 313 to 410 Oxy-fuel combustion 0.1 298.15 to 333 Pre-combustion 0.1 to 8 298.15 to 1620 CO2 conditioning 0 to 11 219.15 to 423.15 Initial compression 0 to 3 293.15 to 423.15 Dehydration 2 to 3 283.15 to 303.15
Non-condensable gas separation 2 to 5 219.15 to 248.15
Further compression/pumping 5 to 11 283.15 to 303.15 CO2 transport 0.5 to 20 218.15 to 303.15 Pipeline 7.5 to 20 273.15 to 303.15 Small tanks 1.5 to 2.5 238.15 to 248.15 Large tanks 0.5 to 0.9 218.15 to 228.15 CO2 storage 0.1 to 50 277.15 to 423.15 2.2 Possible impurities
The type and amount of the impurities introduced into the CO2 depend on the fuels used and the type
of capture technology. The CO2 streams captured from post-combustion with an amine solution are
relatively clean, with H2O as the main impurity. However, relative high levels of impurities are expected
in the CO2 streams captured from oxy-fuel combustion, and a more complicated composition of the CO2
industry and fuel conversion processes, the possible impurities are summarized in Table 2. Recently, comprehensive reviews on the experimental PVTxy-data of CO2/H2O and CO2/amines have been
published [6-12]. In addition, an extensive review of the available experimental data and models for CO2-hydrates has been presented previously [13]. Therefore, this work will review the available
experimental data and models for the impurities which have not yet been thoroughly treated in the literature, namely: CH4, H2S, N2, O2, CO, H2, COS, Ar, SOx, NOx, NH3 and SO2.
Table 2: Possible impurities[4]
# Description Possible impurities 1 CO2 captured from natural gas sweetening CH4, amines, H2O
2 CO2 captured from heavy oil production and upgrading H2S, N2, O2, CO, H2O, H2, COS, Ar, SOx, NOx
3 CO2 captured from power plants using post-combustion capture N2, amines, H2O, O2, NH3,SOx, NOx
4 CO2 captured from power plants using oxy-combustion capture N2, O2, SO2, H2S, Ar
5 CO2 captured from power plants using pre-combustion capture H2, CO, N2,H2S, CH4
In general, there are no strong technical barriers to provide high purity CO2 from the flue gas of fossil
fuel fired power plants. However, high purity requirements are likely to induce additional costs and energy requirements resulting in a high loss of power plant efficiency. It is, thus, of importance to find an optimal balance between the requirements with respects to safety, legal and environmental aspects of transport and storage and the costs concerning CO2 sequestration. The possible concentration ranges of
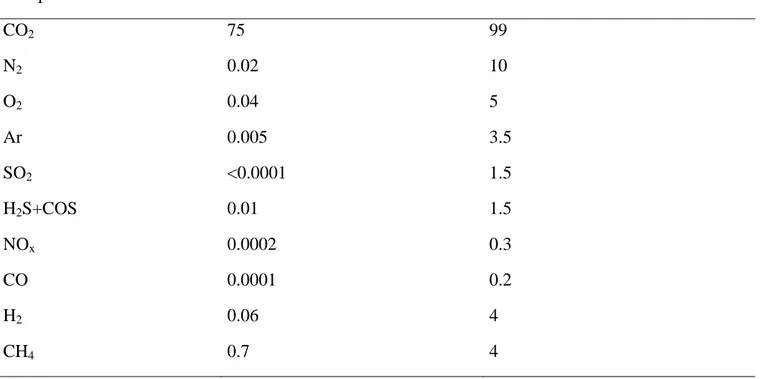
the impurities in the captured CO2 streams are given in Table 3. These estimates are based on previous
studies [5,14].
Component Min mol% Max mol% CO2 75 99 N2 0.02 10 O2 0.04 5 Ar 0.005 3.5 SO2 <0.0001 1.5 H2S+COS 0.01 1.5 NOx 0.0002 0.3 CO 0.0001 0.2 H2 0.06 4 CH4 0.7 4
3. Available exper imental data 3.1 Summary of measurements
The PVTxy properties of CO2 mixtures have attracted the interest of researchers for over a century.
Many experiments have been conducted. However, experimental studies have mainly focused on impurities such as water, hydrocarbons, nitrogen, and hydrogen sulphide due to their importance for producing and processing natural gas resources and for using the CO2 mixture for enhanced oil recovery
processes. As a result, there are many available experimental data about the mixtures CO2/H2O, CO2/N2,
CO2/CH4, and CO2/H2S, which cover a wide range of temperatures and pressures. However, the
experimental data of the CO2 mixtures containing O2, Ar, SO2, CO, H2 and other impurities are limited,
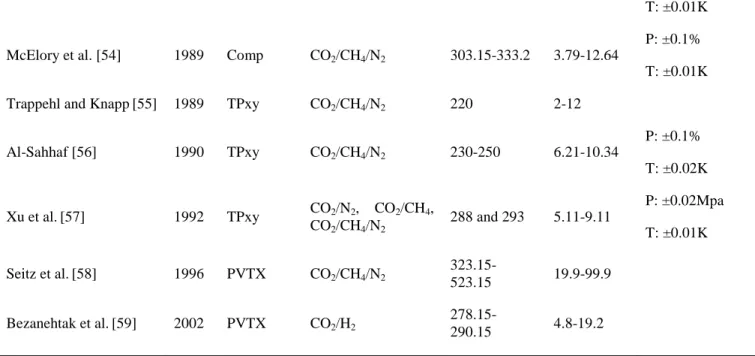
although such impurities will be important for CCS processes, in particular for the oxy-fuel combustion technology. Available experimental PVTxy-data of CO2 mixtures are summarized in Table 4, with their
corresponding range in temperature and pressure and the reported uncertainty. The reported uncertainties are typically smaller in newer work due to more accurate measuring techniques.
Source Year Type Mixture T (K) P (Mpa) Uncertainty Caubet[15] 1901 PVTX CO2/SO2 291-416 2.7-10.5
Booth and Carter[16] 1930 TPxy CO2/O2
213-260 3.7-14.5 P: 0.1atm T: 0.03K Cummings[17] 1931 TPxy CO2/SO2 313-403 0.6-9.5
Reamer et al.[18] 1944 Comp CO2/CH4 311-511 1.4-69
Haney and Bliss[19] 1944 Comp CO2/N2
298.15-398.15 3-50 T: ±0.05K von Steckel[20] 1945 TPxy CO2/H2S 221-288.15 0.1-3.6
Bierlein et al.[21] 1953 PVTX CO2/H2S 273-370 1.5-8.5 V: ±0.02% T: ±0.02K Cook[22] 1953 TPxy CO2/N2O 293.15-307.15 5-7.3 P: ±0.01atm T: ±0.01K Donnelly et al. [23] 1954 TPxy CO2/CH4 167-301 2.0-7.4
Sobocinski and Kurata
[24] 1959 TPxy CO2/H2S 224.8-363.71 0.7-8.3
P: ±1~2lb./sq T: ±0.1~0.2F Hensel et al. [25] 1964 TPxy CO2/CH4/H2S 222-238.75 2.1-4.8 T: 0.02K
Muirbrook et al. [26] 1965 TPxy
CO2/O2, CO2/N2,
CO2/N2/O2
273.15 5.5-12
P: ±0.1% Zenner and Dana [27] 1965 TPxy CO2/O2, CO2/N2,
CO2/N2/O2
218.15-273.15 1.3-15 Kestin et al. [28] 1966 PVTX CO2/Ar
293.15-303.15 0.101-2.58
P: ±0.5% T: ±1K Kaminishi et al.[29] 1968 TPxy
CO2/CO, CO2/Ar,
CO2/CH4,
CO2/CO/H2
223.15-283.15 2.4-20 Neumann and Walch
[30] 1968 TPxy CO2/CH4
208,45-219.85 44-69 Spano et al. [31] 1968 TPxy CO2/H2 219.9-289.9 1.1-2012
Fredenslund et al.[32] 1970 TPxy CO2/O2
223.15-283.15 1-13 P: ±0.5% T: ±0.02K Arai et al. [33] 1971 PVTX CO2/N2, CO2/CH4 253-288 5-15 P: ±0.01atm T: ±0.01K Chang et al.[34] 1971 Solubility CO2/N2O4
Lemkowitz et al.[35] 1971 Bubble
Point CO2/NH3
413.3-468.2 4.2-17.5 P: ±0.1atm T: ±0.1K Sarashina et al.[36] 1971 PVTX CO2/Ar 288.15 5.69-9.77
P: ±0.01atm T: ±0.01K Sarashina et al.[37] 1971 PVTX CO2/CH4/N2 233.15-273.15 6-10 P: ±0.01atm T: ±0.01K Fredenslund et al. [38] 1972 TPxy CO2/O2
223.75 0.9-14.1 P: ±0.015atm T: ±0.01K Lemkowitz et al. [39] 1972 Bubble
Point CO2/NH3
418-531 7.8-81 P: ±0.1atm T: ±0.1K Davalos et al. [40] 1976 TPxy CO2/CH4 230-250 0.9-8.5
Altunin et al.[41] 1977 Comp CO2/Ar 303.15 0.29-10.75
Mraw et al.[42] 1978 TPxy CO2/CH4 89-208 0.5-6.3
Somait et al.[43] 1978 TPxy CO2/CH4, CO2/N2 270 3-12
P: ±0.015atm T: ±0.02K Tsang and Streett[44] 1981 TPxy CO2/H2
220-290 14-172 P: ±0.5% T: ±0.02K Al-Sahhaf [45] 1983 TPxy CO2/N2, CO2/CH4, CO2/CH4/N2 219.26-270 0.58-16.15 P: ±0.1% T: ±0.02K Dorau et al. [46] 1983 TPxy CO2/N2
223.15-273.15 3-20 Yorizane et al. [47] 1985 TPxy CO2/N2 273.2-298.2 4.5-8.14
P: ±0.5% T: ±0.1K Mallu et al.[48] 1987 Comp and 2nd Virial coefficient CO2/CO 323.15-423.15 0-6.50 Hacura et al.[49] 1988 PVTX CO2/N2 323-348 500-2500 P: ±2.5bar T: ±0.5K Magee and Ely[50] 1988 PVTX CO2/CH4
225-400 2-35 P: ±0.01% T: ±0.05K Brugge et al.[51] 1989 Comp CO2/CH4, CO2/N2
300 and 320 0.1-10.6 P: ±0.015% T: ±0.002K Ely et al.[52] 1989 PVTX CO2/CH4, CO2/N2
250-330 2.3-32 P: ±0.01% T: ±0.001K
Esper et al.[53] 1989 PVTX CO2/N2 205-320 0.1-48
P: ±0.015% T: ±0.01K McElory et al. [54] 1989 Comp CO2/CH4/N2 303.15-333.2 3.79-12.64
P: ±0.1% T: ±0.01K Trappehl and Knapp[55] 1989 TPxy CO2/CH4/N2 220 2-12
Al-Sahhaf [56] 1990 TPxy CO2/CH4/N2 230-250 6.21-10.34 P: ±0.1% T: ±0.02K Xu et al.[57] 1992 TPxy CO2/N2, CO2/CH4, CO2/CH4/N2 288 and 293 5.11-9.11 P: ±0.02Mpa T: ±0.01K Seitz et al.[58] 1996 PVTX CO2/CH4/N2 323.15-523.15 19.9-99.9 Bezanehtak et al.[59] 2002 PVTX CO2/H2 278.15-290.15 4.8-19.2 3.2 Knowledge gaps
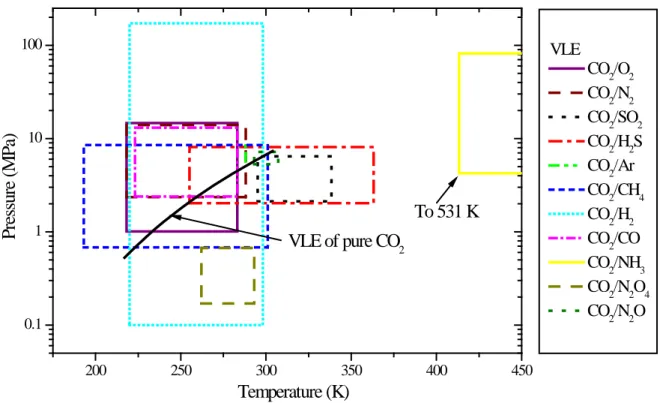
The ranges of T, P, x and y for the experimental data of the VLE and the volume are summarized in Tables 5 and 6 and illustrated in Figure 3 and 4 respectively. Compared to the operating windows given in Table 1, there are, obviously, some gaps between the available experimental data and the requirements with respect to design and operation in CCS.
Table 5 Summary of the TPxy ranges of the VLE experimental data for CO2 mixtures
Mixtures T (K) P (Mpa) xCO2+ yCO2+ No. of Exp. Point
CO2/O2 218.15-283.15 1.01-14.70 0.0-0.999 0.0-0.95 >100 CO2/N2 218.15-403.15 0.60-13.95 0.43-1.00 0.153-1.00 >100 CO2/SO2 295.15-338.45 2.12-6.43 - 0.75-0.93 91 CO2/H2S 255.15-363.15 2.03-8.11 0.01-0.97 0.05-0.97 >100 CO2/Ar 233.15-288.15 4.4-11.6 0.69-0.967 0.266-0.94 25 CO2/CH4 193.15-301 0.68-8.5 0.026-0.99 0.026-0.96 >100 CO2/H2 220-298.15 0-172 0.444-0.988 0.067-0.898 >300 CO2/CO 223.15-283.15 2.39-13.08 0.631-0.957 0.213-0.827 22 CO2/NH3 413.35-531.15 4.25-81.67 0.023-0.333 - 62
CO2/COS NA CO2/N2O4 262.15-293.15 0.17-0.67 0.005-0.021 - 8 CO2/N2O 293.15-307.15 5.3-7.2 0.258-0.881 0.258-0.881 >100 CO2/CH4/N2 220-293.45 6-10 0.543-0.989 0.266-0.974 >100 CO2/O2/N2 218.15-273.15 5.1-13 0-0.925 0-0.611 80 CO2/CO/H2 233.15-283.15 2-20 0.527-0.977 0.174-0.726 31 CO2/CH4/H2S 222.15-238.75 2.07-4.83 0.108-0.776 0.024-0.543 16 + Mole fraction
For the VLE property, there are no data about CO2/COS, and quite few data about CO2/N2O according
to Table 5. For the CO2/SO2 mixture, few experimental data are available at temperatures below 290K;
while few experimental data are available at pressures below 4.4 MPa for CO2/Ar and few experimental
data are available at pressures over 0.7 MPa for CO2/N2O4. For CO2/CO, the quantity of data is rather
small. In addition, only few experimental data are available for multi-component CO2 mixtures, such as
CO2/CH4/N2, CO2/N2/O2, CO2/CH4/H2S and CO2/CO/H2.
The saturation line of pure CO2 is illustrated by the solid black curve in Figure 3. The range of the
VLE data for some of the mixtures, such as CO2/SO2, differs considerably from pure CO2, illustrating
that the VLE behaviour of the mixture may be quite different from pure CO2. The relevant T/P range for
the VLE data will thus change from mixture to mixture. Since the amount of impurities in CCS is modest according to Table 3 (<10%), it is reasonable to assume that the T/P range of available VLE data (the coloured boxes in Figure 3) should ideally cover most of the CO2 saturation line to satisfy the
requirements of CCS applications. For some mixtures, such as CO2/CH4 and CO2/N2, the range of the
VLE data covers the whole curve, but for mixtures such as CO2/Ar, CO2/CO, and CO2/SO2, the boxes
cover little of the phase envelope, which clearly displays the need of more data. According to the figure, the T/P range of the CO2/NH3 system is very different from all the other binary systems. This can be
explained by the chemical reactions which occur in addition to the VLE [39], with formation of ammonium carbarnate at temperatures less than ~ 400 K and urea and water at larger temperatures,
making it a complex system with 5 components. The T/P range of future VLE experiments, for example for the mixtures CO2/H2S, CO2/CO and CO2-SO2 may easily be identified using Figure 3.
200 250 300 350 400 450 0.1 1 10 100 VLE CO2/O2 CO2/N2 CO2/SO2 CO2/H2S CO2/Ar CO2/CH4 CO2/H2 CO2/CO CO2/NH3 CO2/N2O4 CO2/N2O P res su re ( M P a) Temperature (K) VLE of pure CO2 To 531 K
Figure 3 T/P ranges of the experimental data about the VLE of CO2 mixtures
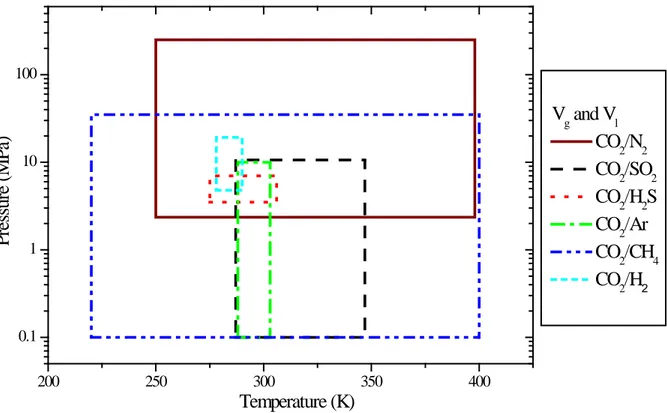
For the volume property, the situation of the experimental measurements is even worse than for the VLE property. There are no published experimental data on the volume of CO2/O2, CO2/CO, CO2/N2O4,
CO2/COS and CO2/NH3 and the liquid volume of CO2/H2. For CO2/H2S and CO2/N2O, some
experimental data are available, but only for saturated phases. For multi-component CO2 mixtures, the
situation is similar for the volume as for the VLE property, with very few data available. Figure 4 shows the T/P range of the available experiments for the volume property. The binary mixtures containing CH4
and N2 cover a decent part of the T/P space, while it is not true for the mixtures containing Ar, H2 and
H2S. Another concern is that few volume measurements are conducted at temperatures higher than 400
K. But it is significant to have sufficient experimental data to span the whole T/P range relevant for CCS applications (218-1620 K and ~ 0-50 MPa).
Table 6 Summary of TPxy ranges of the experimental volume data for CO2 mixtures
Phase T (K) P (Mpa) xCO2+ yCO2+ No. of Exp. Point
CO2/O2 Vg NA Vl NA CO2/N2 Vg 253.15-398.15 2.35-250 0.25-1 >200 Vl 250-300 2.43-32 0.85-1 80 CO2/SO2 Vg 287.15-347.35 0.10-7.60 0.125-0.927 120 Vl 299.15-341.15 5.67-10.64 0.125-0.927 36 CO2/H2S* Vg 278.05-304.86 3.50-6.99 0.83-0.90 16 Vl 275.07-306.27 3.50-6.99 0.83-0.90 16 CO2/Ar Vg 293.15-303.15 0.10-2.50 0.84-0.92 16 Vl 288.15 7.51-9.78 0.83-0.94 4 CO2/CH4 Vg 219.7-400 0.1-35 0.1-0.98 >300 Vl 220-300 6-35 0.56-0.98 80 CO2/CO Vg NA Vl NA CO2/N2O* Vg 293-307.15 5.3-7.1 0.258-0.881 25 Vl 293-307.15 5.3-7.1 0.258-0.881 25 CO2/H2 Vg NA Vl 278.15-290.15 4.8-19.2 0.8429-0.9912 42 CO2/CH4/N2 Vg 303.15-523.15 3.79-99.9 0-1 100 Vl NA + Mole fraction * Saturated volume
200 250 300 350 400 0.1 1 10 100 Vg and Vl CO2/N2 CO2/SO2 CO2/H2S CO2/Ar CO2/CH4 CO2/H2 P res su re ( M P a) Temperature (K)
Figure 4 The T/P range of the experimental data for the volume of CO2 mixtures
3.3 The precision, consistency and reliability of the experimental data
As experimental measurements are used for model calibration and parameter fitting, it is of great importance to have reliable measurements in order to develop high accuracy models. Table 4 shows that many of the measurements are published before 1980. In order to check the precision, consistency and reliability of the published literature, experimental data available in the same ranges of composition, pressure and temperature have been compared, and the comparison is displayed in the Figures 5-9.
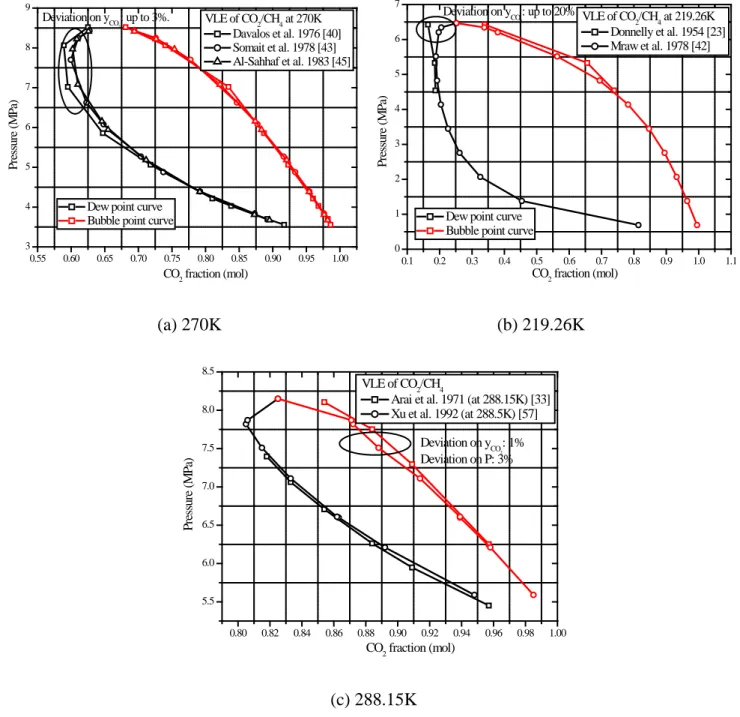
Figure 5 presents the comparison regarding the VLE of CO2/CH4. According to the comparison, the
measured data agree better for the bubble points than for the dew points. Some larger inconsistencies were observed (>5%). For example, as shown in Figure 5 (b), the deviations between Donnelly’s data [23] and Mraw’s data [42] can be up to 20% for the CO2 concentration in the vapor phase at high
pressures. Taking into account the more up to date measuring techniques, the data by Mraw et al. [42] should be preferred. Figure 5 (a) shows a comparison between the sources [40, 43, 45] where the newer data by Somait et al. and Al-Sahhaf et al. agree well and should be preferred. Fig. 5 (c) shows a
comparison of the data by Xu et al. and Arai et al. These data agree well on the dew points, but show different trends for the bubble points. Here, the newer data by Xu et al. [57] are more reliable.
0.55 0.60 0.65 0.70 0.75 0.80 0.85 0.90 0.95 1.00 3 4 5 6 7 8 9 Deviation on yCO 2 : up to 3%. VLE of CO2/CH4 at 270K Davalos et al. 1976 [40] Somait et al. 1978 [43] Al-Sahhaf et al. 1983 [45] P res su re ( M P a) CO2 fraction (mol) Dew point curve
Bubble point curve
0.1 0.2 0.3 0.4 0.5 0.6 0.7 0.8 0.9 1.0 1.1 0 1 2 3 4 5 6 7 Deviation on yCO 2 : up to 20% P res su re ( M P a) CO2 fraction (mol) Dew point curve
Bubble point curve
VLE of CO2/CH4 at 219.26K Donnelly et al. 1954 [23] Mraw et al. 1978 [42] (a) 270K (b) 219.26K 0.80 0.82 0.84 0.86 0.88 0.90 0.92 0.94 0.96 0.98 1.00 5.5 6.0 6.5 7.0 7.5 8.0 8.5 Deviation on yCO 2 : 1% Deviation on P: 3% P res su re ( M P a) CO2 fraction (mol) VLE of CO2/CH4
Arai et al. 1971 (at 288.15K) [33] Xu et al. 1992 (at 288.5K) [57]
(c) 288.15K
Figure 5 Comparison of different experiments about the VLE of CO2/CH4
Figure 6 presents the comparison regarding the VLE of CO2/H2S. According to Figure 6, the data
from Bierlein [21] and Sobocinski [24] agree well. Bierlein [21] compared his measurements with Steckel’s data. The scatter around the mean curve, shown in Figure 4 of [21], is as large as 0.5 atmospheres for some points. Steckel's value for the vapor pressure of pure carbon dioxide deviates
almost 1 atmosphere from the generally accepted value. Therefore, Steckel’s data are not recommended in future model development or verification.
0.0 0.2 0.4 0.6 0.8 1.0 250 260 270 280 290 300
Bubble point curve Dew point curve
T em per at ur e ( K ) CO2 fraction (mol) VLE of CO2/H2S
Bierlein et al. 1953 (at 2.0265 MPa) [21] Sobocinski et al. 1959 (at 2.0684 MPa) [24]
Figure 6 Comparison of different experiments about the VLE of CO2/H2S
Figure 7 presents the comparison regarding the VLE of CO2/O2. Large inconsistencies may be
observed between Fredenslund’s data [32] and Zenner and Dana’s data [27] (Fig. 7(a)). Since the measurements conducted by Fredenslund et al. in 1970 [32] and 1972 [38] agree quite well, as shown in Fig. 7(b), the data by Fredenslund et al. [32,38] should be preferred.
0.6 0.7 0.8 0.9 1.0 4 5 6 7 8 9 10 11 12 Deviation on yCO 2 : up to 6%
Dew point curve Bubble point curve
P res su re ( M P a) CO2 fraction (mol) VLE of CO2/O2 at 273,15K Fredenslund et al. 1970 [32] Zenner and Dana 1965 [27]
0.0 0.1 0.2 0.3 0.4 0.5 0.6 0.7 0.8 0.9 1.0 0 2 4 6 8 10 12 14
Dew point curve Bubble point curve
P res su re ( M P a) CO2 fraction (mol) VLE of CO2/O2 at 223.15K Fredenslund et al. 1970 [32] Fredenslund et al. 1972 [38] (a) 273.15 K (b) 223.15 K
Figure 8 presents the comparison regarding the VLE and density of CO2/N2. Even though the VLE
measurements ([32] and [38]) were published by the same author, Fredenslund, the data published in different years are not consistent for CO2/N2, even though the author shows consistent measurements for
CO2/O2 (Figure 7). Inconsistency was also identified between the density data from Haney [19] and
Brugge [51]. Additional experiments are required to verify the accuracy of these data.
0.5 0.6 0.7 0.8 0.9 1.0 0 2 4 6 8 10 12 14 Deviation on yCO 2 : about 4%
Dew point curve Bubble point curve
P res su re ( M P a) CO2 fraction (mol) VLE of CO2/N2 at 273.15K Fredenslund et al. 1970 [32] Fredenslund et al. 1972 [38] 0 2 4 6 8 10 0.90 0.92 0.94 0.96 0.98 1.00 Deviaition: 5% C om pr es sib ility Pressure (MPa) Compressibility of CO2/N2
Haney et al., 1944 (at 298.15K CO2%=25.13) [19]
Brugge et al., 1989 (at 300K CO2%=25.15) [51]
(a) VLE at 273.15 K (b) Density at 300 K
Figure 8 Comparison of different experiments about the VLE and density of CO2/N2
Figure 9 presents the comparison regarding the VLE of CO2/H2. Here, it is evident that the
inconsistencies become larger at higher temperatures, for example at 290K (Fig. 9(a)). There is no good agreement among the three available data sources [31, 44, 59], except the data of Bezhanetak [59] and Tsang [44] concerning the bubble point curve at high CO2 concentrations. The reason for this may be
0.5 0.6 0.7 0.8 0.9 1.0 6 8 10 12 14 16 18 20 Deviation on yCO2 : > 15%
Dew point curve Bubble point curve
P res su re ( M P a) CO2 fraction (mol) VLE of CO2/H2
Spano et al. 1968 (at 289.9K) [31] Bezhanetak et al. 2002 (at 290.15K) [59] Tsang et al. 1981 (at 290.K) [44]
0.0 0.2 0.4 0.6 0.8 1.0 0 20 40 60 80 100 VLE of CO2/H2 Spano et al. 1968 (220K) [31] Spano et al. 1968 (260K) [31] Tsang et al. 1981 (220K) [44] Tsang et al. 1981 (260K) [44] P res su re ( M P a) CO2 fraction (mol) Bubble point curve
Dew point curve
(a) 290 K (b) 220 and 260 K
Figure 9 Comparison of different experiments about the VLE of CO2/H2
4. Existing models
An equation of state (EOS) is a mathematical relation connecting the volume, pressure, temperature and composition of a mixture. From the interrelationships provided by classical thermodynamics, departure functions from ideal gas behaviour and phase equilibria can be calculated. The thermodynamic properties for both the vapour and liquid phases can be calculated with a minimum amount of component data, typically being critical temperatures, pressures and acentric factors. An equation of state may be valid for a wide range of temperatures and pressures, including sub-critical and super-critical regions.
According to the origin, equations of state may be classified into several families. The van der Waals family of cubic equations and the family of extended virial equations are examples. It has been shown that the performances of different models vary for different properties, components and conditions [60-62]. The most commonly encountered EOS relevant for CCS are discussed below, with particular focus on those which already have been tested in the literature. The performance of the EOS is summarized in Table 7.
4.1 Cubic EOS
The cubic equations are, probably, the simplest EOS which predict the existence of a critical point and yield a quantitative representation of vapour-liquid equilibria. Their simple structure makes them popular in engineering applications. Since van der Waals proposed his EOS in 1873, numerous modified versions of cubic EOS with two or more parameters have been developed to improve the predictions of volumetric and phase equilibrium properties of fluids. Examples are the Redlich-Kwong EOS [63](RK), the Soave-Redlich-Kwong EOS [64] (SRK), the Peng-Robinson EOS [65] (PR) and many others. It is well established that cubic EOS can model phase equilibrium satisfactory.
The PR and the Patel-Teja (PT) [66] EOS were investigated by Al-Sahhaf et al. [56]for the VLE of the ternary system N2/CO2/CH4. PR was first used with generalized parameters and then with
fluid-specific temperature-dependent parameters. The three methods gave similar results with no significant advantage of using the fluid-specific temperature-dependent parameters.
Thiery et al. [67] evaluated the SRK EOS for VLE and volume calculations of CO2/N2, CO2/CH4 and
CO2/CH4/N2. Their results showed that with the SRK EOS, the average deviation for the saturated
pressures is around 1% in the temperature range of 208.45-270K for the CO2/CH4 system, 4% in the
temperature range of 218.15-273.15K for the CO2/N2 system, and 2-3% for the CO2/CH4/N2 system.
Duan et al.[68] extended a general EOS, which was developed for pure non-polar systems to polar systems and mixtures. They claimed that the EOS had an average error of 1.6% in density calculations for CO2/H2O, CO2/N2, CO2/CH4 and CO2/N2/CH4. Comparisons with commonly used EOS for
supercritical fluids show that the studied EOS covers far more TPX space with higher accuracy. It is believed to be accurate from supercritical temperatures to 2000K and from 0 to 25000 bar or higher with an average error in the density of less than 2% for both pure components and mixtures in the system H2O/CO2/CH4/N2/CO/H2/O2/H2S/Ar, with possible extension to additional gases.
Later, Duan et al.[69] developed a new cubic EOS modelling the VLE and volumetric properties of natural fluids, such as CO, CO2, N2, O2, NH3, H2O, inert gases and hydrocarbons. For CO2 mixtures, it
agreement with experiments; however, the concrete accuracy was not given. It was also concluded that the new cubic EOS had about the same accuracy as Lee-Kesler [70] EOS (LK) for volumetric calculations.
Boyle and Carroll[71] investigated PR, SRK, PT, PR-Peneloux, SRK-Peneloux and PR-Mathisa EOS for the density calculations of CO2/H2S. The results showed that PT is the most accurate EOS in the
liquid area, the supercritical area and overall with an Absolute Average Deviation (AAD) of 2.16%, 2.26% and 1.82% respectively; while SRK is the most accurate EOS in the vapour area with an AAD of 0.51%.
Austegard et al. [9] evaluated several EOS regarding the mutual solubilities in H2O/CO2/CH4,
including the second order SRK-Huron-Vidal (SRK-HV), the SRK-vdW and the cubic plus association (CPA), which uses a cubic equation, normally SRK, and adds the association term from the Statistical Associating Fluid Theory (SAFT) equation. The results show that SRK-HV is superior to the other two for the mixtures investigated.
Seven cubic equations of state were evaluated concerning the VLE and the density of CO2 mixtures
including CH4, N2, O2, H2S, SO2 and Ar using many of the experimental data presented in this work
[5,72,73]. The EOS evaluated were PR, RK, SRK, PT, 3P1T [74], PR-Peneloux [75], SRK-Peneloux [76], and the improved SRK [77]. The binary interaction parameters, kij, were calibrated with respect to
the VLE data available. In general, with calibrated kij, the cubic EOS gave an AAD within 5% for VLE
calculations, and 6% for calculations of the density, except for the CO2/SO2 mixture.
Vrabec et al. [78] proposed to use the PR EOS combined with a model based on Henry’s law constants for the ternary mixture CO2/N2/O2 at low temperatures (218-251K). Their results show that
the PR EOS describes both binary and ternary experimental data well, except at high pressures close to the critical region.
4.2 Benedict-Webb-Rubin (BWR) EOS[79]
Virial and extended virial equations of state are used when high accuracy is needed in the calculation of thermodynamic properties and phase behaviour. These multi-parameter equations often require large amount of high accuracy data for parameter estimation, and there may be problems in determining unique values for these parameters. With a slight loss in accuracy, these problems could be solved by using the extended virial equations in a corresponding-state form.
With the commercial software Aspen Plus, a virial type EOS was evaluated regarding the calculations of VLE and density of CO2 mixtures containing CH4, N2, O2, H2S, SO2 and Ar [80]. The results showed
that BWR could give a better accuracy than cubic EOS for some mixtures like CO2/SO2, CO2/N2 and
CO2/O2. However, the difference in the accuracy of the saturated pressures is usually less than 3%.
The EOS by Lee-Kesler [70] (LK) is a modified form of the BWR EOS. The performance of LK for the CO2/CH4/N2 system does not show any advantages compared to cubic EOS, such as PR and PT,
except in the calculations of volumes.45 Al-Sahhaf et al. [45] compared the multi-fluid reference corresponding states method proposed by Teja and Rice [81], LK and the PR EOS for the system CO2/CH4/N2. The multi-fluid model and LK gave comparable results for the CO2/CH4/N2 system.
However, the multi-fluid model predictions were slightly better than the predictions of LK for the ternary system. The cubic PR EOS was found to be better than both corresponding states methods in VLE calculations for both binary and ternary mixtures. In addition, none of the methods provided a good representation near the critical points.
Thiery et al. [67] also calculated the thermodynamic properties of the CO2/CH4/N2 system with the
LK EOS. For the calculations of molar volumes of the mixture, the relative deviations for the LK EOS were smaller than 5%, except in the critical and the retrograde condensation regions, where the relative errors could reach 10-20%.
4.3 Statistical Associating Fluid Theory EOS
Molecular-based equations of state which also have a foundation in statistical mechanics are also very attractive EOS for CO2 mixtures. Among them, the Statistical Associating Fluid Theory (SAFT) EOS
has become very popular because of its capability of successfully predicting thermodynamic properties of several complex fluids, including chain, aromatic and chlorinated hydrocarbons, esters, alkanols, carboxylic acids, and many others. SAFT was envisioned as an application of Wertheim’s theory [82] of association through the use of a first-order thermodynamic perturbation theory to formulate a physically based EOS. The original SAFT EOS was first introduced by Chapman et al. in 1990 [83] and has inspired much derived work on the modeling of polymer-solvent systems. An advantage of SAFT-type equations compared to other approaches is that, as they are based on statistical mechanics, parameters have a clear physical meaning. When carefully fitted they can be used with predictive power to explore other regions of the phase diagram far from the data and operating conditions used in the parameter regression. They typically perform better than other models for interacting compounds, and have found to yield better results than for example activity coefficient models [83,84].
Belkadi et al.[86] evaluated the soft-SAFT EOS regarding the VLE of CO2/NOx. The soft-SAFT EOS
is a modification of the original SAFT equation where the main difference is the use of the Lennard– Jones intermolecular potential for the reference fluid in the soft-SAFT equation, with dispersive and repulsive forces into the same term, while the original SAFT EOS has a perturbation scheme based on a hard sphere reference fluid plus dispersive contributions to it. A recent modelling work on the VLE of CO2–perfluoroalkanes mixtures using the soft-SAFT equation of state showed that no binary interaction
parameters are needed when the quadrupolar moment of CO2 is explicitly included and the involved
molecules do not differ substantially in size. In that case, the quadrupolar effect on the phase equilibrium is not hidden in the binary parameter value, but explicitly described. This increases the extrapolation capability of the model. Belkadi et al. [85] concluded that the soft-SAFT model was successfully able to capture the non-ideal behaviour of the CO2+NO2/N2O4 system.
4.4 Predictive EOS
Predictive EOS is a type of EOS which combines a cubic EOS with a group contribution method. They typically use the UNIFAC method to calculate the mixture parameters. The main advantage is that the VLE can be predicted for a large number of systems without introducing new model parameters which must be fitted to experimental VLE data[86].
The predictive-SRK EOS [86] was evaluated with Aspen Plus regarding the calculations of VLE and density of CO2 mixtures containing impurities77. PSRK is similar but slightly less accurate than the
BWR EOS. However, both BWR and PSRK have a much more complicated structure than cubic EOS. Their calculation procedure and applications, consequently, are not as straightforward as cubic EOS.
The predictive-PR (PPR) EOS was evaluated by Vitu et al. [87] regarding the phase equilibria of CO2+n-alkanes. The authors claimed that their applications of PPR always leads to better results than
PSRK, SAFT-VR [88], PC-SAFT [89], soft-SAFT, GC-SAFT [90] and PRSV-WS [91], without giving any details from their calculations of the CO2/CH4 system. The PPR EOS has also been extended to any
mixture containing hydrocarbons+CO2+H2S+N2.
4.5 The GERG equation[92]
This EOS was adopted under the name GERG-2004 by the GERG (Group Européen de Recherche Gazières) as the international reference equation of state for natural gases. The EOS may be used to calculate a number of thermodynamic properties of mixtures containing natural gas components. It is thus suitable for all technical applications using natural gas, e.g. pipeline transport and processes with liquefied natural gas. The GERG EOS is principally different from the other EOS discussed above because its formulation is based on a multi-fluid approximation, which is explicit in the reduced Helmholtz energy depending on the density, the temperature and the composition. The equation was developed by the Lehrstuhl für Thermodynamik at the Ruhr-Universität Bochum. It covers the whole fluid region (gas, liquid, supercritical region, liquid-vapour phase boundaries) of natural gas mixtures including the 18 most relevant components (methane, nitrogen, carbon dioxide, ethane, propane,
n-butane, isobutene, n-pentane, isopentane, n-hexane, n-heptane, n-octane, hydrogen, oxygen, carbon monoxide, water, helium and argon). Since GERG is explicit in the reduced Helmholtz energy, all thermodynamic properties can be calculated from combinations of the derivatives. This is feasible, since it eliminates the need of integrating pressure explicit relations in the calculation of caloric properties.
The accuracy of the GERG EOS claims to be very high and the normal range of validity covers temperatures between 90K and 450 K and pressures less than 35MPa. This covers a large part of the T/P range for CCS applications, except regions with large temperatures or large pressures. The reported uncertainty of the EOS regarding gas phase density and the speed of sound is less than 0.1% from 250K/270K to 450K and pressures up to 35MPa. In the liquid phase of many binary and multi-component mixtures, the uncertainty of the equation regarding the density is less than 0.1%- 0.5%. Based on the poor data situation, the VLE should be described as accurately as possible.
For solutions with large amounts of methane, GERG 2004 has a better accuracy than other EOS, because it was calibrated based on a tremendous amount of experimental data. However, since many impurities, such as NOx, COS, H2S and SO2, were not involved in the database which GERG was based
on, its applications are limited to mixtures not containing sulphur. Moreover, there are some differences between the uncertainties given by its manual and accuracy testes performed for CO2 rich mixtures. The
accuracy claimed by the GERG manual [92] was not obtained neither for the volume nor VLE calculations of CO2 rich mixtures [80]. The AAD of the liquid volume of CO2 mixtures could reach up
to 18%, which is considerably larger than the AAD reported by the GERG manual [80] (for details, see Table 7).
5. Discussion
This work has summarized the experimental PVTxy data available for CO2 rich mixtures relevant for
CCS. Some knowledge gaps were identified between available experimental data and requirements, and some inconsistencies were pointed out among the existing experimental data. Moreover, the accuracy of old data sources is questionable, such as the data available for the CO2/SO2 mixture. These data were
obtained 100 years ago, when equipment and laboratory routines were not comparable with the standard today. Therefore, it is of importance to provide new data with a higher accuracy for many of the mixtures. This is also in correspondence with the investigations of the industrial requirements for thermodynamic and transport properties performed by Hendriks et al. [93] Their results showed that quality is considered more important than quantity. In their work, they conclude that both experimental data and models applicable to CCS obtain more and more focus in the industry.
Although the application of cubic EOS has been verified to be able to give satisfactory results, Vidal [94] argued that it may not be possible to build a cubic EOS which is able to reproduce all the thermodynamic properties of a fluid. They imply that instead of using only one EOS, two or more EOS may be applied for property calculations. The industry on the other hand, has expressed the need of more predictive EOS such as SAFT rather than correlative EOS with limited interpolation capabilities [93].
Meanwhile, many types of EOS have been reviewed concerning thermodynamic property calculations of CO2 mixtures, but the evaluation results of the EOS performance have not pointed to one particular
EOS. The cubic EOS still show advantages over more complicated EOS in the calculation of VLE, while for volume calculations they cannot compete with equations such as LK and SAFT. Of these reasons, more effort should be spent on evaluating and developing EOS for CCS applications. Considering the properties of semi-empirical models, more work on parameter regression for already established models, and also development of new models should be done as soon as new high quality experimental data is available.
Furthermore, it is no doubt that more accurate models are always preferable. However, in order to improve the accuracy, more parameters will have to be included in the EOS, which may reduce the predictive ability. Complicated structures may reduce the applicability of the EOS, for example by increasing the computation time and making the EOS less transparent and harder to implement correctly for the industry [93]. However, the accuracy of thermodynamic models may not be the bottleneck in
many engineering applications. Therefore, it is important to identify an acceptable accuracy for the calculation of thermodynamic properties and subsequently develop criteria of which EOS to select.
Table 7 Summary of the performance of different EOS for the calculation of PVTxy properties of CO2 mixtures
EOS Author T/P/XCO2 Mixtures
Accuracy (Absolute Average Deviation %) VLE Density Vg Vl BWR Li[80] 216-363 K/ 5.2-145 bar/ 0-1 CO2, N2, O2, H2S, SO2, Ar 2.7-9.7 0.8-9.2 >9 Duan96 Duan[68] <2000 K/ <25000 bar H2O, CO2, CH4, N2, CO, H2, O2, H2S, Ar - <2 - Duan04 Duan[69] 230-288 K/ 10-160 bar/ 0-1 CO2/CH4, CO2/N2 - - - GERG 2004 GERG[92] 90-450 K/ <350 bar H2O, CO2, O2, N2, CO, CH4, C2H6, C3H8, n-C4H10, i-C4H10, n-C5H12, i-C5H12, n-C6H14, n-C7H16, n-C8H18, Ar, H2, He 1-3 0.2-0.5 0.1-0.5 Li[80] 216-363 K/ 5.2-145 bar/ 0-1 CO2, N2, O2, Ar 2.2-10.4 0.5-5.7 3.8-18.4
LK Al-Sahhaf[45] 220-270 K/ 6-167 bar/ 0.3-1 CO2, CH4, N2 3-3.9 - - Thiery[67] 220-273 K/ 20-120 bar CO2, CH4, N2 - <5* <5* PR Al-Sahhaf [56] 220-270 K/ <158 bar CO2, CH4, N2 2.1-3.3 - -
Boyle and Carroll [71] 250-450 K/ 0-200 bar/ 0.5-0.94 CO2/H2S - 1.26 (2.76#) 2.81 Li[72] 193-363 K/ 1-143 bar/ 0-1 CH4, N2, O2, H2S, SO2, Ar 1.22-6.04 1.58-13.02 1.74-9.43 Vrabec [78] 218-253K CO2, N2, O2 - - - PR-Penelous
Boyle and Carroll [71] 250-450 K/ 0-200 bar/ 0.5-0.94 CO2/H2S - 1.39 (3.24#) 3.53 Li[73] 220-347 K/ CO2, CH4, N2, H2S, SO2, Ar - 2.85-11.64 3.79-10.51
1-143 bar/ 0-1 PT Al-Sahhaf[56] 220-270 K/ <15 8bar CO2, CH4, N2 1.6-3.2 - -
Boyle and Carroll [71] 250-450 K/ 0-200 bar/ 0.5-0.94 CO2/H2S - 1.02 (2.26#) 2.16 Li[72] 193-363 K/ 1-143 bar/ 0-1 CO2, CH4, N2, O2, H2S, SO2, Ar 2.32-10.82 0.98-13.06 1.77-9.28 Predictive PR Vitu[87] 165.2-673 K/ 3-490 bar/ 0-1 CO2, n-alkanes - - - RK Li[72] 193-363 K/ 1-143 bar/ 0-1 CO2, CH4, N2, O2, H2S, SO2, Ar 5.25-14.17 1.47-14.26 4.86-11.96
SAFT Belkadi[85] 298-328 K CO2+NO2/N2O4 0.003-2.2 - -
SRK Boyle and Carroll
[71] 250-450 K/ CO2/H2S - 0.51 (2.79
#
0-200 bar/ 0.5-0.94 Li[72] 193-363 K/ 1-143 bar/ 0-1 CO2, CH4, N2, O2, H2S, SO2, Ar 1.32-11.28 1.50-14.00 4.18-10.84 SRK-HV Austegard[9] 245-383 K/ 1-3500 bar H2O, CO2, CH4 3-9.3@ - - SRK-Peneloux
Boyle and Carroll [71] 250-450 K/ 0-200 bar/ 0.5-0.94 CO2/H2S - 0.65 (2.89#) 5 Li[73] 220-347 K/ 1-143 bar/ 0-1 CO2, CH4, N2, H2S, SO2, Ar - 2.59-12.76 4.97-12.15 Improved SRK Li[73] 220-347 K/ 1-143 bar/ 0-1 CO2, CH4, N2, H2S, SO2, Ar - 5.17-8.83 4.64-13.21 Predictive SRK Li[80] 216-363 K/ 5.2-145 bar/ CO2, N2, O2, H2S, SO2, Ar 1.4-16.2 0.6-9.2 >9
0-1 3P1T Li[72] 193-363 K/ 5-140 bar/ 0-1 CO2, CH4, N2, O2, H2S, SO2, Ar 3.32-25.75 - - *
10-20% in the critical and the retrograde regions
#
In supercritical area
@
6. Conclusions
This work has reviewed both the available experimental data and the theoretical models presented in the literature regarding thermodynamic properties (PVTxy) of CO2 mixtures with
impurities. It was shown that:
(1) Compared to the operating windows of CO2 capture, transport and storage, there are still
some gaps between available experimental data and the requirements in design and operation. The major problems are: for the VLE property, there are no data about CO2/COS and quite
few data about CO2/N2O4, and only a few of the experimental data are available for
multi-component CO2 mixtures. For the volume property, there are no experimental data on the
volume of CO2/O2, CO2/CO, CO2/ N2O4, CO2/COS and CO2/NH3 and also not the liquid
volume of CO2/H2. Also for multi-component CO2 mixtures, experimental data for the
volume property are scarce.
(2) Among the available experimental data, some inconsistencies have been identified. For example, at high pressures, the deviations between Donnelly’s data [23] and Mraw’s data [42] for CO2/ CH4 can be up to 20% for the CO2 concentration in the vapor phase; and there is no
good agreement among the three available data sources for the dew points of CO2/H2 at high
temperatures (290K). Therefore, more experiments should be planned to verify the accuracy of these measurements.
(3) Among the existing thermodynamic models, cubic equations of state have the simplest structure and are capable of giving reasonable results for the PVTxy properties of CO2
mixtures, if the binary interaction parameters kij are calibrated. EOS with complicated
structures, such as BWR and SAFT, have shown to give a better accuracy than cubic EOS for volume calculations, but cubic EOS on the other hand, show an advantage in VLE calculations. GERG, according to its claimed accuracy, should give the best results. The
equation is however intended for natural gas components, and not CO2-rich mixtures and its
applications are limited to certain impurities.
(4) Currently, none of the EOS evaluated in the literature show any clear advantage in CCS applications for both VLE and volume calculations. Because of this situation, we suggest that more experimental measurements about the PVTxy properties of CO2 rich mixtures should be
conducted, including both binary and multi-component mixtures in order to ensure sufficient data for proper development of future EOS. In addition, it is also of importance to identify the accepted accuracy according to the demands of process design and operation before a proper model could be developed for CCS applications. A reference EOS for CCS should be a goal for the future.
Acknowledgement
This publication has been produced with support from the BIGCCS Centre, performed under the Norwegian research program Centres for Energy Efficient Research. The authors acknowledge the following partners for their contributions: Aker Solutions, ConocoPhilips Skandinavia AS, Det Norske Veritas AS, Gassco AS, Hydro Aluminium AS, Shell Technology AS, Statkraft Development AS, StatoilHydro Petroleum AS, TOTAL E&P Norge AS, and the Research Council of Norway.
Nomenclatur e:
α Helmholtz energy
kij Binary interaction parameter
ρ Density
P Pressure
R Gas constant
T Temperature
x Mole fraction in liquid phase
X Total mole fraction
y Mole fraction in vapour phase
Abbr eviation:
BWR Benedict-Webb-Rubin
CCS CO2 capture and storage
Comp Compressibility
CPA Cubic plus association
EOS Equation of state
GERG Group Européen de Recherche Gazières
HV Huron-Vidal
ISRK Improved Soave-Redlich-Kwong
LK Lee-Kesler MPR Modified Peng-Robinson MSRK Modified Soave-Redlich-Kwong PR Peng-Robinson PPR Predictive-Peng-Robinson PSRK Predictive Redlich-Kwong-Soave PT Patel-Teja PVTxy Pressure-Volume-Temperature-Composition RK Redlich-Kwong
SAFT Statistical associating fluid theory
SRK Soave-Redlich-Kwong
VLE Vapour liquid equilibrium
Subscr ipt:
g Gas
l Liquid
Refer ence:
[1] de Koeijer G, Borch JH, Drescher M, Li H, Wilhelmsen Ø, Jakobsen J. CO2 Transport –
Depressurization, Heat Transfer and Impurities. In: Proceedings of 10th International Conference on Greenhouse Gas Technologies, Sep. 19-23, Amsterdam, The Netherlands, 2010.
[2] Li H, Yan J. Impact of impurities in CO2-fluids on CO2 transport process. In:
Proceedings of GT2006, ASME turbo expo 2006: power for land, sea and air, May 8– 11, Barcelona, Spain, 2006.
[3] Li H, Yan J, Yan J, Anheden M. Impurity Impacts on the Purification Process in Oxy-fuel Combustion Based CO2 Capture and Storage System. Appl. Energy. 2009; 86(2):
202-213.
[4] Intergovernmental Panel on Climate Change (IPCC). IPCC Special Report on Carbon Dioxide Capture and Storage. Cambridge University Press, Cambridge, United Kingdom / New York, USA, 2005.
[5] Li H. Thermodynamic Properties of CO2 Mixtures and Their Applications in Advanced
Power Cycles with CO2 Capture Processes. Doctoral thesis of Royal Institute of
Technology, Stockholm, Sweden, 2008.
[6] Spycher N, Pruess K, Ennis-King J. CO2-H2O mixtures in the geological sequestration
of CO2. I. Assessment and calculation of mutual solubilities from 12 to 100°C and up to
[7] Chapoy A, Mohammadi AH, Chareton A, Tohidi B, Richon D. Measurement and modelling of gas solubility and literature review of the properties for the carbon dioxide-water system. Ind. Eng. Chem. Res. 2004;43:1794-1802.
[8] Poplsteinova J. Absorption of carbon dioxide – modeling and experimental characterization. Doctor thesis, Norwegian University of Science and Technology, Trondheim, Norway, 2004.
[9] Austegard A, Solbraa E, de Koeijer G, Mølnvik M. J. Thermodynamic models for calculating mutual solubilities in H2O–CO2–CH4 mixtures. Chem. Eng. Res. Design.
2006;84(A9):781-794.
[10] Hu J, Duan Z, Zhu C, Chou I. PVTx properties of the CO2-H2O and CO2-H2O-NaCl
systems below 647K: Assessment of experimental data and thermodynamic models. Chemical Geology. 2007; 238: 249-267.
[11] Bottinger W, Maiwald M, Hasse H. Online NMR spectroscopic study of species distribution in MEA–H2O–CO2 and DEA–H2O–CO2. Fluid Phase Equilib.
2008;263:131-143.
[12] Faramarzi L, Kontogeorgis GM, Thomsen K, Stenby EH. Extended UNIQUAC model for thermodynamic modeling of CO2 absorption inaqueous alkanolamine solutions.
Fluid Phase Equilib. 2009;282:121-132.
[13] Li H, Jakobsen JP, Stang J. Predicting water concentration at equilibrium with CO2
hydrates. Int. J. Greenhouse Gas Control. In press.
[14] Visser E, Hendriks C, Barrio M, Mølnvik MJ, der Koeijer G, Liljemark S, Gallo Y. Dynamis CO2 quality recommendations. Int. J. Greenhouse Gas Control.
[15] Caubet F. Liquéfaction des mélanges gazeux, Université de Bordeaux. 1901.
[16] Booth HS, Carter JM. The critical constants of carbon dioxide-oxygen mixtures. J. Phys. Chem. 1930;34:2801-2825.
[17] Cummings LWT. High-pressure rectification, I-vapor-liquid equilibrium relations at high pressures. Ind. Eng. Chem. 1931;23(8):900-2.
[18] Reamer HH, Olds RH, Sage BH, Lacey WN. Phase equilibria in hydrocarbon systems: methane-carbon dioxide system in the gaseous region. Ind. Eng. Chem. 1944;35(1):88-90.
[19] Haney RED, Bliss H. Compressibilities of nitrogen-carbon dioxide mixtures. Ind. Eng. Chem. 1944;36(11):985.
[20] von Steckel F. Dampf-Flussigkeits-Gleichgewichte einiger binarer, schwefelwasserstoffhaltiger systeme unter Druck. Svensk Kemisk Tidskrift. 1945;9:209-216.
[21] Bierlein JA, Kay WB. Phase-equilibrium properties of system carbon dioxide-hydrogen sulphide. Ind. Eng. Chem. 1953;45(3):618-624.
[22] Cook D. The carbon-dioxide-nitrous-oxide system in the critical region. Proc. Roy. Soc. London. 1953;A219:245.
[23] Donnelly HG, Katz DL. Phase equilibria in the carbon dioxide-methane system. Ind. Eng. Chem. 1954;46(3):511-7.
[24] Sobocinski DP, Kurata F. Heterogeneous phase equilibria of the hydrgen sulfide-carbon dioxide system. A.I.Ch.E. J. 1959;5(4):545-551.
[25] Hensel WE, Massoth FE. Phase equilibria for the ternary system: CH4-CO2-H2S. J.
Chem. Eng. Data. 1964;9: 352.
[26] Muirbrook NK, Prausnitz JM. Multicompononent Vapor-Liquid Equilibria at High Pressures: Part I Experimental study of the nitrogen-oxygen-carbon dioxide system at 0oC. A.I.Ch.E. J. 1965;1(6):1097-1102.
[27] Zenner GH, Dana LI. Liquid-vapor equilibrium compositions of carbon dioxide-oxygen-nitrogen mixtures. Chemical engineering progress symposium series. 1965;59.
[28] Kestin J, Kobayashi Y, Wood RT. The Viscosity of Four Binary Gaseous Mixtures at 20 and 30oC. Physica Amsterdam. 1966;32:1065-1089.
[29] Kaminishi G, Arai Y, Saito S, Maeda S. Vapor-liquid equilibria for binary and ternary systems containing carbon dioxide. J. Chem., Eng. Jap. 1968;1(2):109-116.
[30] Neumann PNA, Walch W. Dampf/Flussigkeits-Gleichgewicht CH4-CO2 in Bereich
tiefer Temperaturen und kleiner CO2-Molenbruche. Chem. Ing. Techn. 1968;40:241-4.
[31] Spano JO, Heck CK, Barrick PL. Liquid-Vapor Equilibria of the Hydrogen-Carbon Dioxide System. J. Chem. Eng. Data. 1968;13:168-171.
[32] Fredenslund A, Sather GA. Gas-liquid equilibrium of the oxygen-carbon dioxide system. J. Chem. Eng. Data. 1970;15(1):17-22.
[33] Arai Y, Kaminishi G, Saito S. The experimental determination of the P-V-T-X relations for the carbon dioxide-nitrogen and the carbon dioxide-methane system. J. Chem. Eng. Jap. 1971;4(2):113-122.
[34] Chang ET, Gokcen NA, Poston TM. Thermodynamic properties of gases in propellants. Solubilities of gaseous ammonia, carbon monoxide, carbon dioxide, and sulfur hexafluoride. J. Chem. Eng. Data. 1971;16(4):404-8.
[35] Lemkowitz SM, Goedegebuur J, van den Berg PJ. Bubble-point measurements in the ammonia-carbon dioxide system. J. Appl. Chem. Biotechnol. 1971;21:229-232.
[36] Sarashina E, Arai Y, Saito S. The P-V-T-X Relation for the Carbon Dioxide – System. J. Chem. Eng. Jap. 1971;4(4):379-381.
[37] Sarashina E, Arai Y, Saito S. Vapor-liquid equilibria for the nitrogen-methane-carbon dioxide system. J. Chem. Eng. Jap. 1971;4(2):377.
[38] Fredenslund A, Mollerup J, Persson O. Gas-liquid equilibrium of oxygen-carbon dioxide system. J. Chem., Eng. Data. 1972;17(4):440-3.
[39] Lemkowitz SM, Zuidam J, van den Berg PJ. Phase behaviour in the ammonia-carbon dioxide system at and above urea synthesis conditions. J. Appl. Chem. Biotechnol.
1972;22:727-737.
[40] Davalos J, Anderson WR, Phelps RE, Kldnay AJ. Liquid-vapor equilibria at 250.00K for systems containing Methane, Ethane, and Carbon Dioxide. J. Chem. Eng. Data.
1976;21(1):81-4.
[41] Altunin VV, Koposhilov OD. An experimental study of thermal properties of gaseous mixtures of carbon dioxide with argon. Teploenergetika. 1977;24(8):80-3.
[42] Mraw SC, Hwang S, Kobayashi R. Vapor-liquid equilibrium of the CH4-CO2 system at
[43] Somait FA, Kidnay AJ. Liquid-vapor equilibria at 270.00K for system containing nitrogen, methane, and carbon dioxide. J. Chem. Eng. Data. 1978;23(4):301-5.
[44] Tsang CY, Streett WB. Phase Equilibria in the H2/CO2 System at Temperatures from 20
to 290 K and Pressures to 172 MPa. Chem. Eng. Sci. 1981;36:993-1000.
[45] Al-Sahhaf TA, Kidnay AJ, Sloan ED. Liquid + vapour equilibriums in the nitrogen + carbon dioxide + methane system. Ind. Eng. Chem. Fundamen. 1983;22(4):372-380.
[46] Dorau WI, Al-Wakeel M, Knapp H. VLE data for CO2-CF2Cl2, N2-CO2, N2-CF2Cl2 and
N2-CO2-CF2Cl. Cryogen. 1983;29-35.
[47] Yorizane M, Yoshimura S, Masuoka H, Miyano Y, Kakimoto Y. New procedure for vapour–liquid equilibria. Nitrogen + carbon dioxide, methane + Freon 22, and methane + Freon 12. J. Chem. Eng. Data. 1985;30:174-6.
[48] Mallu BV, Natarajan G, Viswanath DS. Compression factors and second virial coefficients of CO2, CO2 and {xCO+(1-x) CO2}. J. Chem. Thermodynamics.
1987;19:549-554.
[49] Hacura A, Yoon JH, Baglin FG. Density values of carbon dioxide and nitrogen mixtures from 500 to 2500 bar at 323 and 348 K. J. Chem. Eng. Data. 1988;33(2):152-4.
[50] Magee JW, Ely JF. Isochoric (P,P,T) measurements on CO2 and (0.98 CO2+0.02 CH4)
from 225 to 400 K and pressures to 35 MPa. Int. J. Thermophysics. 1988;9(4):547-557.
[51] Brugge HB, Hwang CA, Gogers WJ, Holste JC, Hall KR, Lemming W, et al. Experimental cross virial coefficients for binary mixtures of carbon dioxide with nitrogen, methane and ethane at 300 and 320 K. Physica A. 1989;156:382-416.
[52] Ely JF, Haynes WM, Bain BC. Isochoric (p,V,T) measurements on CO2 and on
(0.982CO2+0.018N2) from 250 to 330 K at pressures to 35MPa. J. Chem. Thermodynamics. 1989;21:879-894.
[53] Esper GJ, Bailey DM, Holste JC, Hall KR. Volumetric behavior of near-equimolar mixtures for CO2+CH4 and CO2+N2. Fluid Phase Equilib. 1989;49:35-47.
[54] McElroy PJ, Battino R, Dowd MK. Compression-factor measurements on methane, carbon dioxide, and (methane + carbon dioxide) using a weighing method. J. Chem. Thermodynamics. 1989;21:1287-1300.
[55] Trappehl G, Knapp H. Vapor-liquid equilibria in the ternary mixture N2+CH4+CO2 and
the quaternary mixture N2+CH4+C2H6+C3H8. Cryogen. 1989;29:42-50.
[56] Al-Sahhaf TA. Vaport-liquid equilibria for the ternary system N2-CO2-CH4 at 230 and
250K. Fluid Phase Equilib. 1990;55:159-172.
[57] Xu N, Dong J, Wang Y, Shi J. High pressure vapor liquid equilibrium at 293K for system containing nitrogen, methane and carbon dioxide. Fluid Phase Equilib. 1992;81:175-186.
[58] Seitz JC, Blencoe JG, Bodnar RJ. Volumetric properties for x1CO2+x2CH4+(1-x1-x2)N2
at the pressures (19.94, 39.94, 59.39, 99.39) MPa and temperatures (323.15, 373.15, 473.15, 573.15)K. J. Chem. Thermodynamics. 1996;28:539-556.
[59] Bezanehtak K, Combes GB, Dehghani F, Foster NR. Vapor-liquid equilibrium for binary systems of carbon dioxide + methanol, hydrogen + methanol, and hydrogen + carbon dioxide at high pressures. J. Chem. Eng. Data. 2002;47:161-8.
[60] Abbott MM. Cubic equations of state: an iterative review. Am. Chem. Soc. Adv. Chem. Ser. 1979;182:47-70.
[61] Danesh A, Xu D-H, Todd AC. Comparative study of cubic equations of state for predicting phase behavior and volumetric properties of injection gas-reservoir oil systems. Fluid Phase Equilib. 1991;63:259-278.
[62] Yang J, Griffiths PR, Goodwin ARH. Comparison of methods for calculating thermodynamic properties of binary mixtures in the sub and super critical state: Lee-Kesler and cubic equations of state for binary mixtures containing either CO2 and H2S.
J. Chem. Thermodynamics. 2003;35:1521.
[63] Redlich O, Kwong JNS. On the thermodynamics of solutions. Chem. Rev. 1949;44:233-244.
[64] Soave G. Equilibrium constants for modified Redlich-Kwong equation of state. Chem. Eng. Sci. 1972;27:1196-1203.
[65] Peng DY, Robinson DB. A new two-constant equation of state. Ind. Eng. Chem. Fundam. 1976;15:59-64.
[66] Patel NC, Teja AS. A new cubic equation of state for fluids and fluid mixtures. Chem. Eng. Sci. 1982;37(3):463-473.
[67] Thiery R, Vidal J, Dubessy J. Phase equilibria modelling applied to fluid inclusions: Liquid-vapor equilibria and calculation of the molar volume in the CO2-CH4-N2 system.
[68] Duan Z, Møller N, Weare JH. A general equation of state for supercritical fluid mixtures and molecular dynamics simulation of mixture PVTX properties. Geochim. Cosmochim. Acta 1996;60(7):1209-1216.
[69] Duan Z, Hu J. A new cubic equation of state and its applications to the modelling of vapour-liquid equilibria and volumetric properties of natural fluids. Geochim. Cosmochim. Acta. 2004;68(14):2997-3009.
[70] Lee BI, Kesler MG. A generalized thermodynamic correlation based on three-parameter corresponding states. A. I. Ch. E. J. 1975;21:510.
[71] Boyle TB, Carroll JJ. Study determines best methods for calculating acid-gas density. Oil & Gas J. 2002, Jan 14, 45.
[72] Li H, Yan J. Evaluating cubic equations of state for calculation of vapour-liquid equilibrium of CO2 and CO2 mixtures for CO2 capture and storage processes. Appl.
Energy. 2009;86(6):826-836.
[73] Li H, Yan J. Impacts of equations of state (EOS) and impurities on the volume calculation of CO2 mixtures in the applications of CO2 capture and storage (CCS)
processes. Appl. Energy. 2009;86(12):2760-2770.
[74] Yu J, Lu BC, Iwai Y. Simultaneous calculations of VLE and saturated liquid and vapor volumes by means of a 3P1T cubic EOS. Fluid Phase Equilib. 1987;37:207-222.
[75] Mathias PM, Naheiri T, Oh EM. A density correction for Peng-Robinson equation of state. Fluid Phase Equilib. 1989;47:77-87.
[76] Peneloux A, Rauzy E. A consistent correction for Redlich-Kwong-Soave volumes. Fluid Phase Equilib. 1982;8:7-23.
[77] Ji W, Lempe DA. Density improvement of the SRK equation of state. Fluid Phase Equilib. 1997;130(1-2):49-63.
[78] Vrabec J, Kedia GK, Buchhauser U, Meyer-Pittroff R, Hasse H. Thermodynamic models for vapor-liquid equilibria of nitrogen + oxygen + carbon dioxide at low temperatures. Cryogenics. 2009;49:72-9.
[79] Benedict M, Webb GB, Rubin LC. An empirical equation for thermodynamic properties of light hydrocarbons and their mixtures. J. Chem. Phys. 1940;8:334.
[80] Li H, Yan J, Yan J, Anheden M. Evaluation of Existing Methods for the Thermodynamic Properties Calculation of CO2-Mixtures. Technical report, KTH, 2007.
[81] Teja AS, Rice P. A multifluid corresponding states principle for the thermodynamic properties of fluid mixtures. Chem. Eng. Sci. 1981;36:1-6.
[82] Wertheim MS. Thermodynamic perturbation theory of polymerization. J. Chem. Phys. 1987;7323-7331.
[83] Chapman WG, Gubbins KE, Jackson G, Radosz M. New reference equation of state for associating liquids. Ind. Eng. Chem. Res. 1990;29:1709-1721.
[84] Huang SH, Radosz M. Equation of state for small, large, polydisperse, and associating molecules: extension to fluid mixtures. Ind. Eng. Chem. Res. 1991;30:1994-2005.
[85] Belkadi A, Llovell F, Gerbaud V, Vega LF. Modeling the vapor–liquid equilibrium and association of nitrogen dioxide/dinitrogen tetroxide and its mixtures with carbon dioxide. Fluid Phase Equilib. 2008;266:154-163.
[86] Holderbaum T, Gmehling J. PSRK: A group contribution equation of state based on UNIFAC. Fluid Phase Equilib. 1991;70:251-265.
[87] Vitu S, Privat R, Jaubert JN, Mutelet F. Predicting the phase equilibria of CO2+hydrocarbon systems with the PPR78 model (PR EOD and kij calculated through a
group contribution method). J. Supercritical Fluid. 2008; 45:1-26.
[88] Galindo A, Blas FJ. Theoretical examination of the global fluid phase behavior and critical phenomena in carbon dioxide + n-alkanes binary mixtures. J. Phys. Chem. 2002;B106:4503-4515.
[89] Garcia J, Lugo L, Fernandez J. Phase equilibria, PVT behavior, and critical phenomena in carbon dioxide + n-alkane mixtures using the Perturbed-Chain Statistical Associating Fluid Theory. Ind. Eng. Chem. Res. 2004;43:8345-8353.
[90] Le Thi C, Tamouza S, Passarello JP, Tobaly P, de Hemptinne JC. Modeling phase equilibrium of H2+n-alkane and CO2+n-alkane binary mixtures using a Group
Contribution Statistic Association Fluid Theory Equation of State (GC-SAFT EOS) with a kij Group Contribution Method. Ind. Eng. Chem. Res. 2006;45:6803-6810.
[91] Lopez JA, Cardona CA. Phase equilibrium calculations for carbon dioxide +n-alkanes binary mixtures with the Wong-Sandler mixing rules. Fluid Phase Equilib. 2006;239:206-212.
[92] GERG2004. See: http://www.ruhr-unibochum.de/thermo/Software/Seiten/GERG_2004-eng.htm
[93] Hendriks E, Georgios M, Dohrn R, de Hemptinne J-C, Economou IG, Zilnik FL, Vesovis V. Industrial Requirements for Thermodynamics and Transport Properties. Ind. Eng. Chem. Res. In press.
[94] Vidal J. Equations of state – reworking the old forms. Fluid Phase Equilib. 1983;13:15-33.