Abstract — The objective of this paper is to present the
design of an information system using software agents. The features of the decision-making process concerning a working model of a hybrid energy grid and the functional requirements of the information system are described. Based on an analysis of the information flow occuring during the data processing for making appropriate decisions, a system architecture which combines a set of independent platforms, is proposed. Multi Agent System is used for the implementation and integration with other systems, such as a power system analysis tool, as well as presentation and storage tools.
I. INTRODUCTION
From a production perspective, electrical energy production has become more difficult as traditional big power plants use fossil fuel and therefore are regarded environmentally inappropriate, and as nuclear power plants are regarded inappropriate due to safety. However, to generate energy in large conventional power plant is cheap and not technically difficult. Furthermore, energy distribution to the user could be very expensive due to the significant losses that occur. Many countries are presently introducing the concept of distributed energy production and consumption by using renewable energy sources (RES). This means that the power system mainly consists of medium and small generators that are located directly next to the end user [13] The user cares individually about the use and maintenance of RES. Electricity is generated for user’s own needs, and if there is excess, the user can sell it to the grid where other users can use this energy. The presence of several sources producing electricity, make such a system a hybrid system [1]. Successful examples of using solar and wind energy have already been shown, and the construction of hybrid energy systems has become more attractive.
In addition, RESs are becoming increasingly popular as they produce electricity in a more environmentally friendly way, and therefore are getting financial support from governments. In developing countries often the idea of using RES comes from private stakeholders. However, it is difficult for laymen to operate such grids with maximum benefit as the system is characterized by rapidly changing
operating modes and configurations are depending on external conditions.
The decision making process concerning the management of a distributed grid is complicated by the presence of a large amount of discrete variables that are affecting the system. It can take a long time to make a decision as you want to be sure that the right decision was made with respect to maximize benefit. Thus, it may be convenient to use Decision Support Systems (DSS), which can take on some the user’s tasks. However, before the creation of a DSS, it is necessary to build an information model that can be used to provide the appropriate information to the DSS. It is necessary to determine exactly, what type of tasks that will be taken over by the system, how to solve these tasks, and how to provide the necessary data to the system.
The key goal of this research relates to the development of the architecture of an information system for assessing the current condition of the grid and predicting the future behavior of the grid
To achieve this goal we have identified a set of research tasks, which have their own sub-goal:
Analyze the state-of-the-art in creating DSS by doing a comparison of existing approaches with the aim to determine their usefulness, strengths and weaknesses. Determine the features of the study object - hybrid energy
system. Here we should consider not only the physical structure of system, but also features such as weather conditions, users’ behavior, etc., which influence the system.
Determine what information should be provided by the DSS, which can also be regarded as requirements for system functionality.
Determine the whole cycle of the process of making decision concerning developing information model. At this stage, it should take into account not only the results that will be obtained in the previous stages, but also the ways of software implementation.
Describe the architecture of the system
The Architecture of an Information System for the Management of Hybrid
Energy Grids
Olha Shulyma
Sumy State University, 2, Rymskogo-Korsakova st., 40007
Sumy, Ukraine;
Malmö University, 205 06 Malmö, Sweden
Email:
o.shulym@opm.sumdu.edu.ua
Paul Davidsson
Internet of Things and People Research Center, Malmö University, 205 06 Malmö, Sweden
Email: paul.davidsson@mah.se
Vira Shendryk, Anna
Marchenko
Sumy State University, 2, Rymskogo-Korsakova st., 40007
Sumy, Ukraine Email: {ve-shen, nenja_av}@opm.sumdu.edu.ua
Computer Science and Information Systems pp. 281–288 ACSIS, Vol. 6
c
II. LITERATURE REVIEW
There is a lot of research studying the operation of the grid. In this section, we present a review of the previous work related to the planning of grid with RES.
A vast majority of the systems have been designed to work with hybrid energy system in a particular region. During the planning process of such power grids, two types can be distinguished:
Stand-alone hybrid system [8, 9, 14]
System with connection to an external grid [4]. Also, the DSS differ in their ultimate goal:
Prediction system to determine the type of the used resource [10].
System for investigating the performance based on the optimum design of hybrid systems [8, 6, 14, 10]
Prediction system to determine the output and the consumption of energy [2, 7].
Moreover, the DSS differ in their modeling approach: Systems based on simulators for dynamic models [9, 16,
4, 10].
Systems with analytical models [2, 8, 6].
Finally, for making decisions, special frameworks can be used [4, 10] or systems can combine special techniques to make decisions: linear programming dynamic programming, multi-objective methods, etc.
Brief descriptions of the systems under consideration are given in Table 1.
Although extensive research has been done, it mainly focuses on determining the optimum number of PV/wind power generators. On the other hand, some models are proposed to predict the performance of an energy system, but do not address the energy management for scheduling consumption and selling energy. Thus, it would be useful to build a universal system that could solve all these tasks. In addition, all systems were constructed integrally with the minimum number of independent modules and most of them do not offer any interactivity. Especially complex and confusing for the layman is the treatment of the grid model. Thus, the DSS architecture we propose should take into account all these factors, and based on them and also the physical structure of the grid.
Summarizing all the above, it was decided to develop an information model that is not for a specific grid that physically exists, but a more general model. This decision is based on the desire to build a common information system that can be applied to any laymen in the planning stages of building a grid, as well as for further analysis of its operation. This abstract model also requires the definition of a possible physical implementation, featuring the functionality of its constituent parts.
The DSS architecture proposed in this paper is taking into account all these factors.
TABLE I.
BRIEF DESCRIPTION OF SYSTEMS
Reference System Description
[2] A method for calculating the optimum size of hybrid photovoltaic (PV)/wind energy system, with performance by hourly basis.
[10] A technical and economic study to design a hybrid PV/wind power generating system for one domestic in India.
[6] A technique for analyzing the performance of the autonomous PV/wind hybrid energy systems. [9] A technique to determine the optimum size of hybrid PV/wind energy system.
[14] A computer-based approach for evaluating the general performance of stand-alone PV/wind generating systems.
[8] A new integrated tool and a framework for making complex decision process in the UK energy sector.
[4] A new framework that includes tools for the monitoring and management of housing energy systems. The proposed tools are tested on realistic instances based on the Italian electricity market
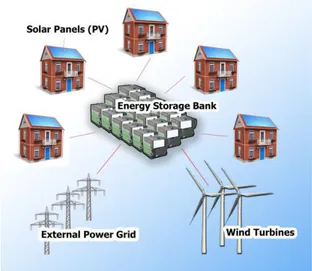
III. THE FEATURES OF THE CONSIDERED ENERGY SYSTEM The term hybrid renewable energy system (HRES) is used to describe any electric power system with more than one type of renewable energy source such as PV, wind, and PV/wind. [7] Such system can be also connected to an external grid.
The type of HRES considered in this paper is illustrated in figure 1. There is a group of buildings with installed PV
(solar) panels. There is also a common park of wind generators and an energy storage bank. Furthermore, there is a connection between the hybrid energy system and an external grid, both for covering consumption peaks and for selling surplus energy.
In every house there is a work schedule of electrical equipment, as well as a model of additional electricity consumption, depending on the daily routines (weekdays, weekends and holidays). Note that in the schedule, the
different working days may vary, power consumption may differ significantly according to this schedule. For instance, the consumption at night and holidays may differ from the daily working at 10-12 times.
Fig. 1. A Schematic Idea of the HRES studied
The question of which renewable energy source to choose has been considered in [16]. The reason for using a common park of wind turbines is that in order to generate a large amount of electricity, wind turbines should be placed on a flat ground with no barriers to air flow. Installation of small wind turbines on the roof of each building does not give enough power in a temperate continental climate. In addition, it should be noted that in most areas with a temperate climate, the of wind intensity changes throughout the year. In the winter, the wind is much stronger than in the summer. For the wind generator setup, this means that in the summer the produced energy is 1.5–2 times less compared to the winter [15].
The intensity of solar energy also is very different depending on the season. If the amount of solar energy on a summer day is 5–7 kWh/m2, it may fall to 0.8–1.2 kWh/m2 on a winter day. Thus, wind turbines work best in winter, and solar panels in the summer. Therefore, it is logical to combine these energy sources into one system. The challenge is to choose power of wind turbine and solar panels in such way that energy production meets the consumption demands during the whole year.
The existence of several sources generating capacity in the system, as well as the mechanisms for storage and sale of electricity, causes the need of a large amount of input data for the construction of an appropriate information system for forecasting energy consumption and sales. Moreover, there is a large number of output and other information that the system should provide. Thus, before designing the system, it is necessary to determine what questions that must be answered by the system and based on them to determine the necessary input information.
IV. QUESTIONS TO THE FUNCTIONING OF THE INFORMATION SYSTEM
The structure of hybrid grid was determined in previous sections, and in previous research [17] was given the analysis of existing methods, that can be applied in information system and tasks of the information simulation of distributed power grid. Thus, on this step can be determined functional requirements, which describe functions that the system executes. They are sometimes known as capabilities [3].
The user of the system eventually wants to know when, from what resources and what amount of energy can be produced or consumed, as well as the best time of the power storage and sale. Thus, were determined next groups of functions with their sub-functions, which helps to get answers:
Gathering information on:
─ weather forecasts for the area (temperature, solar insolation, wind speed, cloudiness, etc.);
─ rates of "green tariff";
─ technical characteristics of the object of observation (the capacity of the grid, the amount of solar insolation etc.);
─ the energy consumption by users. Working with data:
─ to transmit collected data to the system server; ─ to perform data processing and storage; Analytic functions:
─ Hourly forecast of the production of electricity from renewable energy sources, based on the forecasting the weather.
─ Prediction of energy consumption based on appropriate forecast, which operates hourly historical data about energy consumption during the day in each month of the year;
─ Prediction of electricity sales, based on appropriate forecast, which operates data about “green tariffs”. Providing the visual representation of information in
graphs, tables, and reports.
After determining the functionality, it becomes possible to present the information model of the system. Modelling enables a common and comprehensive understanding of a process and can serve as a basis for developing the architecture.
A Data Flow Diagram (DFD) shows the Information View as required data flows between the functions of a system. A summarized scheme of the decision making process at the top level is shown in Figure 2.
Fig. 2. The Information View of Decision Making Process Both “The Environment” and “The Electrification of Buildings” transmit data that corresponds to the displayed list of functional requirements on “gathering information”. “Data Collection” provides storage, conversion and transmission of the received data. “Data Analysis & Making Decision” performs analytic functions and transmits the output data for reports presentation to a user on the production, consumption, and sale of electricity.
To display all of the functionality of the system in accordance with this process, it is necessary to define the basic subsystems and functions to divide between them.
V. THE DISTRIBUTION OF FUNCTIONS BETWEEN COMPONENTS OF INFORMATION SYSTEM
The main actions that the information system should provide are the collection, transmission and storage of information, data analysis, modeling and forecasting, the optimization of consumption and providing recommendations for management decisions, and also providing results in a convenient and understandable form for the users. This makes the structure of the system and it is necessesary to divide it into to several interacting subsystems.
As there are a great variety of approaches of implementing the operation of such systems, the individual subsystems could be implemented in different ways, and we can select the one most suitable for the task. Furthermore, this approach provides an opportunity to improve one part of the system without affecting the others when new requirements on the subsystems or technologies emerge.
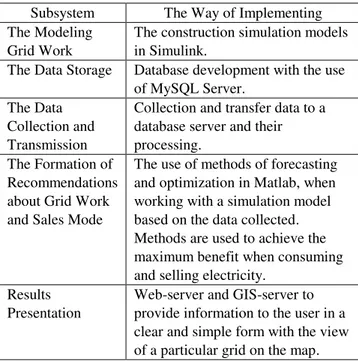
Table II summarizes how the different subsystems are implemented in the first version of the system.
TABLE II.
THE BRIEF DESCRIPTION OF SUBSYSTEMS
Subsystem The Way of Implementing The Modeling
Grid Work
The construction simulation models in Simulink.
The Data Storage Database development with the use of MySQL Server.
The Data Collection and Transmission
Collection and transfer data to a database server and their processing.
The Formation of Recommendations about Grid Work and Sales Mode
The use of methods of forecasting and optimization in Matlab, when working with a simulation model based on the data collected. Methods are used to achieve the maximum benefit when consuming and selling electricity.
Results Presentation
Web-server and GIS-server to provide information to the user in a clear and simple form with the view of a particular grid on the map. In addition, a web interface is used for user input of the desired characteristics of the grid (about the usage of PV panels and/or wind turbines, energy consumption mode, etc.). The reason for presenting information in this form is that the modeling of the grid and decision-making are provided by mathematical software packages with interfaces that are complex to understand for the layman.
In this paper, decision-making is based on modeling of power supply system with the physical features which have been identified above. Initially, it was told that the system should be universal, but there are different grids that connect the system and the system itself may consist of a number of elements and different capacities.
The solution of this problem is provided by the creation of a interface where the user can specify the desired scheme of the grid. But this raises the question of how to model and analyze a system that is not fully known. We propose the use of software agents to handle this.
A multi-agent system is a combination of several agents working in cooperation and to meet certain challenges in order to achieve the system goals. Agents are autonomous in that they can operate without human intervention, are socially-oriented in how they interact with other agents through the language of communication that is understood by all participants. Agents can also sense and respond to environmental perturbations. A multi-agent system is active and able to take initiatives to cause behavioral changes in the grid.
An agent-based approach will help maintain the positive features of the classic client-server approach and overcome most of its weaknesses. When using the agent-based approach, the application is logically divided into a plurality of components having a large degree of autonomy and are
able to communicate with each other. Also, the use of agents makes it possible to balance the load between multiple computing subsystems and conduct parallel processing of data by the asynchronous communication between the agents and the possibility of moving the agent code on the network. Application of this method allows to make full use of existing computing resources and thus solve the problem more efficiently.
There are many approaches based on the principle of assigning an agent for each grid element. This makes it possible to organize the work efficiently, since in this case, each agent is responsible only for a grid element. The agent contains the parameters and characteristics and performs calculations associated only with this element. We propose
to use agents not only for the grid simulation model, but also to provide all the functions in the system.
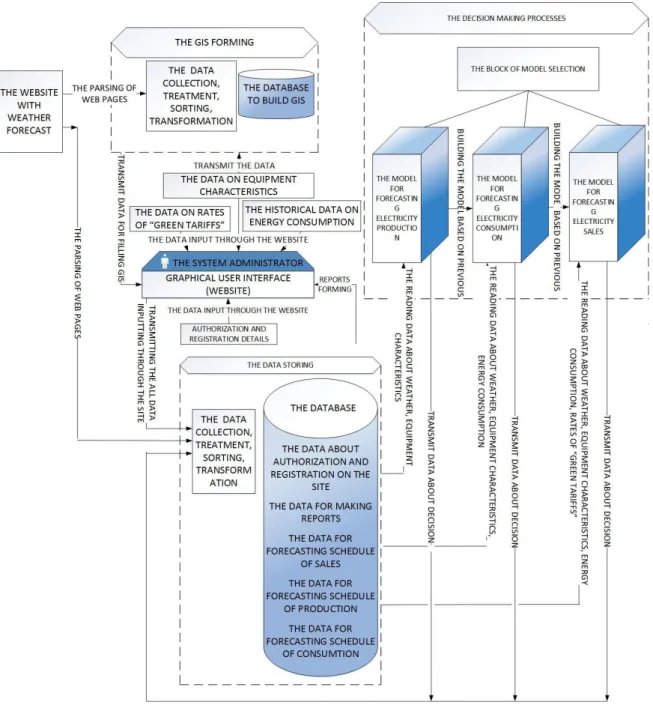
Agents can be built according to the specification FIPA (Foundations for Intelligent Physical Agents). According to its agent platform via TCP/IP connected to external platforms [18]. To determine the set of agents necessary to distribute the system functions among its elements, we analyzed the information flows in the system, which are presented in Fig. 3. In the figure all processes for reading and transmitting data are operated by agents.
During the analysis of information flows, we arrived at the set of agents and their interaction that is shown in Fig. 4.
In the analysis and design of agent-based systems methodologies are used. In this case, as the methodology was used Gaia. According to it, the projected system is represented as an organization, which functions by implementing a set of roles. In the context of the Gaia Agent is an active program module which plays a set of roles.
Fig. 4. An interaction between agents Agents are grouped by their functional purpose:
Interface agents - provide interaction with the user, e.g. presenting output information to the user in a convenient form.
Device agents - gather information on the operation of technical objects in the hybrid power system (e.g., control switch on/off).
Functional agents - transmit relevant data for modeling, forecasting and optimization: load, generation and price predictions, for optimal using RES for generations and sales.
Coordinating agent - receives all partial or local plans from individual agents, analyses them to identify potential inconsistencies and conflicting interactions.
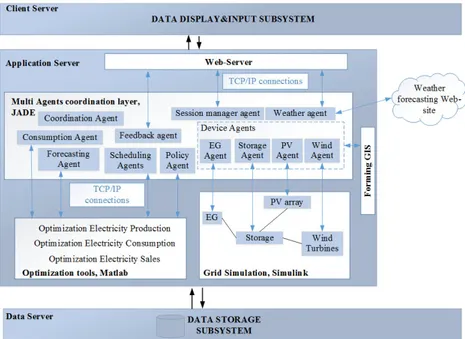
VI. THE ARCHITECTURE OF THE INFORMATION SYSTEM At present, the term “architecture” is used very widely in the practice of designing systems, but it has many different interpretations. In accordance with the international standard for architecture descriptions of systems and software ISO/IEC/IEEE 42010 Systems and software engineering - Architecture description [11], the system has an architecture that can be described from various views of stakeholder, by considering the system architecture. Each point of view on the architecture of the system corresponds to viewpoint, which is based on a set of models kind. In [5] authors determined two points of view:
A conceptual viewpoint, which describes the system in terms of major design elements and their interactions; An implementation viewpoint, which gives a view of the
system in terms of modules or packages and layers; An architecture description of the system from an implementation viewpoint, including agents, but without describing all processes is presented in a figure 5. It should be mentioned, that an information system has a three-tier architecture using software agents. At the first level architecture clients are presented and through created for them an interface they can access to the system and obtain information in a simple to understand form (graphs, charts, maps). On the second level is the logic implemented (charts, models and forecasts), and on the third, storage (the database level).
This information & analytical system of the electrification of buildings and forecasting electricity sales is planned for implementation as a web resource for authorized access of users are providing resource management and operational analysis of the management system of electrification. Thus, before creating the system, it has to divide the functions and actions of system users.
VII. THE USE CASE DIAGRAM OF THE INFORMATION SYSTEM
For determination of all possible expected behavior of the system, Use Case Diagram are often used. They show a set of use cases and actors (a special kind of class) and their relationships [12].
Use Case Diagram combines actors and use cases, and the relationships between them define a small set of relationships to structure actors and use cases. Some use cases relate to others by:
Extending - An extend relationship implies that a Use Case may extend the behavior described in another Use Case, ruled by a condition.
Including - An include relationship means that a Use Case includes the behavior described in another Use Case. Generalization relationships in this case are presented between actors and means that “child” inherits all features and associations of the “parent”, and may add new features and associations.
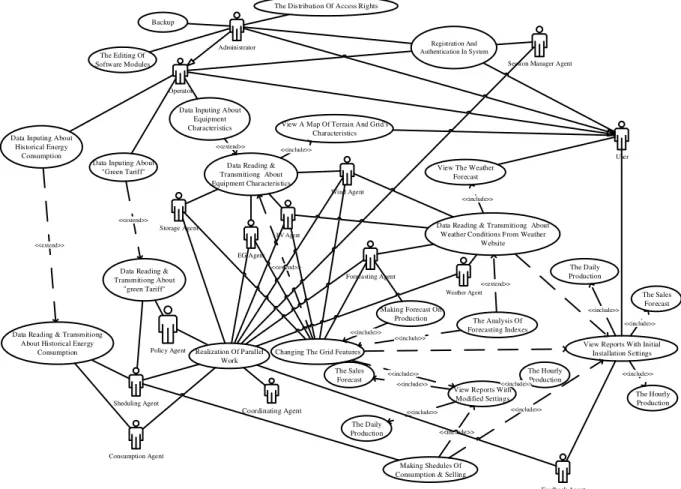
The main functions of the system’s users are presented in Fig. 6 in the form of a Use Case Diagram. The use cases can be seen as a set of requirements to the system or responses that end-users of the system would like to receive. In addition, this diagram allows to determine the users and boundaries of the system, as well as a possible system interface.
Administrator
Operator
User Data Inputing About
Historical Energy Consumption
Backup
The Editing Of Software Modules
The Distribution Of Access Rights
View Reports With Initial Installation Settings The Analysis Of
Forecasting Indexes View The Weather
Forecast Data Inputing About
Equipment Characteristics
Data Inputing About "Green Tariff" The Hourly Production The Daily Production The Sales Forecast Weather Agent
Data Reading & Transmitiong About Weather Conditions From Weather
Website
<<extend>> View A Map Of Terrain And Grid's
Characteristics
Changing The Grid Features
<<include>>
View Reports With Modified Settings The Hourly Production The Daily Production The Sales
Forecast <<include>> <<include>> <<include>>
<<include>>
<<include>> <<include>>
<<include>>
<<include>>
Session Manager Agent
Feedback Agent Storage Agent EG Agent Wind Agent Policy Agent Consumption Agent Forecasting Agent Sheduling Agent Data Reading & Transmitiong About
"green Tariff" <<extend>>
Data Reading & Transmitiong About Historical Energy
Consumption <<extend>>
Registration And Authentication In System
Data Reading & Transmitiong About Equipment Characteristics <<extend>> Making Forecast On Production Making Shedules Of Consumption & Selling <<include>> <<include>> <<extend>> <<include>> <<include>> PV Agent Coordinating Agent Realization Of Parallel Work
Fig. 6. The Use Case Diagram of the System
The actor “Administrator” should have full rights of web-resources management. The Administrator is responsible for the allocation of access rights to the users of the system, has the right to make and edit all the data for analysis, and
decision-making and adjustment of all output data. Also the administrator is responsible for content filling inside the website, database administration, and creation of backups.
The functions of the “Operator” are data collection of information resources and entering the collected data into a unified database. During entering all data are verified and after successful verification record into database. A person enters these data, as it cannot be derived automatically from external resources.
The user and the owner of the power grid act as one entity “User” that performs analysis of the recommendations made by the system on a daily basis.
The actor “Website with weather data” is an external system and its functionality is automated completely.
VIII. THE FURTHER DEVELOPMENT
The set of simulation models will be the basis of the decision-making process, and processing of information flow in the system is considered by combining modeling based on agents with simulation using dynamic models.
The development of software implementation of an information system as website has begun according to the architecture described above. In creating the system, the following main components can be distinguished: Web Server; Website; Agents Platform; Decision Maker Server based on simulation modeling; Database Server; GIS Server.
For their development we are considering the following tools: Server Platform NodeJS; a combination of HTML5, CSS and JavaScript for website, creating; JADE for implementing agents; MatLab to create a simulation model and decision-making; MySQL Server 5.5 as the database server; Quantum GIS as a server for the creation geographical information subsystem.
IX. CONCLUSIONS
Making decisions about the operation of hybrid distributed energy grids is a decentralized problem that can be addressed through building appropriate information and analytical DSS systems. In accordance with the presence of large amount of scattered information and the different tasks involved in the operation of the system, it is appropriate to use in a number of different components in the system. Therefore, we proposed a multi agent system platform for the implementation and integrating with others, such as power system analysis, presentation, and storage tools.
This paper addressed the problem of a scientific substantiation and solving problems with efficiency in data management for information flows in distributed hybrid energy grids through the development of information models of the system. Based on the analysis of previous research we proposed an information system using agent technology and provided an architecture description of information system for the prediction of hybrid power generation and energy sales. It was built according to the analysis of information flows that occurs during the processing data for making appropriate decision and based on set of developing information flow.
The whole system was presented in the form of parts according to the three-tier architecture. We also identified agents corresponding to each process going on in the system. We believe that proposed architecture and information system for the management of renewable energy sources and further implementation will allow to efficiently carry out the management of grid productions, sales and support.
REFERENCES
[1] Ackermann, T., Andersson, G., & Söder, L. (2001). Distributed generation: a definition. Electric power systems research, 57(3), 195-204. doi:10.1016/S0378-7796(01)00101-8
[2] Ai, B., Yang, H., Shen, H., & Liao, X. (2003). Computer-aided design of PV/wind hybrid system. Renewable energy, 28(10), 1491-1512. doi:10.1016/S0960-1481(03)00011-9
[3] Abran, A., Bourque, P., Dupuis, R., & Moore, J. W. (2001). Guide to the software engineering body of knowledge-SWEBOK. IEEE Press. [4] Barbato, A., Capone, A., Carello, G., Delfanti, M., Falabretti, D., &
Merlo, M. (2014). A framework for home energy management and its experimental validation. Energy Efficiency, 7(6), 1013-1052. doi: 10.1007/s12053-014-9269-3
[5] Bass, L., Clements, P., & Kazman, R. (2013). Software architecture in practice. Upper Saddle River, NJ: Addison-Wesley.
[6] Celik, A. N. (2002). Optimisation and techno-economic analysis of autonomous photovoltaic–wind hybrid energy systems in comparison to single photovoltaic and wind systems. Energy Conversion and Management, 43(18), 2453-2468. doi:10.1016/S0196-8904(01)00198-4
[7] Deshmukh, M. K., & Deshmukh, S. S. (2008). Modeling of hybrid renewable energy systems. Renewable and Sustainable Energy Reviews, 12(1), 235-249. doi:10.1016/j.rser.2006.07.011
[8] Elhadidy, M. A. (2002). Performance evaluation of hybrid (wind/solar/diesel) power systems. Renewable Energy, 26(3), 401-413. doi:10.1016/S0960-1481(01)00139-2
[9] Gomaa, S., Seoud, A. A., & Kheiralla, H. N. (1995). Design and analysis of photovoltaic and wind energy hybrid systems in Alexandria, Egypt. Renewable energy, 6(5), 643-647. doi:10.1016/0960-1481(95)00044-K
[10] Hunt, J. D., Bañares-Alcántara, R., & Hanbury, D. (2013). A new integrated tool for complex decision making: Application to the UK energy sector. Decision Support Systems, 54(3), 1427-1441. doi:10.1016/j.dss.2012.12.010
[11] ISO/IEC/IEEE Std 42010:2011 – Systems and software engineering – Architecture description. Los Alamitos,CA: IEEE, 2011.
[12] Jacobson, I., Rumbaugh, J., & Booch, G. (1999). The unified modeling language user guide. Addison Wesley.
[13] Multin, M., Allerding, F., & Schmeck, H. (2012, January). Integration of electric vehicles in smart homes-an ict-based solution for v2g scenarios. In Innovative Smart Grid Technologies (ISGT), 2012 IEEE PES (pp. 1-8). IEEE. doi: 10.1109/ISGT.2012.6175624
[14] Nehrir, M. H., LaMeres, B. J., Venkataramanan, G., Gerez, V., & Alvarado, L. A. (2000). An approach to evaluate the general performance of stand-alone wind/photovoltaic generating systems. Energy Conversion, IEEE Transactions on, 15(4), 433-439. doi: 10.1109/60.900505
[15] Solovjova, E. G., & Kondratenkov, A. N. (2013). Sistema avtonomnogo energo-snabzhenija zdanija v uslovijah ІІ klimaticheskoj zony.
[16] Shendryk, V. V., Vashhenko, S. M., Shulyma, O. V., & Omelyanenko, K. A. (2013). Aktualnost modelirovanija raspredelennyh energosistem effektivnogo ispolzovanija vozobnovljaemyh istochnikov jenergii. Vostochno-Evropejskij zhurnal peredovyh tehnologij, 5(8), 4-8.
[17] Shulyma, O., Shendryk, V., Baranova, I., & Marchenko, A. (2014). The Features of the Smart MicroGrid as the Object of Information Modeling. Information and Software Technologies, 12. doi: 10.1007/978-3-319-11958-8_2
[18] The FIPA Abstract Architecture Specification. Retrieved March 16, 2015, from http://www.fipa.org/specs/fipa00001/index.html