Contents lists available atScienceDirect
Physics and Imaging in Radiation Oncology
journal homepage:www.elsevier.com/locate/phroOriginal Research Article
Sensitivity analysis of different quality assurance methods for magnetic
resonance imaging in radiotherapy
Mary Adjeiwaah
⁎, Anders Garpebring, Tufve Nyholm
Department of Radiation Sciences, Umeå University, Umeå, Sweden
A R T I C L E I N F O Keywords: MRI in RT Quality assurance ACR Image quality Sensitivity analysis
Large geometric accuracy phantom
A B S T R A C T
Background and purpose: There are currently no standard quality assurance (QA) methods for magnetic re-sonance imaging (MRI) in radiotherapy (RT). This work was aimed at evaluating the ability of two QA protocols to detect common events that affect quality of MR images under RT settings.
Materials and methods: The American College of Radiology (ACR) MRI QA phantom was repeatedly scanned using a flexible coil and action limits for key image quality parameters were derived. Using an exploratory survey, issues that reduce MR image quality were identified. The most commonly occurring events were in-troduced as provocations to produce MR images with degraded quality. From these images, detection sensi-tivities of the ACR MRI QA protocol and a commercial geometric accuracy phantom were determined. Results: Machine-specific action limits for key image quality parameters set atmean±3 were comparable with the ACR acceptable values. For the geometric accuracy phantom, provocations from uncorrected gradient nonlinearity effects and a piece of metal in the bore of the scanner resulted in worst distortions of 22.2 mm and 3.4 mm, respectively. The ACR phantom was sensitive to uncorrected signal variations, electric interference and a piece of metal in the bore of the scanner but could not adequately detect individual coil element failures. Conclusions: The ACR MRI QA phantom combined with the large field-of-view commercial geometric accuracy phantom were generally sensitive in identifying some common MR image quality issues. The two protocols when combined may provide a tool to monitor the performance of MRI systems in the radiotherapy environment.
1. Introduction
Many cancer treatment centres are incorporating magnetic re-sonance (MR) imaging (MRI) in routine radiotherapy (RT). MRI with its superior soft tissue contrast has led to improved target volume deli-neations in head and neck[1–4], prostate[1,5,6]and cervical cancers [7].
Images for RT purposes are required to have high contrast and high geometric accuracy. However, MRI system design constraints and other external influences affect the quality of MR images. Therefore, routine quality assurance (QA) procedures which are mostly concerned with image quality are needed to monitor the performance of MRI systems [8]. The quality of MR images is influenced by factors such as signal-to-noise ratio (SNR), spatial resolution, artifacts (motion, magnetic sus-ceptibility, water-fat shift, etc.) and image contrast.
RT-specific demands like patient positioning (flat tabletop-inserts) and immobilization devices needed to replicate patient treatment po-sition also affect MR image quality. For example, by using a flat ta-bletop-insert and coil holder, Brynolfsson et al.[9]reported that SNR reduced to 66% whilst Xing et al.[10], had an average SNR decrease of
42%. Batumalai et al.[11], showed that for supine RT-specific imaging of the breast, a switch from the standard diagnostic 16-channel prone coil to an 18-channel surface coil decreased SNR by 41% and 45% for supine flat and supine inclined (10°) respectively. The reduction in SNR can be attributed to the increased separation between the coils and the patient as a result of the flat tabletop-insert and coil holder.
Though not specific to MRI in RT, the presence of metallic objects either on patients or in the scanner’s bore produce susceptibility arti-facts characterized by signal loss and geometric distortions[12]. These may affect the visibility of anatomic regions making segmentation and delineations on MR images a challenge[13]. As noted by Paulson[14], the added demands placed on MRI when used in the radiotherapy setting in comparison to diagnostic radiology could hinder the many advantages it provides if not properly checked.
There are currently no standardized QA protocols for MR in RT. Nevertheless, there have been attempts to provide practical approaches to routine QA of MRI machines dedicated to radiotherapy treatment planning,[10,15–18]. Paulson[14]for example provides RT specific activities for daily, weekly, monthly and yearly QA routines. Interna-tional bodies such as the American College of Radiology (ACR)[19]and
https://doi.org/10.1016/j.phro.2020.03.001
Received 22 August 2019; Received in revised form 27 February 2020; Accepted 2 March 2020 ⁎Corresponding author.
2405-6316/ © 2020 The Author(s). Published by Elsevier B.V. on behalf of European Society of Radiotherapy & Oncology. This is an open access article under the CC BY-NC-ND license (http://creativecommons.org/licenses/BY-NC-ND/4.0/).
American Association of Physicists in Medicine (AAPM) [20] have given reference guidance on acceptance testing, commissioning and regular QA routines for clinical MRI scanners. The MRI QA test gui-dance from the ACR with its associated custom-designed phantom has become an important reference for routine MRI QA after acceptance into the ACR accreditation program[21–26]. The ACR protocol eval-uates geometric accuracy, high-contrast spatial resolution, low-contrast object detectability, ghosting, image intensity uniformity, slice thick-ness and slice position accuracy[19].
For many RT image acquisitions, a larger field-of-view (FoV) is needed to accurately cover the tumour volume, organs at risk (OAR), and the external body contours within the imaged region of interest [27]. With gradient linearity and field homogeneity worsening with increasing radial distance from the scanner’s isocenter, the inclusion of a large FoV geometric accuracy phantom in QA procedures for MRI in RT has been highly recommended.
The ACR MRI QA phantom in combination with vendor supplied or commercial large FoV geometric accuracy phantoms have become common QA tools for most centres utilizing MRI in radiotherapy. However, the robustness with which these procedures can pick up po-tential image quality issues in the radiotherapy environment has not been fully explored. The purpose of this study was to evaluate the ability of the ACR MRI QA phantom and a commercial large FoV geo-metric accuracy phantom to identify common issues that degrade the quality of MR images. To do this, objective machine-specific action limits for key image quality parameters were determined. The sensi-tivity of the QA protocols to objectively detect the introduced image quality degradations were then investigated.
2. Materials and methods
In this study, QA protocols based on the ACR MRI QA phantom (JM Specialty Parts INC, San Diego, CA, USA) and a commercial large FoV geometric accuracy phantom (Spectronic Medical AB, Helsingborg, Sweden) were used. All image acquisitions were done on a 3 T GE Signa PET/MR scanner (GE Healthcare, Milwaukee, WI USA).
2.1. The ACR MRI QA protocol
The ACR QA protocol consist of seven quantitative tests measured on the phantom images. The evaluation of the individual quantities is illustrated inSupplementary Fig. S1. These tests are generally for ac-ceptance into the ACR accreditation program but has become the most used tool for routine QA for many clinical MRI systems. An automatic image analysis software to evaluate the QA data from the ACR phantom has been implemented at the Umeå University hospital, Sweden[28]. Included in the software package are a database for receiving and storing DICOM images, an image quality evaluation script written in MATLAB (The MathWorks Inc., Natick MA, USA), and a web-based results documentation portal. Analysis of all the ACR quantitative tests except low-contrast object detectability have been automated.
For this study, the RT-specific image acquisition settings that were used whilst scanning the ACR phantom of height 190 mm were:
•
a 40 mm thick flat tabletop-insert•
upper anterior array (UAA) flexible coils on a coil holder of height 235 mm•
coil intensity correction with surface coil intensity correction (SCIC) The combined number of receive channels from the UAA and the posterior built-in table coil for the specified FoV was 18. The maximum separation between the coil holder and the ACR phantom was 45 mm. The maximum SNR was calculated using MICE Toolkit[29]according to the AAPM guidelines[20]. The SNR was estimated from the same slice (Slice No. 7) used for ghosting and uniformity measurements (Supplementary Fig. S1(e)).2.2. The large FoV geometric accuracy QA protocol
The commercial geometric accuracy phantom contained 1177 spherical markers. The markers, filled with polyethylene glycol, were 17 mm in diameter. The outer casing was502×404 534x mm3with a signal producing volume of 438.7×346.0×470.0mm3 [30]. The re-commended and on-site acquisition sequence parameters are described inTable 1. The cloud-based evaluation software provided by the vendor estimated the overall distortion as the difference in marker positions in a reference phantom model and in the MR images. The final report contained the estimated worst and mean distortions at different radial distances from the scanner’s isocenter.
The image acquisition parameters for the individual phantoms are given inTable 1.
2.3. Determining machine-specific action limits
The ACR phantom was repeatedly scanned in two scanning sessions with six scans per session. The action limits were determined as a multiple of the sample standard deviations (σ) from the mean. A one-sample Kolmogorov-Smirnov test was used to assess that the data were normally distributed. The variables derived from the images for which action limits were determined included image uniformity, slice thick-ness, slice position accuracy, ghosting, geometric accuracy and SNR. The action limits were applied on a 4-year retrospective quality control data to study the stability in the system performance of the 3 T MRI scanner.
2.4. MRI in RT QA sensitivity under provoked conditions
Provocations were intentionally introduced to degrade the images of the phantoms. The provocations were obtained through an ex-ploratory survey among users of MR simulators. In the survey, re-spondents were specifically asked to state the cause, mode of detection and frequency of common image quality issues they may have en-countered within the last six months. The introduced provocations based on the results of the survey are shown inTable 2.
To effectively isolate the influence of individual provocations, each provocation was intentionally introduced separately whilst acquiring images of each phantom. It was important that degradations were visible to a manual observer in order to ensure that the QA protocols could either pick or not pick up these provocations.
Each phantom was scanned with and without the designated error provocation sequentially with six repeated measurements. The images were evaluated using each phantom’s automatic analysis software.
Here, geometrically distorted images were obtained from un-corrected gradient nonlinearity effects and magnetic field in-homogeneity effects due to a 4 mm paper clip placed in the bore of the scanner. The paper clip was secured in a tennis ball-like plastic
Table 1
Sequence protocol for the phantom image acquisitions.
Parameter ACR Phantom Geometric Accuracy phantom Sequence 2D-SE (T1) 2D-SE (T2) 3D-FSE 3D-GRE
Coil UAA UAA Built-in Built-in
Scan plane Axial Axial Axial Axial
Repetition time (ms) 500 2000 15000 4.6 Echo time 20 20/80 98.8 1.8 Slice thickness (mm) 5 5 1.5 1.5 Slice gap (mm) 5 5 0 0 Flip angle (°) 90 90 130 10 Bandwidth (HzPixel−1) 244 244 488 488
3D correction off off On On
Field of view (mm2) 250 × 250 250 × 250 500 × 500 500 × 500
container. Simulating coil-related effects first involved acquiring images without intensity variation corrections. Secondly, by using GE’s Orchestra-sdk-18-1 MATLAB software to reconstruct raw image data-sets, combinations of coil elements were removed during the re-construction. The aim was to find the minimum number of A faulty coil element that could be objectively detected. Lastly, images were de-graded by electrical interference. Here a signal generator was used to produce a signal at 127.7 MHz and a high bandwidth of 200 kHz to mimic the interference of electric sparks. The generator was connected to a half-wavelength dipole antenna placed in the scanner room. Electric interference was introduced for a maximum duration of 5 s with an amplitude that gave artifacts ranging from barely visible to severe, seeFig. 2(j-l).
Detection sensitivity for each provocation was calculated as the number of objective identifications relative to the total number of image acquisitions per provocation.
3. Results
3.1. 3.1 Machine-specific action limits
The machine-specific limits based on the repeated measurements under RT settings for key image quality parameters were set as the
mean ± 3σ. By setting the limits at ± 3σ, less than one percent of all
measured data points were expected to be beyond the ± 3σ line. The measured machine-specific limits in comparison with the corresponding ACR acceptance values are shown inTable 3.
The system performance of the 3 T MRI scanner based on the 4-year retrospective quality control data is shown inSupplementary Fig. S2.
3.2. MRI in RT QA sensitivity under provoked scenarios
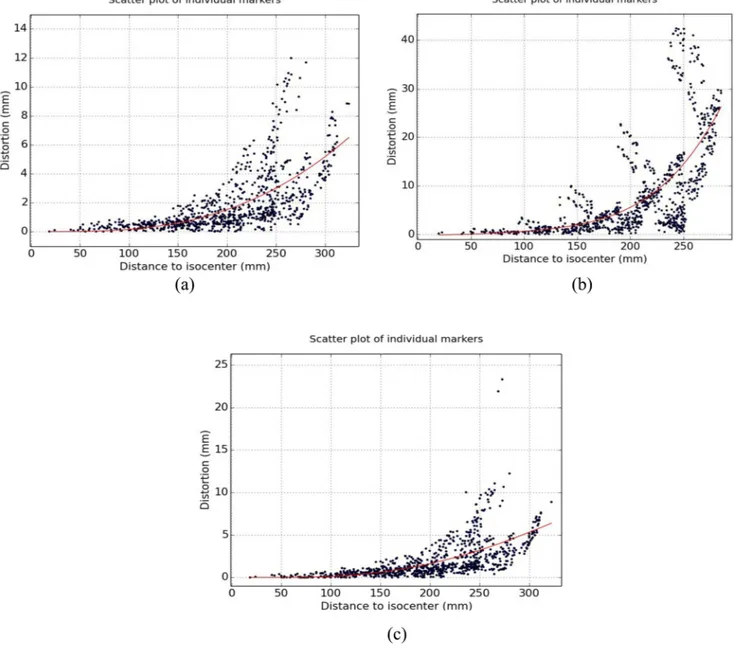
The magnitude of distortions at different radial distances from the scanners isocenter measured using the commercial geometric accuracy phantom with and without gradient nonlinearity correction are shown inFig. 1(a) and (b), respectively. The corresponding geometric accu-racy measurements with a piece of metal in the bore of the scanner is shown in Fig. 1 (c). It can be inferred that the geometric accuracy phantom was much more sensitive to uncorrected gradient nonlinearity effects than field inhomogeneities resulting from the piece of metal.
At radial distances within 200 mm of the scanner’s isocenter, the worst (mean) measured distortions were 22.2 (3.9) mm, 3.3 (0.9) mm, 3.4 (1.0) mm for uncorrected gradient nonlinearity effects, 3D cor-rected images without and with piece of metal in the bore of the magnet, respectively.
Sample image slices from the ACR phantom with and without image degradations that were objectively detected are illustrated inFig. 2. Here, the piece of metal affected the geometric accuracy of the phantom images translating to deviations of 7.5 mm, 2.5 mm and 6.3 mm from the phantom’s actual length of 190 mm as indicated inFig. 2(g–i), respectively.
The sensitivity of the ACR phantom to identify the introduced provocations is shown in Table 4. Each provocation resulted in the failure of at least one image quality parameter. Coil intensity correction had to be turned off before the failure of at least 4 coil-channels (i.e. 22.2% of the total number of receive coil channels) could be detected.
4. Discussion
MR images of high quality are needed in order to improve the ac-curacy in the target volume and OAR delineations. Therefore, events that affect the quality of MR images if not detected could negatively
Table 2
The most frequent cause of image quality degradation based on the survey. These were the input errors introduced to intentionally degrade MR images of the large geometric accuracy and ACR phantoms.
Simulated provocations Expected image quality parameter to be affected Mode of detection
B0 field inhomogeneity Slice position and Geometric accuracy Distortion measurements and ACR Slice position test 40 mm metallic paper clip in magnet’s bore∗
Coil-related image uniformity and SNR ACR PIU and SNR measurements No image intensity correction◦
Coil failure
Gradient nonlinearity• Geometric accuracy Distortion measurements
No 2D/3D gradient nonlinearity correction
External electrical interference SNR image uniformity SNR Spike artifacts and ACR PIU test Static electric discharges/sparks◦
PIU – Percent image uniformity; SNR – signal-to-noise ratio. ∗ Both phantoms.
◦ ACR phantom only.
• Large FoV geometric accuracy phantom only.
Table 3
Results of the repeated measurements under RT settings using the ACR MRI QA phantom. Shown are the range and machine-specific action limits for a 3 T PET/MR scanner when using surface coils. The limits were set at ± 3 standard deviations (σ) from the mean. The corresponding acceptance values prescribed according to the ACR MRI QA protocol are also shown.
Image quality Index Range Machine-specific Limits (Mean ± 3σ) ACR Acceptance Values
Geometric Accuracy (mm) [189–191] 190 ± 2 190 ± 2
Slice Thickness Accuracy (mm) [5.1–6.0] 5.6 ± 0.7 5.0 ± 0.7
Slice Position Accuracy (mm) [2.0–4.9] 3.3 ± 2.7 ± 5.0
Image Intensity Uniformity (%) [95.6–99.6] ≥94.6 ≥82.0
Percent Signal Ghosting (%) [0.3–0.6] < 0.2 < 2.5
Signal-to-noise ratio
T1 [698–649.1] > 622 –
T2 [693–627.6] > 616 –
affect RT treatment outcomes. This work examined the ability of two QA protocols to detect common issues that affect the quality of MRI images under RT settings. Both the commercial geometric accuracy phantom and the ACR phantom could identify some of the introduced provocations. By initially finding the machine-specific action limits for key image quality parameters based on the repeated phantom mea-surements, it was possible isolate the effect of the introduced provo-cation. The action limits set at mean ± 3σ meant that false error rates were expected to be around 0.27% and that any measurements outside these limits could be attributed to special causes that warrant further investigations. The machine-specific action limits applied on a 4-year retrospective data collected with the ACR phantom under diagnostic settings on the PET/MR scanner, indicated that the system performance within this period was relatively stable with a few outliers for which no assignable causes were found. The data points with the superimposed limits are presented inSupplementary Fig. S2.
MR images are inherently distorted, and the magnitude of these distortions increase with increasing radial distance in all directions from the scanner’s isocenter[31]. There fore, the ACR phantom with its
limited diameter of 190 mm may not be the appropriate tools to characterize distortions. The typical diameter of MRI scanners is around 600 mm. Additionally, the choice of measuring the geometric accuracy on two slices within a defined volume of 105 mm had obvious limita-tions. Sewonu et al.[26]proposed the measurement of the phantom diameter on all eleven slices so that the influence of the phantom po-sition on MR distortions could be objectively assessed. The re-commendation for MRI in RT applications is that, standard QA proce-dures should include a large FoV geometric accuracy phantom in order to adequately quantify distortions.
Fig. 1indicated that the large geometric accuracy phantom was more sensitive to gradient nonlinearity effects (mean distortion of 3.9 mm) than field inhomogeneities induced by the piece of metal (mean distortion of 1 mm). As a QA measure, it is recommended to sweep or inspect the scanner’s bore daily for pieces of loose metals as these may not necessarily show up on distortion measurements.
The ACR MRI QA protocol is designed for commissioning and ac-ceptance into the ACR accreditation program. Therefore, the re-commended acceptance values only indicate the minimum level of
Fig. 1. Effect of the provocations on geometric distortion measurements using the commercial geometric accuracy phantom: Scatter plot of the individual marker
positions with (a) and without gradient nonlinearity correction (b). A piece of metal in the bore of the scanner produced the effects in (c) after correcting for gradient nonlinearity effects.
performance expected of a well functioning MRI scanner[19]. There-fore, these acceptance criteria values are most relevant during the ac-ceptance testing and commissioning of MRI systems.
In order to use the test phantom for routine QA procedures, it is important to first determine machine-specific limits that will account for the normal variations in the MRI system’s performance. This could
be done using the methodology applied in this work. The machine-specific action limits for geometric accuracy was within the ACR limit and the acceptable level of 2 mm or less prescribed for MR simulators used in external beam RT[32]as shown inTable 3. However, image intensity uniformity and ghosting ratio had stricter limits than those prescribed by the ACR protocol. Based on the results of this study, it is
Fig. 2. Sample phantom images with and without provocations. Phantom images with flexible coils corrected (a–c) and uncorrected (d–f) for coil intensity variations.
Geometric distorted images due to a piece metal in the bore of scanner (g–i) with the measured phantom lengths. This is in comparison to the original phantom length of 190 mm. Images with spike artifacts from electric interference are in (j–l).
recommended that machine-specific limits for each system be found and used rather than ACR acceptance values should be used as a benchmark for constancy checks or routine MRI in RT QA procedures. The choice of using the predetermined action limits of mean ± 3σ may be a limitation of this study. Ideally, action limits should be based on knowledge of error propagation to clinically relevant parameters such as dose coverage. Such analysis is complex and was not included in the present work but is highly relevant when building well balanced quality assurance protocols. Hence, the action limit of mean ± 3σ in the present work was used to keep false error rates below 1% considering the lack of specific tolerance limits for MRI in RT.
Scanning the ACR phantom under RT settings using flexible coils, coil holder, and flat tabletop may compromise SNR. SNR though not included in the ACR protocol, could be calculated from the same slice used for the PIU and ghosting ratio evaluations. The increased separa-tion between the coil and the phantom led to a 32.4% drop in SNR. This was within the SNR reductions of 44%[23], 42%[10], 33%[9]and 14%[33]reported in literature for similar MRI in RT image acquisi-tions.
There are inhomogeneities in the sensitivity profile of the coils. Most vendors provide intensity correction algorithms that prospectively or retrospectively correct the reduced signal intensity uniformity [10,18]. As indicated in the data fromTable 3, a very high image in-tensity uniformity was obtained with the ACR phantom whilst using the SCIC algorithm.
From a QA perspective, faulty coil elements may not be detected during regular QA acquisitions, if intensity corrections are used. The AAPM Report 100 [20]and based on the observations in this study, testing for image degradations associated with the failure of coil ele-ment components should be done without intensity correction.
Single or multiple bursts of noise from electric sparks resulted in the different patterns of spike artefacts shown in Fig. 2(j, k and l). The appearance depends on the phase encoding lines affected by the burst of noise. Regulating the humidity in the scanner room to normal limits can reduce the risk of electric sparks. Arcing in coil cables that are not se-curely positioned in their sockets may also result in spike noise. Routine and thorough inspection of coils and all coil accessories are therefore recommended.
The automatic analysis of QA data may increase the frequency with which routine QA procedures are done. Consequently, the risk of using images with poor quality for patient treatments may be reduced. At the same time, if the automatic evaluation process is not very robust, it may result in sensitivity issues and incorrect assessments. For this study, the automatic evaluation of the ACR phantom data involved some win-dowing, blurring and edge detection. These processes are susceptible to partial volume effects and are likely to provide inconsistent outcomes if not properly checked. For example, whilst acquiring images with no intensity corrections, we found that the ACR analysis for geometric accuracy failed as indicated in Table 4. This was attributed to the failure of the automatic analysis software to detect regions with low signals. An indication that the results of an automatic analysis of QA data may not always reflect the primary cause of failure. Therefore, additional layer of control checks such as visual inspection may still be relevant.
The use of the manufacturer-supplied MATLAB code to reconstruct the phantom raw data whilst simulating coil element failure may be a
limitation of this study. At the time of this study, it was not possible to remove individual coil elements and reconstruct a composite image on the scanner’s console. However, we used the vendor’s own image re-construction software during this process and the results of this study should not be far from real scenarios.
In conclusion, MRI is transforming the radiotherapy treatment planning process however, what constitutes a rigorous and standar-dized approach to quality assurance has still not clearly been defined. Nonetheless, the studied protocols were generally sensitive to some of the most common events that affect the quality of MR images. As a recommendation, the ACR MRI QA phantom combined with a large FoV geometric accuracy phantom could be used to monitor the image quality performance of MRI scanners used for RT purposes. However, there is still the need to develop dedicated protocols and phantoms to monitor the performance of RT-specific MRI systems.
Declaration of Competing Interest
The authors declare that they have no known competing financial interests or personal relationships that could have appeared to influ-ence the work reported in this paper.
Acknowledgement
Sincere gratitude to the Schlumberger Faculty for the Future foun-dation and the Cancer Research Founfoun-dation in Northern Sweden, Sweden for funding the PhD studies of Mary Adjeiwaah. We also thank Christian J. Gustafsson (Skåne, Sweden), Richard Speight (Leeds, UK), Uulke van der Heide (Utrecht, Netherlands), Richard Mintah (Accra, Ghana), Hazel McCallum (Newcastle, UK), Michael Dubec (Manchester, UK), Tiina Seppälä (Helsinki, Finland), Alexander Fyrdahl (Stockholm, Sweden), Johanna Mårtensson (Uppsala, Sweden) and all the other participants who did not want to be publicly acknowledged for re-sponding to our survey. A special thank you to Mikael Bylund (Umeå, Sweden) for proofreading the final manuscript.
Appendix A. Supplementary data
Supplementary data to this article can be found online athttps:// doi.org/10.1016/j.phro.2020.03.001.
References
[1] Krempien RC, Schubert K, Zierhut D, Steckner MC, Treiber M, Harms W, et al. Open low-field magnetic resonance imaging in radiation therapy treatment planning. Int J Radiat Oncol Biol Phys 2002:1350–60.https://doi.org/10.1016/S0360-3016(02) 02886-9.
[2] Khoo VS, Padhani AR, Tanner SF, Finnigan DJ, Leach MO, Dearnaley DP. Comparison of MRI with CT for the radiotherapy planning of prostate cancer: A feasibility study. Br J Radiol 1999;72:590–7.https://doi.org/10.1259/bjr.72.858. 10560342.
[3] Aoyama H, Shirato H, Nishioka T, Hashimoto S, Tsuchiya K, Kagei K, et al. Magnetic resonance imaging system for three-dimensional conformal radiotherapy and its impact on gross tumor volume delineation of central nervous system tumors. Int J Radiat Oncol Biol Phys 2001;50:821–7.https://doi.org/10.1016/S0360-3016(01) 01598-X.
[4] Kristensen BH, Laursen FJ, Løgager V, Geertsen PF, Krarup-Hansen A. Dosimetric and geometric evaluation of an open low-field magnetic resonance simulator for radiotherapy treatment planning of brain tumours. Radiother Oncol 2008;87:100–9.
Table 4
The sensitivity of the ACR MRI QA protocol to objectively detect individual provocations.
Geometric Slice Slice Ghosting (%) Uniformity (%) SNR (%)
PROVOCATIONS Accuracy (%) Position (%) Thickness (%)
Metal in scanner 100 83.3 0 0 0 0
Uncorrected coil intensity variation 100 33.3 66.7 100 100 100
Coil failure (after 4-faulty elements) 0 0 0 0 66.7 66.7
https://doi.org/10.1016/j.radonc.2008.01.014.
[5] Steenbakkers RJHM, Deurloo KEI, Nowak PJCM, Lebesque JV, van Herk M, Rasch CRN. Reduction of dose delivered to the rectum and bulb of the penis using MRI delineation for radiotherapy of the prostate. Int J Radiat Oncol Biol Phys 2003;57:1269–79.https://doi.org/10.1016/S0360-3016(03)01446-9.
[6] Debois M, Oyen R, Maes F, Verswijvel G, Gatti G, Bosmans H, et al. The contribution of magnetic resonance imaging to the three-dimensional treatment planning of lo-calized prostate cancer. Int J Radiat Oncol 1999;45:857–65.https://doi.org/10. 1016/S0360-3016(99)00288-6.
[7] Dimopoulos JCA, Schard G, Berger D, Lang S, Goldner G, Helbich T, et al. Systematic evaluation of MRI findings in different stages of treatment of cervical cancer: Potential of MRI on delineation of target, pathoanatomic structures, and organs at risk. Int J Radiat Oncol Biol Phys 2006;64:1380–8.https://doi.org/10. 1016/j.ijrobp.2005.10.017.
[8] McRobbie WD, Moore AE, Graves JM. MRI: from picture to proton. Cambridge University Press; 2017.
[9] Brynolfsson P, Axelsson J, Holmberg A, Jonsson JH, Goldhaber D, Jian Y, et al. Technical Note: Adapting a GE SIGNA PET/MR scanner for radiotherapy. Med Phys 2018;45:3546–50.https://doi.org/10.1002/mp.13032.
[10] Xing A, Holloway L, Arumugam S. Commissioning and quality control of a dedi-cated wide bore 3T MRI simulator for radiotherapy planning. Int J Cancer Ther Oncol 2016;4:421.https://doi.org/10.14319/ijcto.42.1.
[11] Batumalai V, Liney G, DeLaney GP, Rai R, Boxer M, Min M, et al. Assessment of MRI image quality for various setup positions used in breast radiotherapy planning. Radiother Oncol 2016;119:57–60.https://doi.org/10.1016/j.radonc.2016.02.024. [12] Adjeiwaah M, Bylund M, Lundman JA, Söderström K, Zackrisson B, Jonsson JH,
et al. Dosimetric impact of MRI distortions: a study on head and neck cancers. Int J Radiat Oncol Biol Phys 2019;103:994–1003.https://doi.org/10.1016/j.ijrobp. 2018.11.037.
[13] Garg R, Powell AJ, Sena L, Marshall AC, Geva T. Effects of metallic implants on magnetic resonance imaging evaluation of Fontan palliation. Am J Cardiol 2005;95:688–91.https://doi.org/10.1016/j.amjcard.2004.10.053.
[14] Paulson E. Comprehensive RT-specific QA for MRI simulation. MReadings MR RT 2015:62–4.
[15] Paulson ES, Erickson B, Schultz C, Li XA, Erickson B, Schultz C, et al. Comprehensive MRI simulation methodology using a dedicated MRI scanner in radiation oncology for external beam radiation treatment planning. Med Phys 2015;28.https://doi.org/10.1118/1.4896096.
[16] Kapanen M, Collan J, Beule A, Seppälä T, Saarilahti K, Tenhunen M. Commissioning of MRI-only based treatment planning procedure for external beam radiotherapy of prostate. Magn Reson Med 2013;70:127–35.https://doi.org/10.1002/mrm.24459. [17] Firbank MJ, Harrison RM, Williams ED, Coulthard A. Quality assurance for MRI:
Practical experience. Br J Radiol 2000;73:376–83.https://doi.org/10.1259/bjr.73. 868.10844863.
[18] Liney GP, Moerland MA. Magnetic resonance imaging acquisition techniques for radiotherapy planning. Semin Radiat Oncol 2014;24:160–8.https://doi.org/10. 1016/j.semradonc.2014.02.014.
[19] American College of Radiology. Phantom Test Guidance for Use of the Large MRI Phantom; 2017.
[20] Jackson EF, Bronskill MJ, Drost DJ, Och J, Sobol WT, Clarke GD. AAPM Report No.
100 acceptance testing and quality assurance procedures for magnetic resonance imaging facilities report of MR subcommittee task group I. College Park: American Association of Physicists in Medicine; 2010.
[21] Chen C-C, Wan Y-L, Wai Y-Y, Liu H-L. Quality assurance of clinical MRI scanners using ACR MRI phantom: preliminary results. J Digit Imaging 2004;17:279–84.
https://doi.org/10.1007/s10278-004-1023-5.
[22] Ihalainen TM, Lönnroth NT, Peltonen JI, Uusi-Simola JK, Timonen MH, Kuusela LJ, et al. MRI quality assurance using the ACR phantom in a multi-unit imaging center. Acta Oncol 2011;50:966–72.https://doi.org/10.3109/0284186X.2011.582515. [23] Wong OL, Yuan J, Yu SK, Cheung KY. Image quality assessment of a 1.5T dedicated
magnetic resonance-simulator for radiotherapy with a flexible radio frequency coil setting using the standard American College of Radiology magnetic resonance imaging phantom test. Quant Imaging Med Surg 2017;7:205–14.
[24] Panych LP, Chiou JYG, Qin L, Kimbrell VL, Bussolari L, Mulkern RV. On replacing the manual measurement of ACR phantom images performed by MRI technologists with an automated measurement approach. J Magn Reson Imaging
2016;43:843–52.https://doi.org/10.1002/jmri.25052.
[25] Davids M, Zöllner FG, Ruttorf M, Nees F, Flor H, Schumann G, et al. Fully-auto-mated quality assurance in multi-center studies using MRI phantom measurements. Magn Reson Imaging 2014;32:771–80.https://doi.org/10.1016/j.mri.2014.01.017. [26] Sewonu A, Hossu G, Felblinger J, Anxionnat R, Pasquier C. An automatic MRI
quality control procedure: Multisite reports for slice thickness and geometric ac-curacy. IRBM 2013;34:300–5.https://doi.org/10.1016/j.irbm.2013.07.008. [27] Torfeh T, Hammoud R, Perkins G, McGarry M, Aouadi S, Celik A, et al.
Characterization of 3D geometric distortion of magnetic resonance imaging scan-ners commissioned for radiation therapy planning. Magn Reson Imaging 2016;34:645–53.https://doi.org/10.1016/j.mri.2016.01.001.
[28] Sandgren K. Development of a quality assurance strategy for magnetic resonance imaging in radiotherapy. Umeå University; 2015.
[29] Nyholm T, Berglund M, Brynolfsson P, Jonsson J. EP-1533: ICE-Studio – An Interactive visual research tool for image analysis. Radiother Oncol 2015;115:S837.
https://doi.org/10.1016/s0167-8140(15)41525-7.
[30] Wyatt J, Hedley S, Johnstone E, Speight R, Kelly C, Henry A, et al. Evaluating the repeatability and set-up sensitivity of a large field of view distortion phantom and software for magnetic resonance-only radiotherapy. Phys Imaging Radiat Oncol 2018;6:31–8.https://doi.org/10.1016/j.phro.2018.04.005.
[31] Adjeiwaah M, Bylund M, Lundman JA, Karlsson CT, Jonsson JH, Nyholm T. Quantifying the effect of 3T magnetic resonance imaging residual system distortions and patient-induced susceptibility distortions on radiation therapy treatment planning for prostate cancer. Int J Radiat Oncol Biol Phys 2018;100..https://doi. org/10.1016/j.ijrobp.2017.10.021.
[32] Paulson ES, Crijns SPM, Keller BM, Wang J, Schmidt MA, Coutts G, et al. Consensus opinion on MRI simulation for external beam radiation treatment planning. Radiother Oncol 2016;121:187–92.https://doi.org/10.1016/j.radonc.2016.09. 018.
[33] McJury M, O’Neill A, Lawson M, McGrath C, Grey A, Page W, et al. Assessing the image quality of pelvic MR images acquired with a flat couch for radiotherapy treatment planning. Br J Radiol 2011;84:750–5.https://doi.org/10.1259/bjr/ 27295679.