tri
1.
CANAL SEEPAGE by
A. R. Robinson, J.M. ASCE; and Carl Rohwer, M. ASCE. Agricultural Research Service, USDA
Colorado Agricultural Experiment Station (Paper to be presented at San Diego Convention, ASCE, February 10, 1955)
Introduction
Of the water diverted for irrigation in the 17 Western States, it is estimated that 35,000,000 acre feet or about 40 percent is lost before it reaches the farms. On 46 operating procts con-structed by the U.S. Bureau of Reclamation it was determined that approximately 25 percent of the water was lost in transit. This loss consists of seepage, evaporation, transpiration and leakage. The water lost by seepage is by far the greatest of the losses. This seepage water is not only lost to the canal to which it is appropriated, but may also cause considerable damage to lands as a result of high water table conditions and excess salts in the soil. Although the water is lost to the canal, it is not totally lost as a considerable amount may go to replenish ground water supplies or to increase the return flow to streams.
Methods of measuring seepage are necessary in order to deter-mine the magnitude of the losses and also to isolate reaches of canals where high losses are occurring. Water is becoming in-creasingly valuable and it is necessary to determine from an
economic standpoint whether the value of the water saved, the land reclaimed, and the savings in cost of operation and maintenance
-2-will exceed the cost of lining. It is also desirable to determine if a new canal should be lined before construction is started.
Many factors have a definite effect on the seepage rate, but the permeability of the material forming the bed of the canal is the most 1
important one. Other factors which influence the seepage rate are: (1) the depth of water in the canal; (2) the length of time the canal has been in operation; (3) the depth to ground water; (4) the tempera-ture of the water and the soil; (5) the percentage of entrained air in the soil; (6) the soil moisture tension; (7) the salt content of the soil
or water and; (8) the silt carried by the canal. Biological factors and the barometric pressure may affect the seepage rate to greater or less degree depending on conditions. Since all these factors may act simultaneously and in some cases counteract each other, it is diffi-cult to segregate the effect of any one of them.
Various methods of measuring seepage have been devised which are adaptable for use in the field or in the laboratory. Some of these methods yield results which are the average seepage for a section of a canal, while others give the seepage rate for a small area, or merely furnish information as to the permeability of a sample of the canal bed material, either in its undisturbed state or in a crushed, screened, and compacted condition. Where methods are used that yield only the permeability, additional observation must be made to deter-mine the hydraulic gradient.
The principal method of measuring seepage now in use are:
(1) ponding; (2) inflow-outflow; (3) seepage meter; (4) well permeameter (5) laboratory permeability; and (6) special methods such as measuring
-3-electrical resistance in the areas where seepage is occurring or tracing radio-active material in the seepage water. Seepage rates based on ponding test are the most reliable but the cost of these tests frequently precludes the use of this method. For this reason other methods must usually be adopted.
The project which is being reported was initiated to: (1) study the existing methods of measuring seepage; (2) develop new methods of measuring seepage; and (3) study the factors that affect seepage. The experimental phases of the project have been completed and a final report is now in the process of publication. The project was conducted by the U.S. Department of Agriculture, Agricultural Research Service; in cooperation with the U.S. Bureau of Reclamation, Region 7,
and the Colorado Agricultural Experiment Station. Measurement of Seepage Losses Seepage Rings
Because of the limitations in the customary methods of measuring seepage such as inflow-outflow and pool methods, it was decided in the present study that a portion of the experiments would be conducted in artificial pools where the measurements and factors involved could be determined as accurately as possible. These pools were formed by concentric metal rings as shown in figure 1. These rings could
accommodate a 2-foot depth of water and the inflow to maintain a con-stant depth of water could be accurately measured. The calibration of the seepage meter was accomplished using these rings with the
S
4
t
-4-to the seepage ring rate. The rings were installed in several loca-tions in soils ranging from clay to sand. These rings were operated in each location for periods of approximately six months. The rings also provided facilities for studying the effect of depth of water, time, temperature and other related factors on the seepage rate from different types of soils.
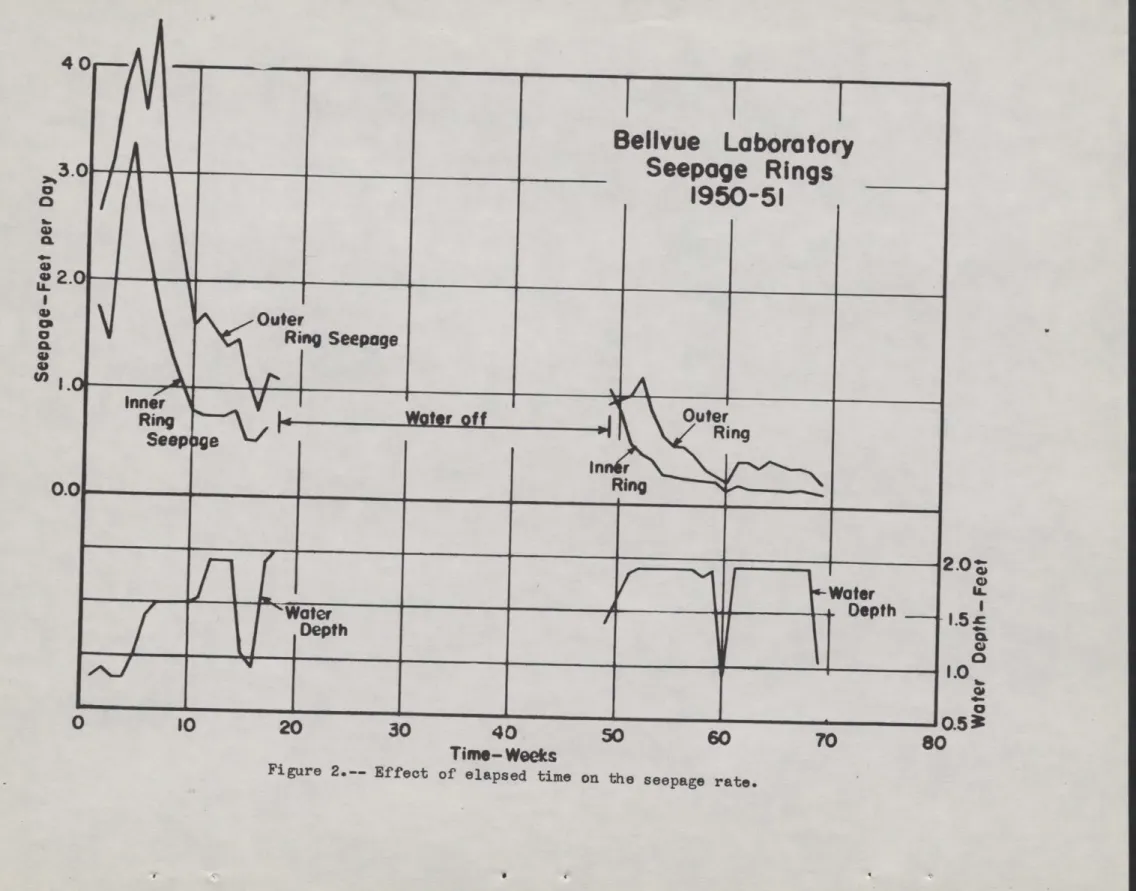
In long term seepage tests, it is significant to note the effect of time and its related factors on the seepage rates. Generally, the seepage rates decreases with time since the water was first introduced. Figure 2 shows the seepage rate from rings installed in sandy loam over a period of two years. The seepage rates con-tinued to decrease throughout the entire period although there was
no silting taking place. This decrease was probably due to micro-biological action, the breaking down of soil aggregates and possibly clogging of pores.
Seepage Meters
Seepage meters have been widely used as a means of locating areas of canals where high seepage losses are occurring. Theoreti-cally, they should measure the seepage through the area where they are installed. However, these meters had never been calibrated to see if they actually did measure the true rate of seepage. Therefore, the main emphasis of the present study was on the calibration of the meters and on recommendations as to the best method of installation. Figure 3 shows one type of seepage meter which was developed by the U.S. Bureau of Reclamation and used in this study. The bell of the meter is pressed into the canal bottom or side in order to
-5-isolate a small area. The meter is installed under water but the
area under the bell is isolated so that water is fed into the bell from the plastic bag which is submerged in the canal. A seepage rate could then be determined from the amount of water drawn from the bag over a
period of time.
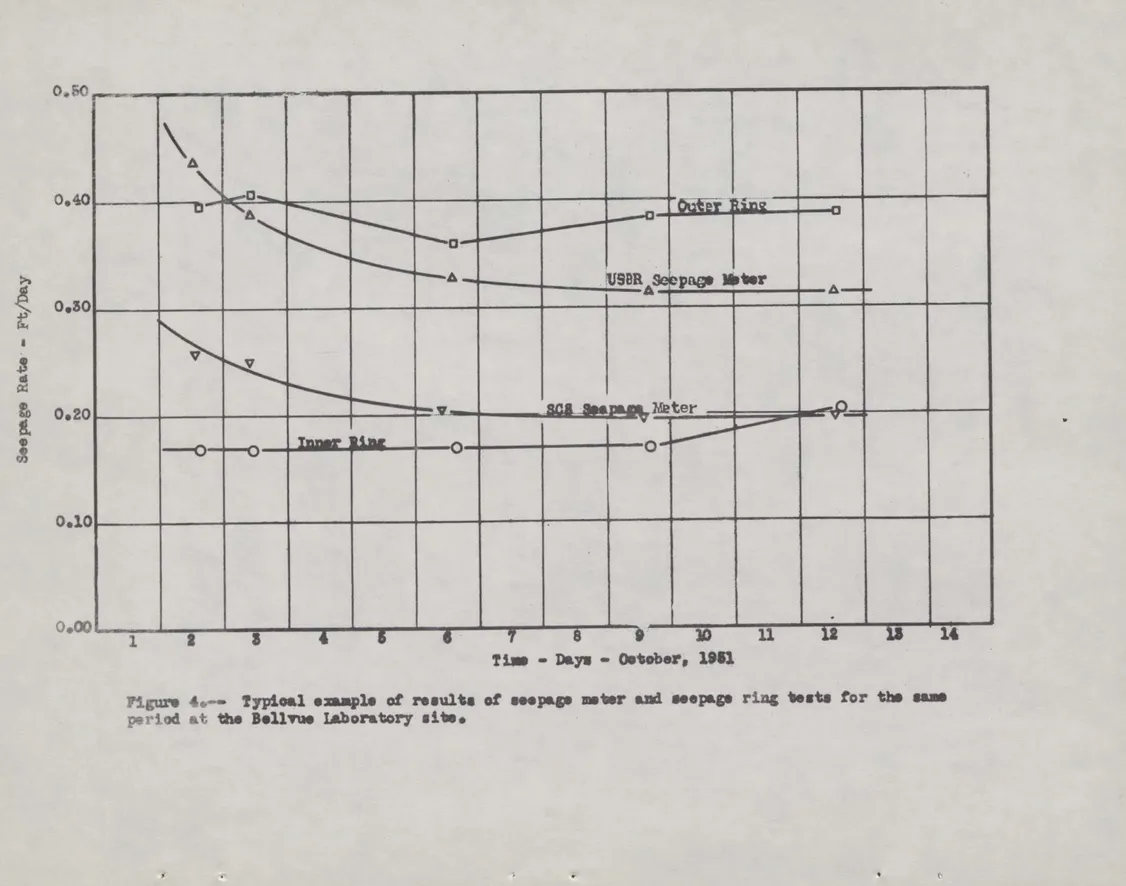
Several hundred tests were made with the seepage meter in the seepage rings. In some types of soil the initial rates measured by the meters were much higher than those indicated by the seepage rings. An example of this is shown in figure 4. In other cases the seepage meter rates were lower than the seepage ring rate. The method of installation seemed to affect the results. Hammering or jarring the meters during installation tended to influence the results in that the measured rates were much lower than the seepage rings rates.
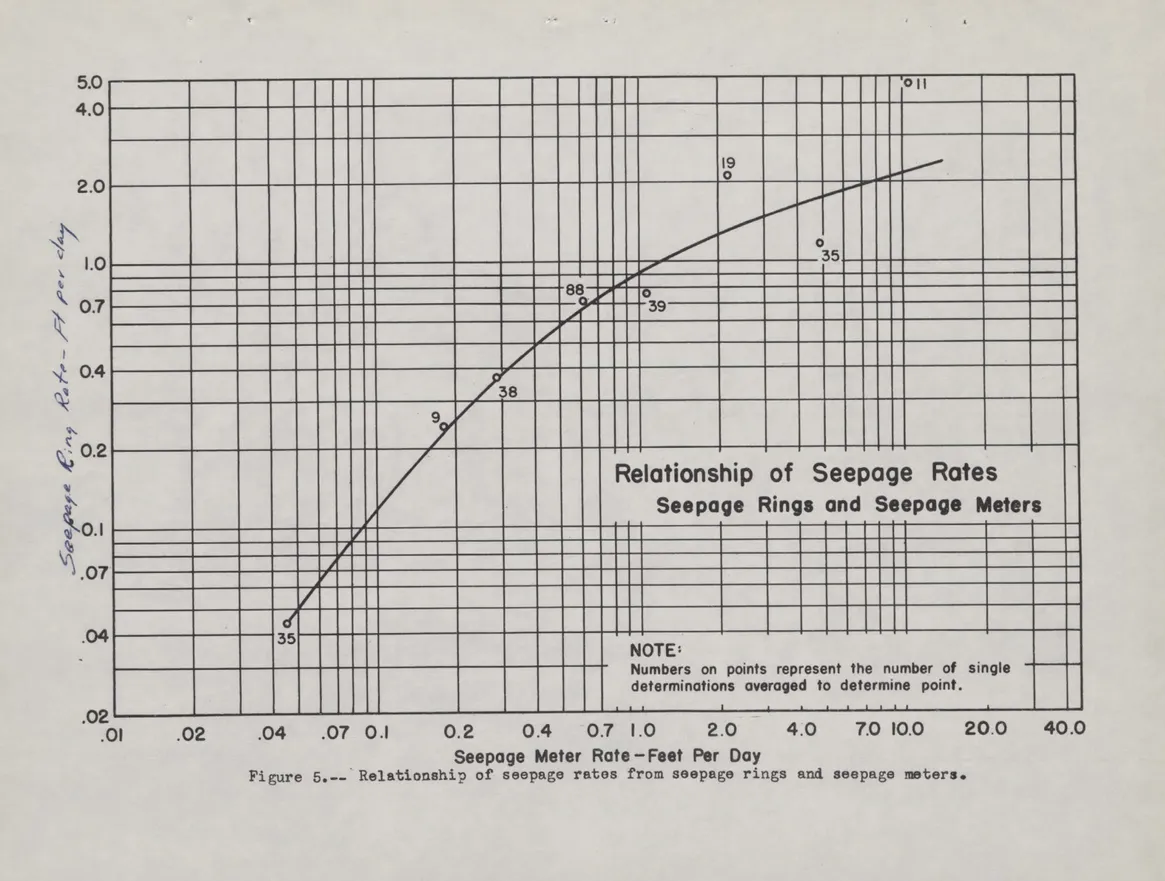
A calibration curve for the seepage meter is shown in figure 5. The rates as measured by the seepage meter and those determined in the rings agree fairly well up to a rate of 1.0 feet per day (cubic feet per square foot per day). Above this point however the seepage meter rates are greater than the seepage ring rates.
Seepage meter tests in canals which were checked by ponding tests gave discouraging results. The seepage meter tests were made only in the canal bottoms and at great distances apart. It is believed that the discrepancy in the results was due to the possi-bility that the seepage was greater through the sides than through the bottom of canals. In order to obtain satisfactory results with seepage meters in canals, the meters should be installed on the sides
A
-6-as well -6-as the bottom of canals. The me-6-asurements should be made -6-as close together as possible.
Well Permeameters
Whenever the feasibility of a new irrigation project is being investigated, there is need for information on the probable seepage loss from proposed canals. The well permeameter was devised for this purpose. This device measures the rate at which water seeps from a small well drilled in the soil on the center line of the proposed canal. After observations have been made on seepage from wells at intervals along the canal, an estimate of probable seepage loss can be made.
The well permeameter is shown in figure 6. This permeameter consists of a calibrated supply tank equipped with an indicator glass and an outlet pipe equipped with a float mechanism. The float
maintains a constant water level in an uncased hole. This hole varies in depth but is usually drilled to the same elevation as the proposed canal invert.
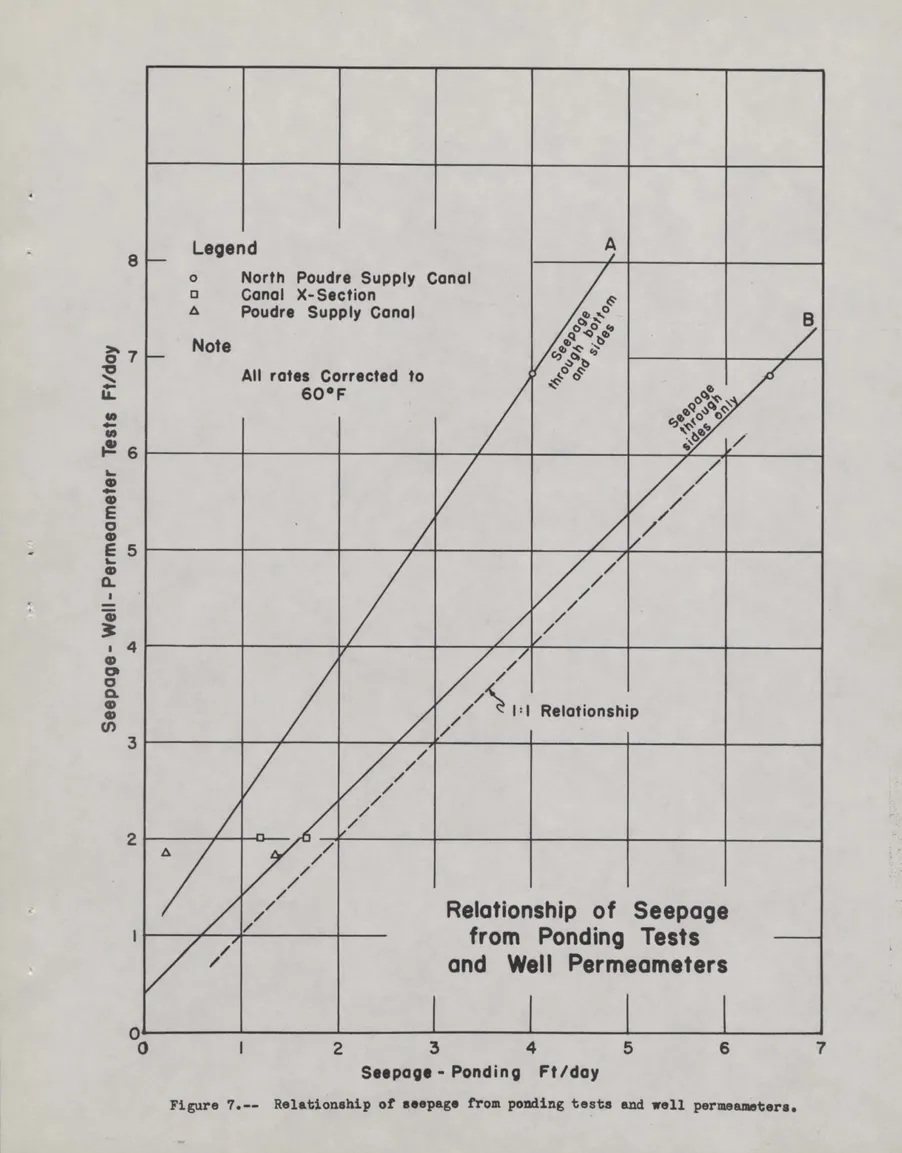
A calibration curve for the well permeameter is shown in
figure 7. The test results of the well permeameter tests have been compared to those from ponding tests on the canal after completion. The permeameter test results were computed on the basis of the
outflow from the well converted to a unit seepage rate over the wetted area of the well. From figure 7 it can be seen that the
correlation is not defined for line Ai For this relationship the seepage from the ponding test was considered to take place through the sides and bottom of the canal. From previous tests it had been
-7-determined that the bulk of the seepage occurrs through sides of a canal in many instances. For this reason the data from the ponding tests was recomputed so that all the seepage was considered as passing through the canal sides. This relationship is shown as line B on figure 7.
Special Studies Effect of Depth of Water on Seepage
Seepage measurements made by the ponding method during previous investigations of seepage have shown that the seepage rate increases as the depth of water in the canal increases. In Some instances the sides of the canal are more permeable than the bottom which results in an increased rate as the depth of water is increased. In order to study the effect of water depth on the canal bottom the seepage rings were used in which all the seepage would occur through the bottom under constant head.
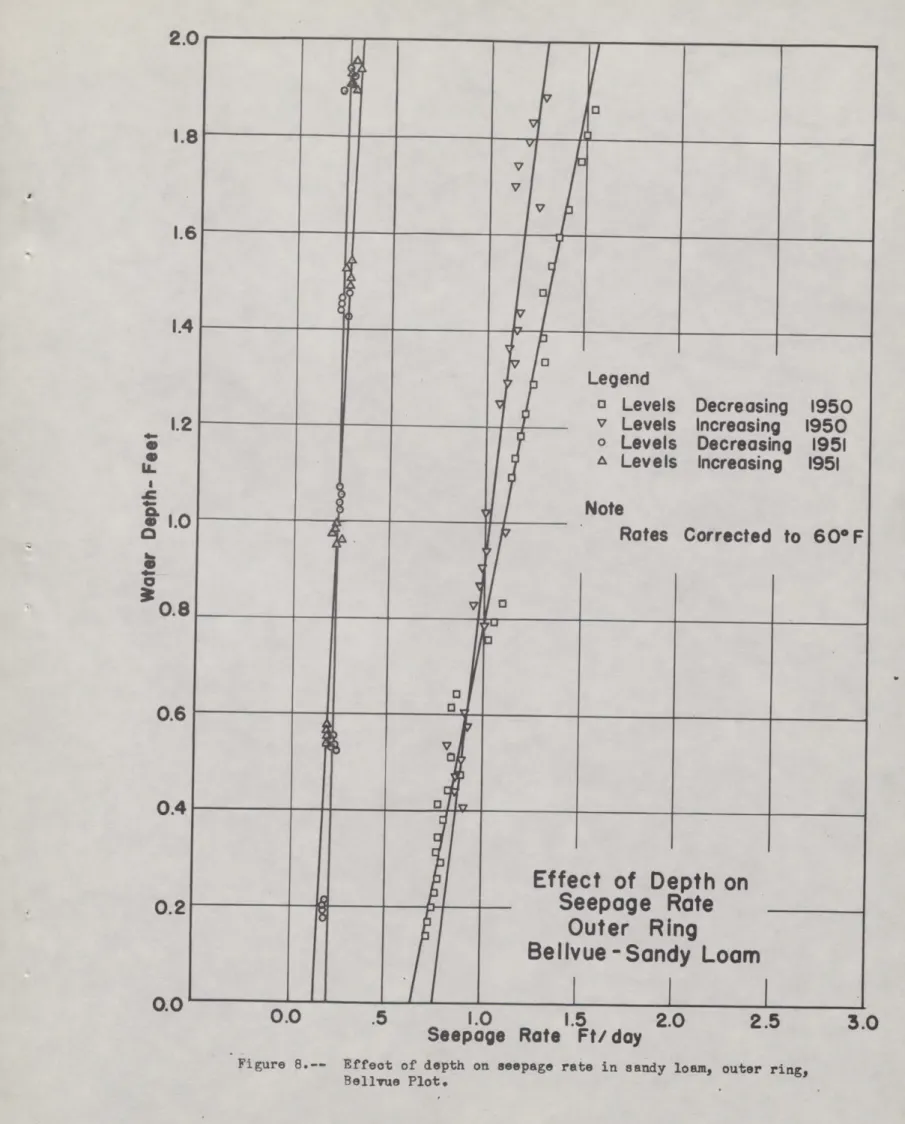
For determining the effect of depth on the seepage rate the water levels were allowed to drop in the seepage rings with readings taken every two hours of the water depth, seepage rate, and water temperature. Figure 8 shows the effect of depth on the seepage rate for several types of soils studied using the seepage rings. The, seepage rate always decreased as the depth decreased, but seepage was indicated even as the depth approached zero depth. This shows that the seepage rate is not directly proportional to the depth of water but is proportional to this depth plus some distance below the
surface. In all cases it should be noted that the seepage rate did vary in a straight line relationship and the rate increased with depth.
-8-From Figure 8 it is noted that in more permeable soils, an increase in depth results in a greater increase in seepage than in soils which are less permeable.
The results of several ponding tests on canals revealed however that the depth-seepage relationship was not linear, but that the slope usually increased with depth. This affect was probably due to the fact that the seepage through the sides was much greater than through the bottom of the canal.
A method of solving for the permeability K, for the seepage rings was developed which is based on the results of the effect
of depth study. The data for the inner ring were used. By pro-jecting the lines representing the depth-seepage relationship until zero depth was reached, a value for the seepage rate was deter-mined when the water level and the ground surface coincide.
According to Darcy's equation, q = K where q is the rate of flow per unit area; K is the permeability; h is the hydraulic head; and 1 is the length of the soil column. At zero depth of water, h and 1 are equal so that .12 equals unity, and q
1
equals K at this point. It should be pointed out that this is true only if a negative head caused by soil moisture tension does not exist or is negligible. From figure 8 the permeability K for the inner ring is 0.16 feet per day using this method. This develop-ment may prove useful in other studies for determining the perme-ability of soils.
Effect of Depth to Ground Water
One of the problems encountered in the study of seepage is the effect of depth to ground water on the seepage rate. Previous investigators (1) have noted, in connection with water spreading studies, that the seepage rate decreases as the ground water level approaches the surface of the ground. The problem was investigated during the present study to find out, if possible, how important this factor is and also within what limits of ground-water levels it is effective.
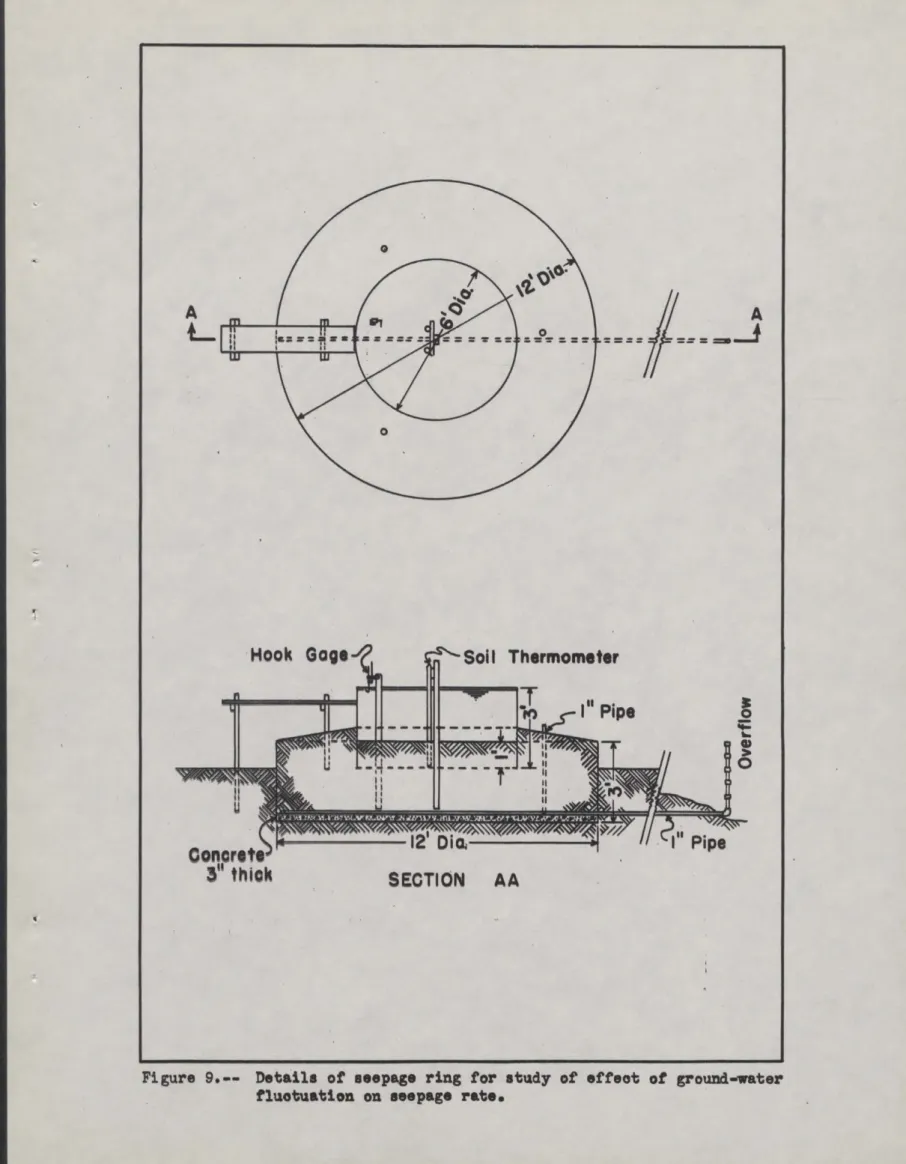
In order to study the effect of depth to ground water on the seepage rate, special equipment as shown in figure 9 was constructed. This equipment consisted of two concentric rings with the larger ring sealed on the bottom and filled with soil. This ring contained an adjustable outlet so that the ground water could be maintained at any desired level. The inner ring was placed so as to accomodate a maximum two-foot depth of water held at constant level. The inflow to maintain this constant level was measured accurately. Soil
thermometers were placed in the inner ring to obtain the soil temperature at various depths. Tensiometers were also placed in the rings to obtain the soil tension.
These rings were located in different types of soils and con-tinuous operation was maintained over a period of several months. The ground water was held at constant level for a period of approximately
(1) Mitchelson, A. T. and MUckel, D. C., Spreading Water for
Underground Storage, USDA Technical Bulletin 578, 1937, 80 pp., illus.
-10-five days. After this time the level was changed by adjusting the elevation of the outlet pipe. The elevations were changed in sequence starting at maximum depth and proceeding by six-inch increments until zero depth was reached. The ground-water eleva-tions were then lowered by the same increments until maximum depth was again maintained. Approximately three complete cycles were made during the test period.
The results of tests on the effect of depth to ground water on the seepage rate are shown on figure 10. The rate for sand increased to approximately twice that at zero depth when the ground water was lowered one foot. Below this one-foot depth the lowering of the water table did not change the seepage rate. For the sandy loam the
seepage rate had increased to approximately three times when the ground water level had been lowered 2.5 feet. The maximum depth to ground water that could be obtained with the equipment was 2.75 feet. For the sandy clay the rates had increased an average of twice the rate at zero depth when the ground water was lowered 2.5 feet below the ground surface.
For both the sandy clay and sandy loam the seepage rates were continuing to decrease at 2.5 feet depth to ground water. From this, it is safe to assume that a further lowering of ground water would result in a continuing decrease in seepage rates.
Effect of Temperature on the Seepage Rate
That temperature should affect the seepage rate has long been recognized because of the known effect of temperature on the vis-cosity of water. Since the visvis-cosity increases as the temperature
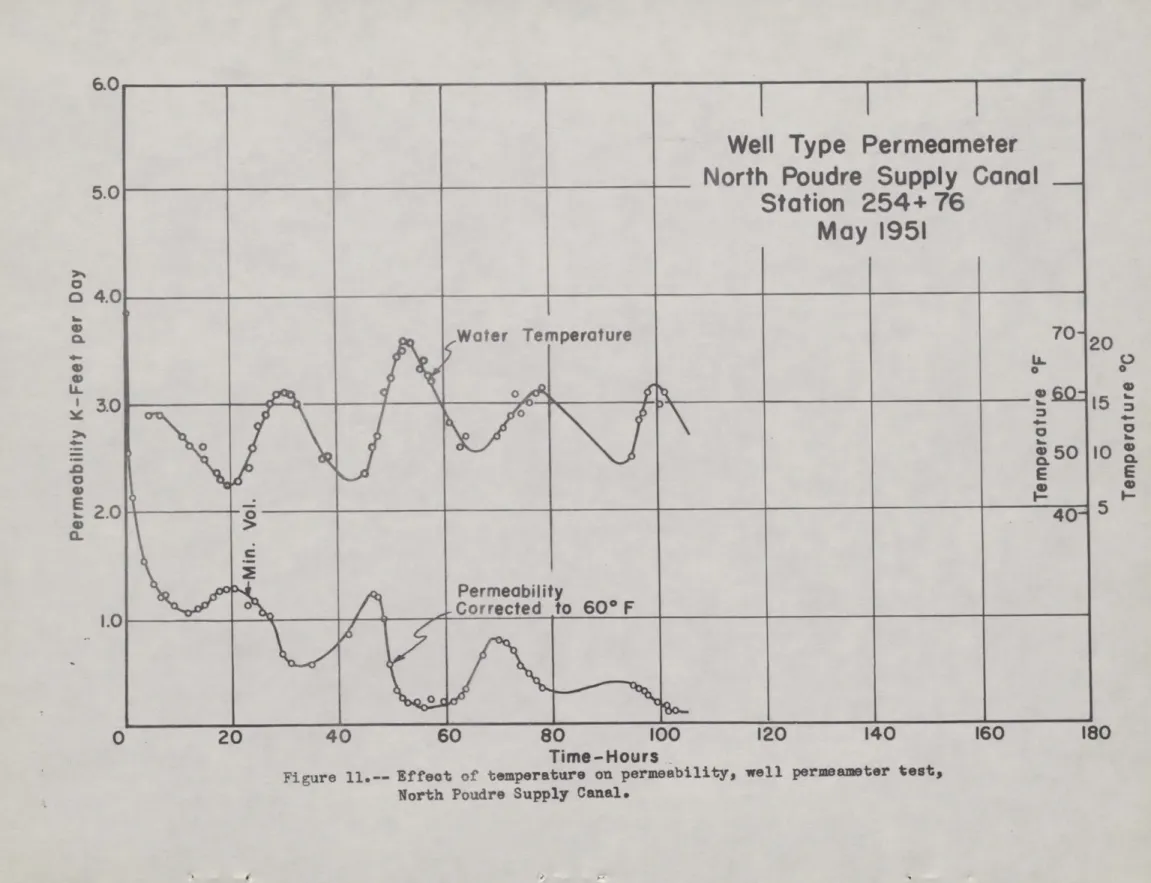
-11-decreases, the seepage rate should decrease when the temperature drops. However, continuous tests with well permeameters on the line of the proposed North Poudre Supply canal showed that the loss
from the permeameters increased as the temperature decreased, see figure 11, and that the maximum losses occurred when the temper-ature was a minimum. Twice daily readings of the seepage loss from the seepage rings in various types of soil had failed to
dis-close this tendency. For this reason several series of continuous observations for periods of three days were made on the seepage rings to determine whether temperature affected the seepage read-ings in the same way. The readread-ings were taken at 2-hour intervals.
These tests were made on several different types of soil. In order to eliminate possible inaccuracies caused by the domestic water meters, the losses were determined by noting the drop in the water surface in the rings with the water supply shut off. The rings were refilled between readings to minimize the effect of the drop in water level. These observations on the seepage rate also showed that the seepage rate decreased as the temperature of the water decreased.
There was considerable variation in the amount of the decrease in different types of soil but the trend was unmistakable. The
maximum variation in the seepage rates (35 percent) due to temperature occurred in the sandy soil. When the seepage rates were corrected for viscosity to the standard temperature of 60°F, the trend was more pronounced than before. The results of typical series of observations
-12-Attemps were made to explain this phenomenon on the basis of the expansion and contraction of the bubbles of air trapped in the soil as the temperature changed, but the change in volume of the air was too small to account for the difference in the seepage rate. The effect of the difference in solubility of air in water with tempera-ture was also investigated. Although this is a logical approach to the problem the temperature gradient between the water and the soil was usually too small to account for the observed differences.
Apparently Some other factor, dependent on temperature, was causing the variation in the seepage rate. Because the air that remains in the soil even after long periods of saturation would change in volume with changes in the vapor pressure of the saturated air in the bubbles, the effect of these changes was also investigated. Vapor pressure changes rapidly with an increase in temperature and
for this reason the expansion of the bubbles which reduces the perm-eability of the soil, should decrease the seepage rate as was found by the tests.
The effect of change in porosity on the permeability of granular material has been shown by Fair and Hatch (2) to be proportional to
n3
5 where n is the porosity of the material. Small changes in
(1-n)2
porosity produce large changes in the permeability and consequently in the seepage rate, because seepage is directly proportional to perm-eability. Unfortunately the percentage of air bubbles in the soil was unknown but by assuming various percentages of air, the effect of changes in vapor pressure could be determined.
(2) Franzine, J. B., Porosity factor for case of laminer flow through granular media. Transactions, American Geophysical Union. Vol. 32, pp. 443-446 illus., 1951.
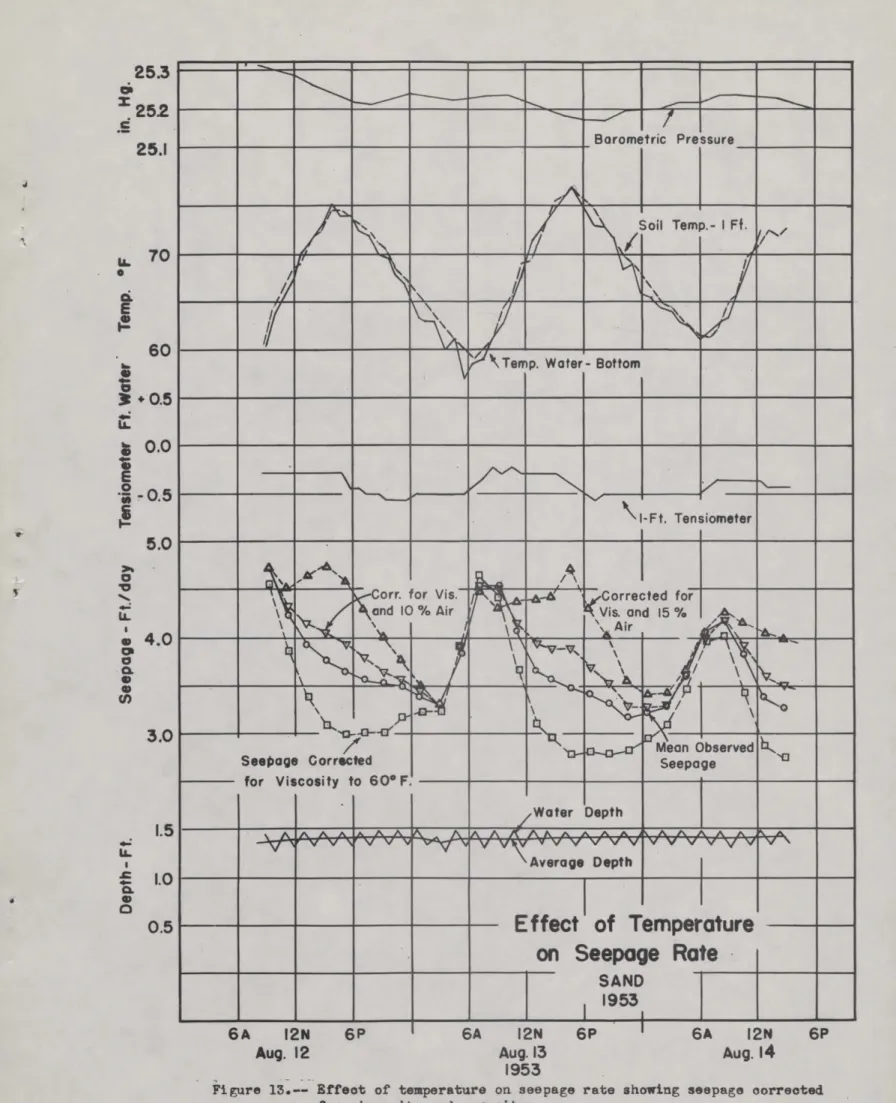
-13-Seepage rates corrected in this manner for assumed values of 10 and 15 percent air are shown in figure 13. The corrected seepage rates for 15 percent air and standard viscosity seem to follow the air temperature, whereas if the assumption were correct, the seepage rate should be constant. When the corrections are made on the
assumption that the soil contains 10 percent air, the seepage rate approaches the observed rate. For this condition the correction for change in viscosity apparently just about balances the correction for change in permeability due to the variation in vapor pressure with temperature. Although the vapor pressure of the entrapped air seems to have a definite effect on the seepage rate, the precise relation-ship of the factors to the seepage rate could not be determined from the data available.
In the study of the effect of temperature on the seepage rate it was observed that the seepage rate was small when the difference between the temperature of the water and the soil was large and that the reverse was true when the temperature difference was small. This relationship was particularly noticeable when the temperature
of the water was at the maximum during the day. This phenomenon oan be explained by the fact that the soil is soon raised to the water temperature when the seepage rate is high whereas the soil temperature is affected but little by the seepage if the rate is small. Preliminary studies indicate that the temperature difference
might be
used as the basis for determining the relative seepage rates from different parts of a canal.
-14-Summary
The seepage rings provide an accurate method of measuring seepage rates in small, isolated areas. For this study the seepage rings were used as a standard for the calibration of seepage
meters. Additional factors which affect seepage such as time, temper-ature and depth of water were also studied using the seepage rings. The study demonstrated the fact that there are many other factors besides the soil type which determine the seepage rate.
The calibration of seepage meters showed that although the meters do not provide an accurate method of measuring seepage, they do indicate the order of magnitude of the loss. For losses less than 1.0 foot per day the meters give a fairly accurate measurement but for greater rates the meters definitely over-register. Care must be exercised in installing the meters since hammering or jarring the meter was likely to affect the results. It was found that a period of from two days to a week should elapse after the meters are installed before reliable readings could be obtained. The plastic bag seepage meter was the simplest type to operate and the results seemed to be reliable. It was concluded that seepage meter measurements must be made in the sides as well as the bottom of canals in order to obtain reliable estimates of seepage.
A method of analysis was developed for using the well
permeameter test results in forecasting the seepage from proposed canals. A further study of this method is needed before its use can be recommended.
-15-Studies of the effect of depth of water on seepage show that the rate increases as the depth increases but not in direct pro-portion to the increase in depth. For a high seepage rate, an increase in depth gave proportionally a greater increase in rate than that for a low rate.
The depth to ground water had a definite effect on the seepage rate. The tests showed that the seepage increased as the depth to ground water increased within the range of depths tested, except in a sandy material. The tests on sand showed that increasing the depth beyond one-foot did not further increase the seepage rate. At maximum depth to ground water (2.75 feet) the seepage rate was several times that when the ground water level was at the ground surface in the other types of soil.
In a number of tests it was found that the seepage rate is not a constant but may vary over wide ranges for periods of a few hours. In some cases, the highest seepage rates occurred at the lowest water temperatures and the lower rates at the higher temperatures. Since this phenomenon was contrary to present conceptions of the influence of the factors involved, a detailed study was made to determine the cause of the fluctuations. These studies, however, have not been successful in explaining the vari-ations.
Although a great deal has been learned about seepage as a result of this study, many questions still remain unanswered, and because of the economic importance of seepage losses, the study of the problem should be continued.
ie Compacted Earth Fill ?
szt,
03 w Hook Gage Variable Water SurfacePLAN
Float 5/8" Rubber Hose
Valved
16 Gauge Galvanized Iron
ELEVATION AND SECTION
FIGURE I .- SEEPAGE RINGS
Water Meter
Original Groun Surface I
40
0.0
I
v!
_
_
Bellvue
Laboratory
Seepage
I
I
Rings
,
1950-51
,
,
fr
\
1
Outer
Ring
I
Seepage
,
,
Inner
Ring
Seepage
Water off
Outer
Id
1
In •r
Ring
Ring
,
,
.
,
.
i
Water
Depth
Water
Depth
,
,
.
'
.
.
v
10
20
30
40
Time—Weeks
Figure 2.-- Effect of elapsed time on the seepage rate.
0,
0.
0,
0.
0.
40
30
20
10
DO
0
ot2i. abig
0
A
.
.
usaR
Sdepags NOter
4..,
•
vm...--____.jrj_jempo,Theter
"
'
'
0--.
0
•
.,_
2
3
Time •
Days
•
October, 1951
14
Figure 4.—• Typical example of results of seepage meter and seepage ring tests for the same
period at the Bellvue Laboratory sits.
•
5.0
4.0
2.0
.04
.02
35 38 9 88 19 35 'oil 39Relationship of Seepage Rates
Seepage Rings and Seepage Meters
NOTE:
Numbers on points represent the number of single determinations averaged to determine point.
.01
.02
.04
.07 0.1
0.2
0.4
0.7 1.0
2.0
4.0
7.0 10.0
20.0
40.0
Seepage Meter Rate —Feet Per Day
Figure 6. -- Equipment for well permeameter test, North Poudre Supply Canal.
8
3
2
0
____
_
Legend
o
0 ANote
North Poudre
Canal X-Section
Poudre Supply
All rates Corrected
60°F
Supply Canal
Canal
to
•A
e.,c)
4
N
o
co
q •00
Q.;co e,
o b k 0 "e
4
o r
e9P
c9z-c,
t13,
,,,e,
.°
(0'
/
/
/
/
/
/
/
/
/
/
/
/
/
/
(
/
/
/
///#< I:1
/
Relationship
a
__,/
/ / //
/
/
/
/
/
,i
/
A/
/
/
/ /Relationship
from
and Well
I
I
of
Ponding
Permeameters
Seepage
Tests
/
/
/
I
.
0
2
3
4
Seepage - Ponding Ft/day
Figure 7.-- Relationship of seepage from ponding tests and well permeamaters.
2.0
1.8
1.6
1.4
0.6
0.4
0.2
0.0
G.:'
0
V
v
V
0
,
,
•
Legend
0 Levels
v Levels
0 Levels
ALevels
Note
Rates
Decreasing
Increasing
Decreasing
Increasing
Corrected
1950
1950
1951
1951
to 60°F
,
,
i
0
a,
,..0
t
0
VI 0 1iv
01:ia
.,.
.
.
.
.
Effect
Seepage
Bellvue
of Depth
Outer Ring
-Sandy
on
Rate
Loom
I
f
:
.
0.0
.5
1.0
1.5
2.0
Seepage Rate Ft/ day
Figure 8.-- Effect of depth on seepage rate in sandy loam, outer ring, Bellvue Plot.
roxigtiwittriaiwirpok.mnyAgurityv.itumw.-Asi-Ly..feiv.e.eriou---/wr..1-„, vb/
Figure 9.-- Details of seepage ring for study of effect of ground-water fluotuation on seepage rate.
•
4.0
3.0
2.0
r,
g 1.0
-0C
=
0
6
0
•- 3.0
1:
4-a,
2.0
1.0
o
Legend
0 Series
0 Series
ASeries
2
3
.
.,
.1..1111.1°1111111.11111-6.6
SANDY CLAY
.
elA
,
sSANDY LOAM
.
A
SAND
Effect
Elevation
Seepage
of Water
on
Rate
Table
i
0
0.5
1.0
1.5
2.0
2.5
Depth to Ground Water from Ground Surface
Figure 10.-- Effect of water table elevation on seepafte rata.
3.0
6.0
5.0
0
o
4.0
Q.
4-LL
3.0
lc
7.
• GMM..01E
0
a; 2.0
a_
1.0
0
1
Well
North
1
Type
Poudre
Station 254+76
May
i
Permeameter
Supply
1951
Canal
, %
.,
:
k
.
•
Al
Water Temperature
.
• •
Temperature
°F
CP -NJ0
P
0 i
• •
•
.
•
.
•
.
.
.
0
•
.
.
.
.
.
• •
•
.
.
.
.
..
• .,•
•
•••
.
.,
..
Permeability
Corrected to 60°
F
40-.. .
.
.
....o.,*
.,
•
..
.•
20
40
60
80
100
Time-Hours
Figure 11.-- Effect of temperature on permeability, well permeameter test, North Poudre Supply Canal.
120
140
160
5
1.50
1.10
Water Temp • • • r .117100,•., 1953 P-/ -Soil Temp. at 1 Ft. 1953 a r • g . •• -o-_ -o- _-o-. • .0, • if/ • -• a -- - •.. 13-• a • . p. -.-. • • • ie .. il Water Temp • • • ,. je. = • Soil . Temp at I Ft. 1952 a 1952 . a •.
. /.. -.
N
Seepage 1952 .. . . . 2 2 • eepage 1953 2Legend
0
Sandy
o Sandy
Seepage
Viscosity
Loom
Loom
Corrected
to
1952
1953
60•F
.
for
_
"'Awe's Water Depth
----
Effect
I
on
Sandy
I
of Temperature
Seepage
I
Rate
Loam
I
I
.
6A
12N
6P
6A
12N
6P
Time
Figure 11...• liffeot of temperature or seepage rate, sandy loam.
6A
12N
6P
80
70 17)
0
-n
60
0.0
25.3
!
252
25.1
i.
70
.
60
h.3
+ 0.5
Lt.
1 00
-
0.5
Seepage
-
Ft./day
5.0
4.0
3.0
1.5
10
a •
0
0.5
---Barometric Pressure \ , Soil Temp.- 1 Ft. / / \ \ \\ / / \ \ \ \ \\ Temp. Water- Bottom
-Ft. Tensiometer
.
,
,
.
.
,.... _ -
/ \
4
\ . \ . Corr. • and 10% for Vis. Air " li, __A.
-A,
,e Corrected ck Vis. and \ Aira
for 15%,
\,
‘•
1
\ \ % v, \\.
. / / ,--v, , • 0 IR \ \ r -0-43--Cr7 \ • \ . . .--/ - ,s- ' " . \ 1 o 4. Seepage for Viscosity / Corrected to 60° F Mean Observed Seepage 1:1 Water Depth . • 4'. V V . Y V V• •AV • AA•V I ALLA. . a • A V V V • Average DepthEffect
1on Seepage
of Temperature
SAND
1953
IRote
I6A
I2N
6P
Aug. 12
6A
I2N
6P
Aug. 13
1953
Figure 13.-- Effect of temperature on seepage rate showing seepage corrected for viscosity and porosity.
6A
I2N
6P
CANAL SEEPAGE by
A. R. Robinson, J.M. ASCE; and Carl Rohwer, M. ASCE. Agricultural Research Service, USDA
Colorado Agricultural Experiment Station (Paper to be presented at San Diego Convention, ASCE, February 10, 1955)
Introduction
Of the water diverted for irrigation in the 17 Western States, _
it is estimated that 35,000,000 acre feet or about 40 ercent is lost before it reaches the farms. On 46 operating projects con-structed by the U.S. Bureau of Reclamation it was determined that approximately 25 percent of the water was lost in transit. This loss consists of seepage, evaporation, transpiration and leakage. The water lost by seepage is by far the greatest of the losses. This seepage water is not only lost to the canal to which it is appropriated, but may also cause considerable damage to lands as a result of high water table conditions and excess salts in the soil. Although the water is lost to the canal, it is not totally lost as a considerable amount may go to replenish ground water supplies or to increase the return flow to streams.
Methods of measuring seepage are necessary in order to deter-mine the magnitude of the losses and also to isolate reaches of canals where high losses are occurring. Water is becoming in-creasingly valuable and it is necessary to determine from an
economic standpoint whether the value of the water saved, the land reclaimed, and the savings in cost of operation and maintenance
-2-will exceed the cost of lining. It is also desirable to determine if a new'canal should be lined before construction is started.
Many factors have a definite effect on the seepage rate, but the permeability of the material forming the bed of the canal is the most important one. Other factors which influence the seepage rate are: (1) the depth of water in the canal; (2) the length of time the canal has been in operation; (3) the depth to ground water; (4) the tempera-ture of the water and the soil; (5) the percentage of entrained air. ir0b3
.,,••••••*"...•••••••••••••••••M.,
qa_soil;_(6) the soil moisture tension; (7) the salt contentof the soil or water and; (8) the silt carried by the canal. Biological factors and the barometric pressure may affect the seepage rate to greater or less degree depending on conditions. Since all these factors may act simultaneously and in some cases counteract each other, it is diffi-cult to segregate the effect of any one of them.
Various methods of measuring se have been devised which are adaptable for use in the field or in the laboratory. Some of these methods yield results which are the average seepage for a section of a canal, while others give the seepage rate for a small area, or merely furnish information as to the permeability of a sample of the canal bed material, either in its undisturbed state or in a crushed, screened, and compacted condition. Where methods are used that yiOld only the permeability, additional observation must be made to deter-mine the hydraulic gradient.
The principal method of measuring seepage now in use are:
(1) ponding; (2) inflow-outflow; (3) seepage meter; (4) well permeameter (5) laboratory permeability; and (6) special methods such as measuring
(963e-1
-3-electrical resistance in the areas where seepage is occurring or tracing radio-active material in the seepage water. Seepage rates
aJ
e
based on ponding test are the most reliable but the cost of these tests frequently precludes the use of this method. For this reason other methods must usually be adopted.
The project which is being reported was initiated to: (1) study the existing methods of measuring seepage; (2) develop new methods
of measuring seepage; and (3) study the factors that affect seepage. The experimental phases of the project have been completed and a final report is now in the prooess of publication. The project was conducted by the U.S. Department of Agriculture, Agricultural Research
. .
-Service; in cooperation with the U.S. Bureau of Reclamation, Region 7, and the Colorado Agricultural Experiment Station.
Measurement of Seepage Losses Seepage Rings
Because of the limitations in the customary methods of measuring seepage such as inflow-outflow and pool methods, it was decided in the present study that a portion of the experiments would be conducted in artificial pools where the measurements and factors involved could be determined as accurately as possible. These pools were formed by
concentric
metal rings as shown in figure 1. These rings couldaccommodate a
2-foot depth of water and the inflow to maintain a con-stantdepth
of water could be accurately measured. The calibration ofthe seepage meter was
accomplished using these rings with themeters installed in the outer ring and the rate from the meter compared
-4-to the seepage ring rate. The rings were installed in several loca-tions in soils ranging from clay to sand. These rings were operated in each location for periods of approximately six months. The rings also provided facilities for studying the effect of depth of water, time, temperature and other related factors on the seepage rate from different types of soils.
In long term seepage tests, it is significant to note the effect of time and its related factors on the seepage rates. Generally, the seepage rates decreases with time since the water was first
introduced. Figure 2 shows the seepage rate from rings installed in sandy loam over a period of two years. The seepage rates con-tinued to decrease throughout the entire period although there was no silting taking place. This decrease was probably due to micro-biological action, the breaking down of soil aggregates and possibly clogging of pores.
Seepage Meters
Seepage meters have been widely used as a means of locating areas of canals where high seepage losses are occurring. Theoreti-cally, they should measure the seepage through the area where they are installed. However, these meters had never been calibrated to see if they actually did measure the true rate of seepage. Therefore, the main emphasis of the present study was on the calibration of the meters and on recommendations as to the best method of installation. Figure 3 shows one type of seepage meter which was developed by the U.S. Bureau of Reclamation and used in this study. The bell of the meter is pressed into the canal bottom or side in order to
-5-isolate a small area. The meter is installed under water but the
area under the bell is isolated so that water is fed into the bell from the plastic bag which is submerged in the canal. A seepage rate could then be determined from the amount of water drawn from the bag over a
period of time.
Several hundred tests were made with the seepage meter in the seepage rings. In some types of soil the initial rates measured by the meters were much higher than those indicated by the seepage rings. An example of this is shown in figure 4. In other cases the seepage meter rates were lower than the seepage ring rate. The method of installation seemed to affect the results. Hammering or jarring the meters during installation tended to influence the results in that the measured rates were much lower than the seepage rings rates.
A calibration curve for the seepage meter is shown in figure 5. The rates as measured by the seepage meter and those determined in the rings agree fairly well up to a rate of 1.0 feet per day (cubic feet per square foot per day). Above this point however the seepage meter rates are greater than the seepage ring rates.
Seepage meter tests in canals which were checked by ponding tests gave discouraging results. The seepage meter tests were made only in the canal bottoms and at great distances apart. It is believed that the discrepancy in the results was due to the possi-bility that the seepage was greater through the sides than through the bottom of canals. In order to obtain satisfactory results with seepage meters in canals, the meters should be installed on the sides
-6-as well -6-as the bottom of canals. The me-6-asurements should be made -6-as close together as possible.
Well Permeameters
Whenever the feasibility of a new irrigation project is being investigated, there is need for information on the probable seepage loss from proposed canals. The well permeameter was devised for this purpose. This device measures the rate at which water 1?..2yp. from a small well drilled in the soil on the center line of the proposed canal. After observations have been made on seepage from wells at intervals along the canal, an estimate of probable seepage loss can
be made. 4-& dilew—C1
The well permeameter is shown in figure 6. This permeameter consists of a calibrated supply tank equipped with an indicator glass and an outlet pipe equipped with a float mechanism. The float
maintains a constant water level in an uncased hole. This hole varies in depth but is usually drilled to the same elevation as the proposed canal invert.
A calibration curve for the well permeameter is shown in
figure 7. The test results of the well permeameter tests have been compared to those from ponding tests on the canal after completion. The permeameter test results were computed on the basis of the
outflow from the well converted to a unit seepage rate over the wetted area of the well. From figure 7 it can be seen that the
correlation is not defined for line A, For this relationship the seepage from the ponding test was considered to take place through the sides and bottom of the canal. From previous tests it had been
-7-determined that the bulk of the seepage occurrs through sides of a canal in many instances. For this reason the data from the ponding tests was recomputed so that all the seepage was considered as passing through the canal sides. This relationship is shown as line B on figure 7.
Special Studies Effect of Depth of Water on Seepage
Seepage measurements made by the ponding method during previous investigations of seepage have shown that the seepage rate increases as the depth of water in the canal increases. In some instances the sides of the canal are more permeable than the bottom which results in an increased rate as the depth of water is increased. In order to study the effect of water depth on the canal bottom the seepage rings were used in which all the seepage would occur through the bottom under constant head.
For determining the effect of depth on the seepage rate the water levels were allowed to drop in the seepage rings with readings taken every two hours of the water depth, seepage rate, and water temperature. Figure 8 shows the effect of depth on the seepage rate for several types of soils studied using the seepage rings. The, seepage rate always decreased as the depth decreased, but seepage was indicated even as the depth approached zero depth. This shows that the seepage rate is not directly proportional to the depth of water but is proportional to this depth plus some distance below the surface. In all cases it should be noted that the seepage rate did vary in a straight line relationship and the rate increased with depth.
-8-From Figure 8 it is noted that in more permeable soils, an increase in depth results in a greater increase in seepage than in soils which are less permeable.
The results of several ponding tests on canals revealed however that the depth-seepage relationship was not linear, but that the slope usually increased with depth. This affect was probably due to the fact that the seepage through the sides was much greater than through the bottom of the canal.
A method of solving for the permeability K, for the seepage rings was developed which is based on the results of the effect of depth study. The data for the inner ring were used. By pro-jecting the lines representing the depth-seepage relationship until zero depth was reached, a value for the seepage rate was deter-mined when the water level and the ground surface coincide.
According to Darcy's equation, q = K., where q is the rate of flaw per unit area; K is the permeability; h is the hydraulic head; and 1 is the length of the soil column. At zero depth of water, h and 1 are equal so that 2,1 equals unity, and q
1
equals K at this point. It should be pointed out that this is true only if a negative head caused by soil moisture tension does not exist or is negligible. From figure 8 the permeability K for the inner ring is 0.16 feet per day using this method. This
develop-ment may prove useful in other studies for determining the perme-ability of soils.
Effect of Depth to Ground Water
One of the problems encountered in the study of seepage is the effect of depth to ground water on the seepage rate. Previous investigators (1) have noted, in connection with water spreading studies, that the seepage rate decreases as the ground water level approaches the surface of the ground. The problem was investigated during the present study to find out, if possible, how important this factor is and also within what limits of ground-water levels it is effective.
In order to study the effect of depth to ground water on the seepage rate, special equipment as shown in figure 9 was constructed. This equipment consisted of two concentric rings with the larger ring sealed on the bottom and filled with soil. This ring contained an adjustable outlet so that the ground water could be maintained at any desired level. The inner ring was placed so as to accomodate a maximum two-foot depth of water held at constant level. The inflow to maintain this constant level was measured accurately. Soil
thermometers were placed in the inner ring to obtain the soil temperature at various depths. Tensiometers were also placed in the rings to obtain the soil tension.
These rings were located in different types of soils and con-tinuous operation was maintained over a period of several months. The ground water was held at constant level for a period of approximately
(1) Mitchelson, A. T. and Muckel, D. C., Spreading Water for
Underground Storage, USDA Technical Bulletin 578, 1937, 80 pp., illus.
-10-five days. After this time the level was changed by adjusting the elevation of the outlet pipe. The elevations were changed in sequence starting at maximum depth and proceeding by six-inch increments until zero depth was reached. The ground-water eleva-tions were then lowered by the same increments until maximum depth was again maintained. Approximately three complete cycles were made during the test period.
The results of tests on the effect of depth to ground water on the seepage rate are shown on figure 10. The rate for sand increased to approximately twice that at zero depth when the ground water was lowered one foot. Below this one-foot depth the lowering of the water table did not change the seepage rate. For the sandy loam the
seepage rate had increased to approximately three times when the ground water level had been lowered 2.5 feet. The maximum depth to ground water that could be Obtained with the equipment was 2.75 feet. For the sandy clay the rates had increased an average of twice the rate at zero depth when the ground water was lowered 2.5 feet below the ground surface.
For both the sandy clay and sandy loam the seepage rates were continuing to decrease at 2.5 feet depth to ground water. From this, it is safe to assume that a further lowering of ground water would result in a continuing decrease in seepage rates.
Effect of Temperature on the Seepage Rate
That temperature should affect the seepage rate has long been recognized because of the known effect of temperature on the vis-cosity of water. Since the visvis-cosity increases as the temperature
-11-decreases, the seepage rate should decrease when the temperature drops. However, continuous tests with well permeameters on the line
of the proposed North Poudre Supply canal showed that the loss from the permeameters increased as the temperature decreased, see figure 11, and that the maximum losses occurred when the temper-ature was a minimum. Twice daily readings of the seepage loss from the seepage rings in various types of soil had failed to dis-close this tendency. For this reason several series of continuous observations for periods of three days were made on the seepage rings to determine whether temperature affected the seepage read-ings in the same way. The readread-ings were taken at 2-hour intervals.
These tests were made on several different types of soil. In order to eliminate possible inaccuracies caused by the domestic water meters, the losses were determined by noting the drop in the water surface in the rings with the water supply shut off. The rings were refilled between readings to minimize the effect of the drop in water level. These observations on the seepage rate also showed that the seepage rate decreased as the temperature of the water decreased.
There was considerable variation in the amount of the decrease in different types of soil but the trend was unmistakable. The
maximum variation in the seepage rates (35 percent) due to temperature occurred in the sandy soil. When the seepage rates were corrected for viscosity to the standard temperature of 60°F, the trend was more pronounced than before. The results of typical series of observations
-12-Attemps were made to explain this phenomenon on the basis of the expansion and contraction of the bubbles of air trapped in the soil as the temperature changed, but the change in volume of the air was too small to account for the difference in the seepage rate. The
effect of the difference in solubility of air in water with tempera-ture was also investigated. Although this is a logical approach to the problem the temperature gradient between the water and the soil was usually too small to account for the observed differences.
Apparently some other factor, dependent on temperature, was causing the variation in the seepage rate. Because the air that remains in the soil even after long periods of saturation would change in volume with changes in the vapor pressure of the saturated air in the bubbles, the effect of these changes was also investigated. Vapor pressure changes rapidly with an increase in temperature and for this reason the expansion of the bubbles which reduces the perm-eability of the soil, should decrease the seepage rate as was found by the tests.
The effect of change in porosity on the permeability of granular material has been shown by Fair and Hatch (2) to be proportional to
n3
5 where n is the porosity of the material. Small changes in
(1-n)2
porosity produce large changes in the permeability and consequently in the seepage rate, because seepage is directly proportional to perm-eability. Unfortunately the percentage of air bubbles in the soil was unknown but by assuming various percentages of air, the effect of changes in vapor pressure could be determined.
(2) Franzine, J. B., Porosity factor for case of laminer flow through granular media. Transactions, American Geophysical Union. Vol. 32, pp. 443-446 illus., 1951.
-13-Seepage rates corrected in this manner for assumed values of 10 and 15 percent air are shown in figure 13. The corrected seepage rates for 15 percent air and standard viscosity seem to follow the air temperature, whereas if the assumption were correct, the seepage rate should be constant. When the corrections are made on the
assumption that the soil contains 10 percent air, the seepage rate approaches the observed rate. For this condition the correction for change in viscosity apparently just about balances the correction for change in permeability due to the variation in vapor pressure with temperature. Although the vapor pressure of the entrapped air seems to have a definite effect on the seepage rate, the precise relation-ship of the factors to the seepage rate could not be determined from the data available.
In the study of the effect of temperature on the seepage rate it was observed that the seepage rate was small when the difference between the temperature of the water and the soil was large and that the reverse was true when the temperature difference was small. This relationship was particularly noticeable when the temperature
of the water was at the maximum during the day. This phenomenon can be explained by the fact that the soil is soon raised to the water temperature when the seepage rate is high whereas the soil temperature is affected but little by the seepage if the rate is small. Preliminary studies indicate that the temperature difference might be used as the basis for determining the relative seepage rates from different parts of a canal.
-14-Summary
The seepage rin s provide an accurate method of measuring seepage rates in small, isolated areas. For this study the seepage rings were used as a standard for the calibration of seepage
meters. Additional factors which affect seepage such as time, temper-ature and depth of water were also studied using the seepage rings. The study demonstrated the fact that there are many other factors besides the soil type which determine the seepage rate.
The calibration of seepage meters showed that although the meters do not provide an accurate method of measuring seepage, they do indicate the order of magnitude of the loss. For losses less than 1.0 foot per day the meters give a fairly accurate measurement but for for greater rates the meters definitely over-register. Care must be exercised in installing the meters since hammering or jarring the meter was likely to affect the results. It was found that a period of from two days to a week should elapse after the meters are installed before reliable readings could be obtained. The plastic bag seepage meter was the simplest type to operate and the results seemed to be reliable. It was concluded that seepage meter measurements must be made in the sides as well as the bottom of canals in order to obtain reliable estimates of seepage.
A method of analysis was developed for using the well
permeameter test results in forecasting the seepage from proposed canals. A further study of this method is needed before its use can be recommended.
-15-Studies of the effect of depth of water on seepage show that the rate increases as the depth increases but not in direct pro-portion to the increase in depth. For a high seepage rate, an increase in depth gave proportionally a greater increase in rate than that for a low rate.
The depth to ground water had a definite effect on the seepage rate. The tests showed that the seepage increased as the depth to ground water increased within the range of depths tested, except in a sandy material. The tests on sand showed that increasing the depth beyond one-foot did not further increase the seepage rate. At maximum depth to ground water (2.75 feet) the seepage rate was several times that when the ground water level was at the ground surface in the other types of soil.
In a number of tests it was found that the seepage rate is not a constant but may vary over wide ranges for periods of a few hours. In some cases, the highest seepage rates occurred at the lowest water temperatures and the lower rates at the higher temperatures. Since this phenomenon was contrary to present conceptions of the influence of the factors involved, a detailed study was made to determine the cause of the fluctuations. These studies, however, have not been successful in explaining the vari-ations.
Although a great deal has been learned about seepage as a result of this study, many questions still remain unanswered, and because of the economic importance of seepage losses, the study of the problem should be continued.
/
i _x
-.,
/
\
_1
i
)
(
(S.•, \\ \ 3' )---, x Hook Gage 1 CP - Gate Valve Float Valve? 14, -, i Compacted Earth Fill-) 1 Hook Gage -Variable Water SurfacePLAN
0
Float - 5/8" Rubber Hose
Valve __WaterMeter
16 Gauge Galvanized Iron r
ELEVATION AND SECTION
FIGURE I - SEEPAGE RINGS
61
Original _Ground Surface
40
0.0
Bellvue
Laboratory
Seepage
I
Rings
1950-51
Outer
Ring Seepage
Inner
1
Ring
Seep
Water off
,
Outer
•ge
PI
In
.r
Ring
Ring
Water
Depth
Water
Depth
0
10
20
30
40
Time—Weeks
Figure 2.-- Effect of elapsed time on the seepage rate.
50
60
70
2.0
t;
0
u..
a
1.5-c
Ii
C.) 01.0
co
0
0.5
80
0.
0.
4, 0.30
040
IL
0.10
0.00
4V9B1'4pag•
alter
.
V Maanni...IGILIEEENINWer 1,
Limn* Wit _
40...
0_0
_
0
1$
Tins -
Days
October. 1951
Figure 4,. Typleal example of results of mime meter and seepage ring tests for ths seas
period at the Dollen* Laboratory site.
5.0
4.0
2.0
1.0
0.7
0.4
0.2
0.1
.07
.04
.02
011 lc? 0 35 ' 88 o 39 , , , •38 9.Relationship of Seepage Rotes
Seepage Rings and Seepage Meters
,
35
NOTE:
Numbers on points represent the number of single determinations averaged to determine point.
1 I . 1 I Ill] ,
.01
.02
.04
.07 0.1
0.2
0.4
0.7 1.0
2.0
4.0
Seepage Meter Rate—Feet Per Day
Figure 5.-- Relationship of seepage rates from seepage rings and seepage meters.
Figure 6. -- Equipment for well permeameter test, North Poudre Supply Canal.
8
3
2
____
Legend
o
0
&
Note
North Poudre
Canal X-Section
Poudre Supply
All rates Corrected
60°F
Supply Canal
Canal
to
A
o
Q, .. 0) ''' q •0 (2) (2, b .) b 0• 4,
-r %7
v,
B
(1
eo r
eq Pc%
CIIVC)c, N e ° 62 1/4'.
/ / / / / / / / / / / / / / / / / / ///
/I:1
/
Relationship
0
•
/
/
/
/
/
/
/
,
/
A/
/
• ///
// /Relationship
from
and Well
of
Ponding
Permeameters
Seepage
Tests
-/
--/-/
Figure7.--2
3
4
Seepage - Ponding Ft/day
Relationship of seepage from ponding tests and well permeamaters.
2.0
1.8
1.6
1.4
0.6
0.4
0.2
0.0
,
0
,
.
,
V
V
.
V •
,
,
.
.
0
,
,
.
,
.
.
.
Legend
0 Levels
v Levels
0 Levels
ALevels
Note
Rates
Decreasing
Increasing
Decreasing
Increasing
Corrected
1950
1950
1951
1951
to 60°F
.
..
,
v.i1
•
,
fa A A • • A 4, 4 . It
a a i V T a a.
.Effect
Seepage
Outer
Bellvue
of Depth
Ring
-Sandy
I
on
Rate
Loam
I
.
0.0
.5
1.0
1.5
2.0
Seepage Rate Ft/ day
Figure 8.-- Effect of depth on seepage rate in sandy loam, outer ring, Bellvue Plot.
Concrete
3"
thick
Hook Gage
Vg N \ A \\\•• tr4--15
;
w
-I 21 Dia:
Soil Thermometer
NV/-re)
l" Pipe
SECTION
AA
II II 4 \-
=
"
Pipe
A
Figure 9.-- Details of seepage ring for study of effect of ground-water fluctuation on seepage rate.
4.0
3.0
2.0
,..
w w
o 2.0
010
ci)
010
cr
.
0
t
cr
2.0
1.0
o
Legend
0 Series
0 Series
ASeries
2
3
.
0
SANDY CLAY
.
,..4
,
.1
SANDY LOAM
. 10A
SAND
Effect
Elevation
Seepage
of Water
on
Rate
I
•
Table
1
0
0.5
1.0
1.5
2.0
2.5
Depth to Ground Water from Ground Surface
Figure 10.-- Effeot of water table elevation on eeepeze rata.
3.0
6.
5.
1.0
Well
North
I
Type
Poudre
Station
May
I
I
Permeameter
Supply
254+76
1951
Canal
nVO
I.
•
•
..
.
.
•
.
.
..
Water Temperature
.
.
.
..
Temperature
°F
4
CP
-
0
0
NJP
0
i
1
.
• •
.•
.
.
..
.
.
0..
.
.
..
_
Permeability
Corrected to 60°
F
• .
.
.
.
.• •• •
.
...
.
.
.
.
.
•.
80
100
Time-Hours
Figure 11.-- Effect of temperature on permeability, well permeameter test, North Poudre Supply Canal.
1.50
1.40
1.10
, Water Temp • • l b 411%• • / 1 1953 ;Y.-/ i --L4-1,"--'R.
Soil Temp. at 1 Ft. 1953, . • •• • Fl / / • aj9 -,-o- -74e;--°----0---0,, \--Cr •. 'CI„ • • • • Pi • - • -• -- - • • b. 1 -tik... a • ' • --13 / - -0 • 0 O' ' s • • • / • - 1 -Er•Water Temp • -Soil ? Temp at I Ft. • • 1952 . 1952 . .•.41\
• /./I
.
Seepage 1952 • • . ,. S. •. V19. U. • Seepage 53Legend
0
Sandy Loam 1952
.
a Sandy Loom 1953
_ Seepage Corrected for
Viscosity to 60°F
o )r- Avera9e Water Depth
o o a
Effect
of
Temperature
on Seepage Rate
Sandy Loam
I
I
I I 1 64 12N6P
64I2N
Time
64
I2N80
3
70 7"
0
60
2.0
1.0
0.0
'4d
-Lode°
Jemm
25.3
25.2 •_25.1
70
0
ci. . 60 oh" D X + 0.5 6- 0.0 0 •,s -0.5
t--5.0
3.0
1.5
...,________,...„„ --- /— Pressure Barometric \ Soil Temp.- I Ft. / /I \ N \ \ / / / / \ \ \ . \ \'\ Temp. Water- Bottom
\ I-Ft. Tensiometer
.
. \ \, \ Corr. and 10% for Vis. Air -m -i , Corrected ek L, Vis. and \ Air a for 15% A. . 41_ 4$0.1 N • \ :;', \ak _ • . :7 '0 \ , 7 ‘ , • • \ \ \ k V, \ a„ I It. ‘.. / . ' \ V \• P v . • \\ . 'A-• t,_,,,_ , '/ " • \ o Seepage for Viscosity / Corrected to 60°F. Mean Observed Seepageb,
-a Water Depth ••• • "v vl• ..a,` v v - - v •. . •A .... •... v.• . Average Depth . .Effect
1on Seepage
of Temperature
SAND
1953
1
Rate
,
1
1
6P 6A I2N 6P Aug. 13 1953Figure 13.-- Effect of temperature on seepage rate showing seepage corrected for viscosity and porosity.
6A I2N Aug. 12
6A I2N Aug. 14
CANAL SEEPAGE by
A. R. Robinson, J.M. ASCE; and Carl Rohwer, M. ASCE. Agricultural Research Service, USDA
Colorado Agricultural Experiment Station (Paper to be presented at San Diego Convention, ASCE, February 10, 1955)
Introduction
Of the water diverted for irrigation in the 17 Western States, it is estimated that 35,000,000 acre feet or about 40 percent is lost before it reaches the farms. On 46 operating projects con-structed by the U.S. Bureau of Reclamation it was determined that approximately 25 percent of the water was lost in transit. This loss consists of seepage, evaporation, transpiration and leakage. The water lost by seepage is by far the greatest of the losses. This seepage water is not only lost to the canal to which it is appropriated, but may also cause considerable damage to lands as a result of high water table conditions and excess salts in the soil. Although the water is lost.to the canal, it is not totally lost as a considerable amount may go to replenish ground water supplies or to increase the return flow to streams.
Methods of measuring seepage are necessary in order to deter-mine the magnitude of the losses and also to isolate reaches of canals where high losses are occurring. Water is becoming in-creasingly valuable and it is necessary to determine from an
economic standpoint whether the value of the water saved, the land reclaimed, and the savings in cost of operation and maintenance
-2-will exceed the cost of lining. It is also desirable to determine if a new canal should be lined before construction is started.
Many factors have a definite effect on the seepage rate, but the permeability of the material forming the bed of the canal is the most important one. Other factors which influence the seepage rate are: (1) the depth of water in the canal; (2) the length of time the canal has been in operation; (3) the depth to ground water; (4) the tempera-ture of the water and the soil; (5) the percentage of entrained air in the soil; (6) the soil moisture tension; (7) the salt content of the soil
or water and; (8) the silt carried by the canal. Biological factors and the barometric pressure may affect the seepage rate to greater or less degree depending on conditions. Since all these factors may act simultaneously and in some cases counteract each other, it is diffi-cult to segregate the effect of any one of them.
Various methods of measuring seepage have been devised which are adaptable for use in the field or in the laboratory. Some of these methods yield results which are the average seepage for a section of a canal, while others give the seepage rate for a small area, or merely furnish information as to the permeability of a sample of the canal bed material, either in its undisturbed state or in a crushed, screened, and compacted condition. Where methods are used that yield only the permeability, additional observation must be made to deter-mine the hydraulic gradient.
The principal method of measuring seepage now in use are:
(1) ponding; (2) inflow-outflow; (3) seepage meter; (4) well permeameter (5) laboratory permeability; and (6) special methods such as measuring