Does School Competition Matter?
Effects of a Large-Scale School Choice Reform on Student Performance *
Åsa Ahlin
**
Abstract
The effect of a general school choice reform on student performance is studied in a Swedish institutiona l setting. A rich set of individual level data allows estimation of a value added specification, mitigating problems with omission of relevant variables. Increased school competition is shown to have statistically significant positive effects on student performance in mathematics, but no significant effects in English and Swedish. Interacting school
competition with student characteristics, the results indicate that immigrant students and those in need of special education tend to gain more from increased school competition than others, while adverse effects on students from low education families are found in terms of English and Swedish performance. However, quantile regressions indicate homogeneous effects on low and high performing students.
Keywords : private school competition, school choice, student performance
JEL: H42, H52, I28, L19
_____________________________
* I am grateful to Sören Blomquist, Matz Dahlberg, Eva Johansson, Mikael Lindahl, Oskar Nordström Skans, Magnus Wikström and the seminar participants at Uppsala University for helpful comments and suggestions. ** Department of Economics, Uppsala University, Box 513, SE-751 20 Uppsala, Sweden, Fax: +46 18 471 1478, E-mail: asa.ahlin@nek.uu.se
1. Introduction
An issue of central concern in many countries is how to improve public school quality. The attention has to an increasingly extent turned from the role of school resources towards increased reliance on market mechanisms. Opportunities for students and parents to choose school constitute such a mechanism as long as school funding is linked to enrollment. Theory predicts that this will provide increased incentives for schools to improve – or adjust more closely to parents’ demand – the greater is the perceived degree of competition for students, since failure to attract students implies a loss of funds.
School vouchers links public funding to individual students, to be “spent” in the school of the student’s choice. Thereby, vouchers constitute a policy instrument through which the degree of school competition can be increased. There are several examples of voucher experiments (see, for example, Rouse (1998) on the Milwaukee case, and Mayer, Peterson, Myers, Tuttle & Howell (2002) on the privately funded voucher experiment in New York City). Other experiences of school choice include competitive pressures on public schools deriving either from parental mobility (Hoxby (2000)), open enrollment within a public school district (Cullen, Jacob & Levitt (2000)), or from privately funded private school alternatives (e.g. Hoxby (1994), Dee (1998) and Sander (1999)). However, since this type of empirical studies are concerned with school choice experiences which in different ways are limited in time or scope1, they cannot be used to infer whether the introduction of general, large-scale school choice possibilities will translate into better schools and improved student performance in line with the theoretical prediction. Other studies set up theoretical models of school and parental behaviour under different types of voucher schemes from which the potential effects from such voucher constructions are simulated (see, e.g., Nechyba (2000) and Epple & Romano (1988)).
The most important contribution of this paper is to provide empirical evidence on one of the most encompassing, general school choice measures undertaken – the Swedish national legislation on compulsory schooling. The Swedish case is of considerable interest for at least three reasons. First, by introducing the obligation for local gove rnments to provide
1 Typically, only a narrowly targeted group of children and schools are eligible for the vouchers, and the amount
does not necessarily cover the entire amount of private school tuition. Also, a temporary measure might not exert the same competitive pressures as a change in legislation which is likely to be permanent. The choice
possibilities provided by privately funded schools are generally limited by making enrollment dependent on, e.g., income (through the tuition) and in some cases to adherence to a certain religious denomination, while choice of residence is restricted by moving costs and income. Open enrollment within a public school system might exert a high degree of public school choice while choice of private schools remains restricted by the tuition and
public funding covering the per-pupil cost to any school of a student’s choice, it constitutes a truly extensive school choice measure. For private schools to be a real option to all students, irrespective of e.g. ability or family income, the legislation also entails restrictions regarding student selection and tuition in order to prevent ‘cream-skimming’ behaviour.2 In this important respect, the Swedish reform is more general in scope than the school choice reforms of Chile and New Zealand (see, e.g. Hsieh & Urquiola (2002) on the Chilean case, and Fiske & Ladd (2000) on New Zealand). Second, the reform introduced a dramatic change which makes identification easier. From an initial situation where all students were assigned to their ne ighbourhood public school and there were few private alternatives available, everyone got the opportunity to choose school – public or private – at the same time as the number of private school alternatives started to grow rapidly. In contrast to the U.S., the majority of private elementary schools are not of a religious denomination but compete for the same students as the public schools. Third, the general availability of school choice in Sweden makes it a suitable case for analysing whether there are heterogeneous effects of school competition, providing evidence on possible segregation effects. Thus, the Swedish experience should provide valuable information about the effects of introducing a broad-based school choice reform on student performance for any country discussing measures involving increased reliance on market mechanisms in schooling.
Two main questions are investigated in this paper. First, does a higher degree of school competition improve student performance in line with the theoretical prediction? Using the variation in the degree of school choice across local schooling markets
(municipalities) we investigate the average impact on student performance in three core subjects; mathematics, English and Swedish. Second, do the higher-performing students – or those with more advantageous family backgrounds in general – gain at the expense of more disadvantaged students as the main objection against school choice measures posits?3 This important issue is examined by using quantile regressions as well as a more traditional setup where school competition is interacted with student characteristics and family background. The rich set of individual level data, including student performance measures from two points in time as well as individual characteristics, family background and school
2 The same principles for determining which students to enrol are applied to public and private schools. Initially,
tuition was restricted to an amount considered ‘reasonable’ by the National Agency of Education. In 1997, the possibility to charge tuition was altogether abandoned.
3
Even if cream-skimming is to a large extent prevented, it could still be the case that the more motivated students tend to be the ones most inclined to actively choose school, or are the ones best informed about different school alternatives. This would result in increased sorting of students across schools in a way that could result in adverse peer group effects for the less motivated students, see e.g. Epple & Romano (1998).
history information, makes this study better equipped to deal with the important identification issues than, e.g., Sandström & Bergström (2002) who also study the Swedish case. In
particular, problems with bias from omitting relevant variables when estimating the effect on student performance is to a great extent mitigated through the use of a value added
specification. That is, controls for the students’ previous knowledge level are included in order to capture the accumulated impact from factors such as student ability and school quality experience from earlier grades. These otherwise difficult to measure influences on student performance are important to control for due to their possible impact also on the local degree of competition. Being able to do so, potential problems with endogenous school competition becomes less problematic as well. However, the potential for endogeneity is recognized and instrumental variables estimates are also provided. Selection bias is avoided simply by including private as well as public school students in the analysis. The results should thus be interpreted as the overall effect of competition – at least as important for policy evaluation purposes as the impact on public school students alone. If these average effects conceal any adverse impact on disadvantaged groups of students, this should be revealed by tests for heterogeneous effects.
The results suggest statistically significant overall gains from local school competition on student performance in mathematics, but no significant effects in English and Swedish. There is furthermore no evidence of heterogeneous effects for low and high
performing students. In general, this is also the case irrespective of whether we study immigrant or Swedish-born students, students with different family background or students with special educational needs. There are some exceptions, however; immigrant students (born outside the Nordic and EU countries) and those with special educational needs tend to gain more than others from a higher degree of local school competition in terms of math performance, while those from low education families tend to be somewhat adversely affected in terms of English and Swedish test performance. There is no evidence that endogeneity of local school competition constitutes a serious problem in the Swedish data.
The next section provides a background by broadly describing the institutional setting of the Swedish compulsory school system and the choice reform. Section 3 discusses the data, while section 4 focuses on identification issues and the empirical framework. Section 5 presents the estimated average effect and section 6 considers heterogeneous effects of school competition. The final section relates the results to findings in previous school choice studies and concludes. Appendix provides tests for whether the degree of local school
2. Background
2.1. The Swedish Institut ional Setting
Compulsory education in Sweden encompasses nine years of schooling, starting from age seven. Prior to 1991, school funding and decision- making was to a large extent centralized. The municipalities received targeted grants, and students were allocated to their
neighbourhood public school. Following a general trend of shifting responsibilities for publicly provided services to the local level during the 1980s, also the provision for compulsory schooling was decentralized in 1991. Since then, the teachers are municipal employees, and general grants have replaced the targeted ones. The system of general grants is constructed with the aim of equalizing differences in structural costs across municipalities. In order to avoid too disparate standards in compulsory education, there are centrally
determined goals in each subject. These are to be attained through the organizational
structures, resources and teaching methods that each local government and the local schools deem necessary.
Private schools have always been available but only to a limited extent. Although these schools received some public funding, they generally also charged tuition. During the 1980s, a private school was considered beneficial if it could complement the public ones, typically in terms of alternative pedagogical methods. Such schools were granted state funding, and were obliged to follow state regulations. By the end of the 1980s the share of compulsory school students attending private schools was less than one percent.
2.2. The Swedish School Choice Reform 4
The school choice reform and the ensuing public funding of private schools came into effect in the fall of 1992. It improved the financial prerequisites of private schools considerably and put them on a more equal footing to the public schools. Also, the decision to permit start- ups of private schools became a matter for the National Agency of Education (NAE) rather than the government, making it less of a political issue. The result can be described as a supply side shock. During the academic year 1990/91 only about 1.3 percent of all compulsory schools was private alternatives, located across only a few municipalities. In the academic year 2000/01 the share of private schools had increased to 8.4 percent (from 59 to 428 schools), now located across more than 50 percent of the municipalities. Furthermore, about
4
Miron (1993) provides an analysis of the background to and the legislation of the Swedish school choice reform.
70 percent of the municipalities had by this time compulsory school pupils that attended private school, locally or in another municipality. That is, even if there are no private schools in a given municipality, a certain degree of competition could still arise from schools in neighbouring areas.
As was mentioned above, the choice legislation entails a municipal per-pupil- grant to the school of a student’s choice. The principles for determining the amount is set by the national parliament and has been changed on several occasions. Initially, the legislation required municipalities to provide a private school with funds corresponding to at least 85 percent of per-student spending in the local public schools, based on the local average cost.5 Tuition was restricted for very specific purposes. In 1993, the municipality in which the pupil resides became obliged to provide the voucher amount irrespective of in which municipality the school of the student’s choice was located. Since 1997, there is no minimum level specified and private compulsory schools cannot charge any tuition. Instead, the municipal grant should be set in
negotiations between the municipality and the private school, on the same basis as funds are allocated between public schools in the municipality. As a result, different principles are used across municipalities for determining the amount of the school voucher.6
According to the School Act, the same rules for selecting pupils apply for public and private schools. The main criterion is that compulsory school is open to all. If entry to other schools than the local one is subject to availability, children living in the neighbourhood or having a sibling in the school must be given priority over others. A private school do not have to enroll a child with special educational needs if this would cause serious economic or organizational difficulties for the school. Likewise, the municipality is not obliged to compensate a private school that enrolls such children.
Permission to start a private school is given by The National Agency of Education (NAE), which also is responsible for checking that the schools comply with the regulations. The municipality in which the private school is to be located has the right to give the NAE its opinion on whether the start- up will seriously harm the public schools in the area. If they can show that such effects will occur, the NAE can deny the school permission, but the
5 In contrast to the public schools, the private ones were exempt from, e.g., value added tax and were not obliged
to provide school lunch free of charge etc. The minimum amount of 85 percent was however intended to be a floor, from which a higher amount could be negotiated, but the municipalities typically followed the 85 percent rule.
6
For example, some municipalities include compensation for value added tax, costs for pupils in need of extra resources and rental charges for the premises when defining the per pupil cost in local public schools, while others do not.
municipalities have no veto. Importantly, however, the municipalities’ opinions seem not to have influenced the NAE in its decisions in practice.
3. Data
The data used in this study consists of student panel data provided by Statistics Sweden and the Department of Education at Gothenburg University. This is combined with municipal level data from the National Agency of Education and Statistics Sweden. The individual level data is a stratified random sample of approximately 8,500 compulsory school students which were born in 1982 and attended third grade in the academic year 1991/92 across 34 randomly selected municipalities.7 It is a rich data set by containing information practically throughout the students’ time in compulsory school; from the third through the ninth grade. It includes test score data from the sixth and the ninth grade, individual characteristics and family background information, as well as information on the schools attended8 and courses taken, including special education due to e.g. learning disabilities. The municipal data consists of various structural characteristics but most importantly of the private compulsory school enrollment share, which make up the key explaining variable of interest. Summary statistics of the data are provided in appendix.
Four measures of student performance are used in this study. These are based on test score data which therefore warrants some further presentation. The ninth grade tests are national, compulsory tests taken during the ninth and final grade in the three core subjects; mathematics, English and Swedish. The purpose is to test the extent to which the students have achieved the goals in a specific subject as specified in the curriculum. These tests are marked and graded according to national guidelines. Therefore, the results from these tests should provide a good measure of a student’s true academic performance in contrast to simply the subject grade, since the latter is more easily subject to teacher subjectivity. Each test consists of several sub-tests. The overall test grade weights the results from each sub-test and is given in four steps. Since the test scores give more precise information about a student’s performance we use data on those sub-tests for which test scores are reported. These are parts A and B of the mathematics test, and part B of the English test.9 Test scores are, however, not
7
About ten percent of the originally sampled students were not able to or chose no to participate in the study.
8
By the time the students had reached the ninth grade, the schools they attended were located across 130 municipalities. About two percent of the students were then attending school in a municipality different than the one originally sampled.
9
Part A and B of the math test consist of various algebraic exercises. The English test, Part B, tests the students’ understanding of spoken and written English.
reported for any of the sub-tests in Swedish. Student performance in Swedish is therefore measured as the overall test grade. When interpreting the results it can be of interest to note that in the case of the mathematics test, part A is used as guidance for determining whether a passing grade has been obtained, while part B is used for distinguishing which of the higher grades is appropriate for the overall test grade.
The sixth grade test score data are based on tests designed by the Department of Education at Gothenburg University to measure this sample of students’ ability in
mathematics, linguistics and logic thinking. This information provides va luable controls for the students’ subsequent performance in the ninth grade tests. All national test data refers to the academic year 1997/98, while the sixth grade tests were given in 1994/95. For ease of interpretation and to relate the results of the different tests with different scaling, the test scores are translated into percentile ranking. Summary statistics of the data is provided in appendix.
4. Identification Issues
In this section we discuss the main issues that need to be tackled in order to empirically identify the effect of school competition on student performance. First, possible bias from omission of relevant variables is mitigated through the use of a value added specification in a way that is specified below. This approach provides the empirical framework for the analysis in this paper. This is followed by a section explaining how the key explanatory variable - the degree of school competition – is measured in this study. Second, the degree of school competition could be endogenous to student performance. This problem is discussed in a separate section below, whereas tests for endogeneity and in the Swedish data along with instrumental variables estimates are provided in appendix. Third, any selection bias caused by non-random sorting of students across schools is avoided simply by including private as well as public school students in the estimations; see e.g. Hseih & Urquiola (2002) who emphasize the importance of considering the selection problem when evaluating large-scale school reforms. Even if the productivity effect of increased competition cannot be separately identified from peer group effects under this setup, we will importantly get a sense of the overall impact. If increased competition causes substantial sorting of students across schools in a way that gives rise to adverse peer group effects on disadvantaged groups of students, this should be possible to identify through tests of the assumption that the school competition effect is equal for low- and high performing students. We leave this issue to section 6.
4.1. The Empirical Framework
Student performance at a particular point in time (t) is the result of a learning process influenced by various inputs accumulated T periods up to time t. Denoting student i ‘s performance with Yi , and assuming a linear education production function, we can specify
this in the following way;
(1) mT i i mT i mt i C Y =α1 +X α2 +ε
where C is the accumulated influence from school competition in the local schooling market m, where i attends school (public or private). Thus, our main interest is in the parameterα . 1 The vector X includes the accumulated influence from factors such as the student’s individual characteristics (e.g. innate abilities), her environment at home (family background) and at school (peer quality and school inputs). As usual, α is a vector of parameters to be 2 estimated, while ε is an error term.
Identifying α becomes problematic, however, in light of the fact that we need 1 to capture the accumulated inputs leading up to the student’s performance during ninth grade. Failing to account for relevant variables will bias our estimate if these are correlated with the degree of competitio n. This is likely to be the case, since factors such as ability, motivation, support from the family, and school quality experienced by the student during earlier grades might very well influence also private school location, and thereby α . However, with 1 information about the student’s performance prior to time t (say, at time t’) these problems are greatly mitigated.10 Such data will enable us to capture the student’s amount of knowledge accumulation – educational value added – thereby requiring controls in between t and t’ only. In this setting, the data requirements are reduced considerably. This is illustrated when defining the dependent variable in a value added sense:
(2) m t t i i t t m i t t m i C Y − = β − + − β2 + υ ' ' 1 ' ) ( ) ( ) ( X
An alternative formulation, corresponding approximately to (2) but having the advantage of being a less restricted specification, is to include student performance at time t’ as an
additional regressor;
10
(3) i t t m i t t m i mt i mt i Y C Y =ψ + β − + − β2 + ω ' ' 1 ' ) ( ) ( X
The set of student data used in this paper and described in section 3, allows for the value added specification (3) to be estimated. The results from running four versions of (3) - each based on different measures of the dependent variable - are reported in section 5. This specification also forms the basis for the regressions in section 6, but without assuming the key parameterβ1 to be equal for all individuals. This is in contrast to the typical approach in
many comparable studies – see for example Dee (1998), Sander (1999), and Sandström & Bergström (2002) who do not control for previous student performance or school history and, consequently, do not have the information to estimate (1) either. Instead, the following kind of specification is usually estimated, controlling only for inputs in the current period t :
(4) mt i i mt i mt i C Y = γ1 + X γ2 + ξ
Obviously, estimating the impact from school competition on the basis of (4) will give biased estimates due to omission of relevant variables. The direction of the bias is difficult to predict, however. In section 5, we will contrast the value added estimates given by (3) to those
obtained from specification (4) to investigate the extent to which the value added approach is important to consider when estimating the effect of school competition on student
performance.
When the dependent variable (Yimt) is defined as student i's performance on the
ninth grade mathematics tests, her results from the sixth grade mathematics test is used to control for her level of knowledge in math prior to the ninth grade ( mt'
i
Y ). In a similar manner, the sixth grade linguistics test scores are used as a control for the student’s ninth grade
performance in English as well as in Swedish. However, in all regressions also the two test results from the sixth grade that does not directly relate to the topic of the ninth grade test are used as controls for the students’ previous knowledge level. This is because the test in
linguistics, for example, could capture influences from previous school inputs that are important determinants also for the ninth grade math test results.
What is of primary interest is whether the degree of local school competition matters for how a student will perform in the core subjects. School inputs are a source of influence on student performance that is likely to also be affected by the degree of school
competition (through the decision on the municipal level of, e.g., teacher intensity, and on the school level of, e.g., choice of pedagogical methods). However, it is not the purpose of this paper to model the mechanisms through which school competition influences student
performance. Rather, we want to capture all such effects through β alone. Therefore, school 1 level variables are not included in X in the following regressions. Included in X is, instead, the education level of the student’s mother, a dummy for whether the student is a girl, whether she is born abroad, whether she has attended private school during the seve nth or eighth grade and whether she has been given special education due to learning disabilities during the seventh or eighth grade. The two last factors are included to take into account that we have controlled for the student’s knowledge level up to the sixth grade only, and therefore need to consider also her schooling history in between the sixth and the ninth grade.11
In addition, we need to take into account municipal heterogeneity. The average grades (over all subjects) of all students attending the final year of compulsory school in the municipality during the school year 1991/92 are included to consider local differences in school quality that is not due to school competition. If the composition of students stays roughly constant within municipalities during the relevant time period, this variable should be a good proxy of the local peer group quality and is, consequently, expected to have a positive effect on student performance in 1997/98. Per resident income is in a similar manner expected to be a positive determinant of student performance through its influence on the student’s school environment, whereas the population share with lower educational attainment
(corresponding to the compulsory schooling level) and the share of immigrants are expected to be negative in sign.
4.2 Measuring the Degree of School Competition
In this study, the local share of private school enrollment is employed as measurement of the degree of local school competition. The municipality is used as the relevant boundary for describing the local education market. Even if there might be several school districts within a municipality, it is the local government of the municipality that is responsible for the school organisation and the allocation of resources across local public services as well as across schools. Furthermore, we want to incorporate the possibility to choose school by choosing where to live, and the residential mobility between (but not within) municipalities is relatively
11
Ninth grade variables are not included due to the risk of endogeneity. However, the seventh and eighth grade variables should be good proxies also for the ninth grade.
low in Sweden.12 We should, however, take into account that a student has the possibility to attend a private school even if it is not located in the municipality where the student lives. Therefore, the local degree of private school competition is defined as the share of private school enrollment out of all compulsory school students residing in a municipality - irrespective of where they attend school. That is, competitive pressures could arise even without private schools in the municipality, as long as there are alternatives available in nearby areas.
Even though we want to explain student performance in the ninth grade, our school competition measure is based on all compulsory school students (grades 1-9) rather than on senior level students (grades 7-9, which usually are provided in the same school) alone. The reason for this is the following. The establishment of a private school offering grades 1-6 might affect senior level public schools through increased potential competition, since entry of private senior level alternatives is likely to become easier in the near future.
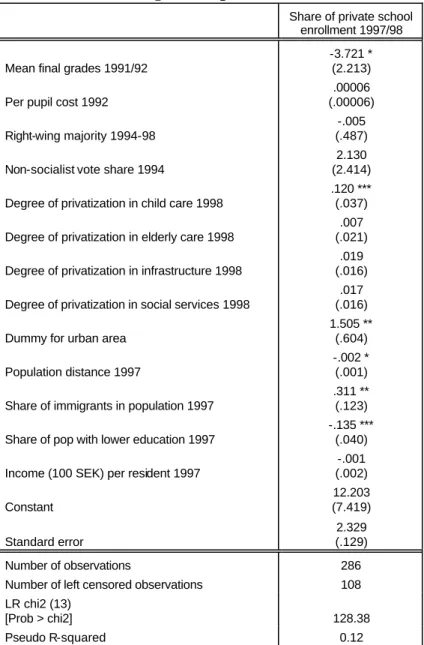
4.3. Is Private School Location Endogenous to Student Performance?
An identification problem which is emphasized in the empirical school choice literature is the possibility that the degree of private school competition is endogenous to public school quality. That is, an OLS estimate of our key parameterβ will be biased if there is some 1 aspect of student performance ( mt
i
Y ) that we fail to control for and that is correlated also with the degree of school competition through its impact on mt
i Y . That is, (5) m i m i m i m i C = ρω + Z λ +ν
whereωim is the unexplained variation of student performance from (3), Zim represents a vector of exogenous variables capturing local characteristics of municipality m in which student i attends school, and νim is an error term. If the demand for private schooling is higher in areas of low public school quality, and vice versa, we will find that ρ< 0. In such case, an OLS estimate ofβ will be biased downwards.1 13 Given that socio-economic status typically
12
Ahlin & Johansson (2000), for example, investigate whether sorting across municipalities on the basis of local public school expenditures was important in Sweden shortly prior to the choice reform (when residential mobility was the most important way of exercising school choice), but find no evidence of this.
13
A corresponding endogeneity problem arises when school choice originates from school district availability within a labor market area. In such case, OLS-estimates could be biased in any direction, see Hoxby (2000).
has a positive influence on student performance, high income areas will tend to be characterized by high quality public schools. At the same time, however, it is likely that parents with high income and education tend to have a higher preference for private
alternatives than others. If distinct, this latter effect could thus bias the OLS estimate in the opposite direction.
Furthermore, in the Swedish case there could be additional effects working in the opposite direction. As Sandström & Bergström (2002) also argue, it will be less profitable for private schools to enter municipalities with relatively many high-cost students (e.g. students taking Swedish as a second language or requiring special education), since tuition cannot be charged – at least if the municipal grant does not provide full compensation. As a consequence, we can expect to find a lower degree of private school competition in areas with low initial public school productivity. Thus, if the OLS estimates are biased due to the
endogeneity of private school location, we cannot predict the direction of the bias. The rich set of data used in this study enables us to control for important influences on student performance which also is likely to influence the degree of school competition. Thereby, the potential for endogeneity becomes less serious. Considering the emphasis on the endogeneity problem in the earlier empirical literature, however, we investigate the extent to which this is problematic also in the Swedish data. The results are reported and discussed in a separate section of the appendix.
5. The Average Effect of School Competition
The results from estimating the value added specification (3) with ordinary least squares when the dependent variable is student percentile ranking in the mathematics and English tests, and with ordered probit when student performance is measured as the overall grade in the Swedish test, are reported in Table 5.1 and 5.2. The robust standard errors are adjusted for possible clustering by ninth grade school, i.e. we allow for possible dependence between observations within schools. These results are contrasted against those obtained when estimating a
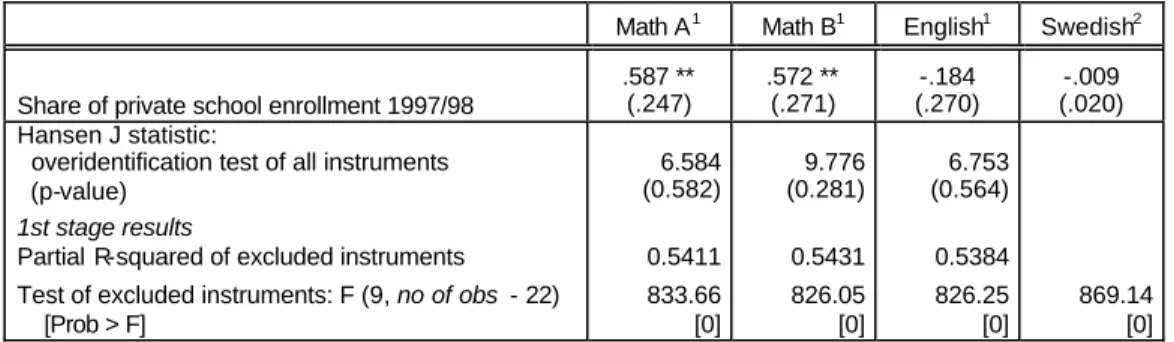
specification in which the students’ previous knowledge level and school history is not accounted for. The instrumental variables estimates are summarized in appendix.14
Starting with the key explanatory variable, we see that the estimates given by the value added specification indicate that an increase in the share of private school students by ten percentage points is associated with an improvement of mathematics performance
14
A discussion of the instrumental variable estimates is postponed to appendix, since we do not find indications of serious endogeneity problems in the Swedish data.
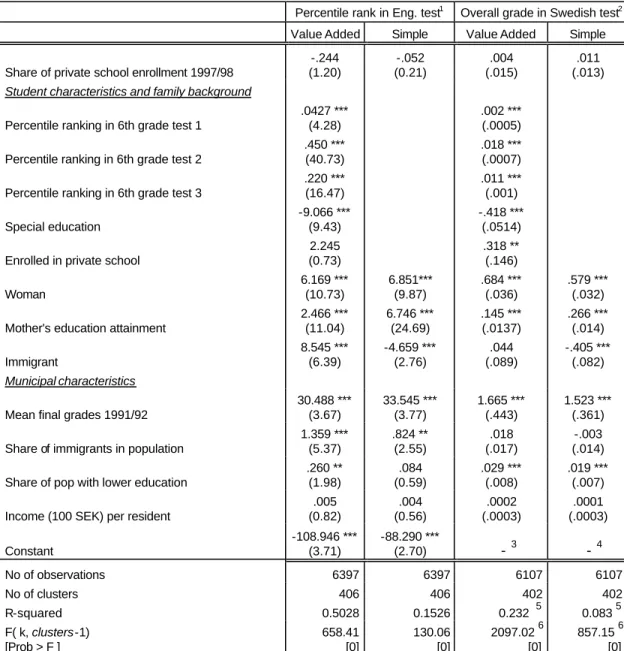
corresponding to about five percentiles in the test score distribution. This effect is statistically significant on a one and five percent level for sub-test A and B, respectively (Table 5.1). The corresponding overall effect on student performance in English is negative, but relatively small and statistically insignificant. Furthermore, increased competitive pressures do not seem to affect the probability of receiving a higher grade in the Swedish standardized test to an extent that is statistically significant (Table 5.2).
Table 5.1 Average Effect of School Competition on Student Performance in Mathematics: OLS Estimates
Percentile rank in Math test A Percentile rank in Math test B Value Added Simple Value Added Simple Share of private school enrollment 1997/98
.572 *** (2.99) .660 *** (2.62) .512 ** (2.28) .690 *** (2.67)
Student characteristics and family background Percentile ranking in 6th grade test 1
.135 *** (11.65)
.145 *** (13.67) Percentile ranking in 6th grade test 2
.199 *** (17.77)
.217 *** (18.01) Percentile ranking in 6th grade test 3
.459 *** (34.99) .422 *** (30.78) Special education -7.694 *** (9.10) -6.785 *** (6.93) Enrolled in private school
.002 (0.00) 5.012 ** (2.42) Woman -4.456 *** (8.85) -5.255 *** (7.55) 2.384 *** (4.43) 1.761 ** (2.56) Mother's education attainment
2.548 *** (12.81) 6.815 *** (25.89) 2.622 *** (11.73) 6.894 *** (25.68) Immigrant 1.629 (1.32) -9.200 *** (5.16) -.529 (0.38) -11.240 *** (6.42) Municipal characteristics
Mean final grades 1991/92
13.266** (2.08) 17.777 * (1.91) 21.420 ** (2.57) 26.371 *** (2.67) Share of immigrants in population
-.328 (1.35) -.397 (1.33) -.235 (0.70) -.397 (1.05) Share of pop with lower education
.274 ** (2.14) .0969 (0.60) .482 *** (3.33) .310 * (1.69) Income (100 SEK) per resident
.000 (0.01) -.000 (0.03) -.0001 (0.02) -.001 (0.16) Constant -43.678 * (1.79) -24.937 (0.72) -77.992 ** (2.54) -60.202 (1.59) No of observations 6386 6386 6277 6277 No of clusters 400 400 391 391 R-squared 0.5459 0.1358 0.5184 0.1321 F( 13, clusters-1) [Prob > F ] 622.31 [0] 107.33 [0] 534.66 [0] 111.54 [0]
Note: Absolute t-values in paranthesis. Robust standard errors based on the Huber-White-sandwich
estimator of variance and adjusted for clustering on ninth grade school.
Statistical significance on a ten percent level is denoted by (*), on a five percent level by (**), and a one percent level by (***).
Table 5.2 Average Effect of School Competition on Student Performance in English and Swedish: OLS and Ordered Probit Estimates
Percentile rank in Eng. test1 Overall grade in Swedish test2
Value Added Simple Value Added Simple Share of private school enrollment 1997/98
-.244 (1.20) -.052 (0.21) .004 (.015) .011 (.013)
Student characteristics and family background Percentile ranking in 6th grade test 1
.0427 *** (4.28)
.002 ***
(.0005) Percentile ranking in 6th grade test 2
.450 *** (40.73)
.018 ***
(.0007) Percentile ranking in 6th grade test 3
.220 *** (16.47) .011 *** (.001) Special education -9.066 *** (9.43) -.418 *** (.0514)
Enrolled in private school
2.245 (0.73) .318 ** (.146) Woman 6.169 *** (10.73) 6.851*** (9.87) .684 *** (.036) .579 *** (.032) Mother's education attainment
2.466 *** (11.04) 6.746 *** (24.69) .145 *** (.0137) .266 *** (.014) Immigrant 8.545 *** (6.39) -4.659 *** (2.76) .044 (.089) -.405 *** (.082) Municipal characteristics
Mean final grades 1991/92
30.488 *** (3.67) 33.545 *** (3.77) 1.665 *** (.443) 1.523 *** (.361) Share of immigrants in population
1.359 *** (5.37) .824 ** (2.55) .018 (.017) -.003 (.014) Share of pop with lower education
.260 ** (1.98) .084 (0.59) .029 *** (.008) .019 *** (.007) Income (100 SEK) per resident
.005 (0.82) .004 (0.56) .0002 (.0003) .0001 (.0003) Constant -108.946 *** (3.71) -88.290 *** (2.70) - 3 - 4 No of observations 6397 6397 6107 6107 No of clusters 406 406 402 402 R-squared 0.5028 0.1526 0.232 5 0.083 5 F( k, clusters-1) [Prob > F ] 658.41 [0] 130.06 [0] 2097.02 6 [0] 857.15 6 [0]
Note: Robust standard errors based on the Huber-White-sandwich estimator of variance and adjusted for
clustering on ninth grade school.
Statistical significance on a ten percent level is denoted by (*), on a five percent level by (**), and a one percent
level by (***).
1 Ordinary least squares estimates. Absolute t -values in paranthesis. 2 Ordered probit estimates. Standard errors in paranthesis.
3 The cutoff values are 6..362, 8.553, and 10.433. 4
The cutoff values are 4.751, 6.491, and 8.030.
5
Pseudo-R2 6
Wald chi2(13), and Wald chi2 (8), respectively.
What about the other explanatory variables? Keeping our attention to the value added specification, we can start by noting that the sixth grade test performance indicators
the ninth grade. Moreover, attending private school and special educational classes during the seventh or eighth grade typically affect ninth grade student performance in the expected direction and is, in the latter case, always statistically significant on a one percent level. The dummy for private school attendance is significant in a statistical sense only with respect to student achievement in Swedish and in sub-test B of mathematics, however. The educational attainment of the mother has throughout a statis tically significant positive impact on student performance, as do the dummy indicating whether the student is a woman except in the case of math test A.15 Somewhat surprisingly, the dummy indicating whether the student is born abroad does not show a statistically significant impact except with respect to student achievement in English, in which case it constitutes a positive influence. This is due to the value added specification; failure to control for student achievement and school experience prior to the ninth grade consistently indicates a rather large, negative effect of being born abroad. Also note that the estimated impact of the educational attainment of the mother typically is about three times larger in the simple specification relative to the value added specification. Turning to our indicators for municipal heterogeneity, the mean final grades in 1991/92 has throughout a significant impact, both in an economic and a statistical sense, while the contrary is the case for the local income parameter. A not expected result is that the estimated coefficient for the local population share with a low educational attainment
(compulsory schooling), which can be interpreted as an indicator of the school environment, is positive in sign and statistically significant in all cases where the value added specification is used. Finally, the local share of immigrants in the population does not affect student performance in a statistically significant way, other than for achievement in English in which case the effect is positive.
How important is it to use a value added specification? From both tables we have seen that a student’s previous knowledge level, measured as the performance on the sixth grade tests, and the school experience from the seventh and eighth grade are important to control for. Not taking this information into account, the estimated impact from an increase in the degree of school competition tends to exaggerate the estimated coefficient somewhat. A ten percentage point increase in local private school share now indicates a close to seven percentile improvement in math test scores, for example. As we have already noted, however,
15
All the estimates given by the two sub -tests in mathematics in Table 5.1 remain intact if we restrict the sample of students to be the same in the two regressions, in which case the total number of observations will be 6221 and the number of clusters (ninth grade schools) 389.
it seems to primarily affect the estimated impact from factors such as family background and immigrant status.
6. Heterogeneous effects of school competition
Arguments against school choice measures typically emphasize that increased student stratification along ability lines will occur. That is, those who actively use the choice
opportunity might tend to be children with a greater aptitude for studies, or those with parents that are particularly engaged in their schooling. If so, there is a risk that more disadvantaged children will be adversely affected by being left behind in schools that do not perform well in the competition for students, becoming subject to a ‘lower-quality’ peer group setting than before.
If this kind of sorting is important we should be able to discern this through differential effects of school competition on disadvantaged students and others. That is, we should expect our key parameterβ to differ across student types. We investigate this through 1 two approaches. First, quantile regressions are applied to estimate the effect of school
competition on students in different parts of the test score distribution, focusing on the 10th, 50th (median), and 90th percentile of test score performance in mathematics and English (i.e. our continuous dependent variables). Second, specification (3) is extended with a term reflecting the interaction of private school share and student characteristics. This is done as a test of whether the impact on specific groups of students that we typically are concerned about from a segregation perspective – immigrants, those with special educational needs and those with a low-education family background – differs from the average effect.
Table 6.1 Effects on the Distribution of Student Performance in Math and English: Quantile regression estimates
10th percentile Median 90th percentile Math A1 .583 ** (2.49) .424 *** (2.59) .638 ** (2.14) Math B 2 .441 ** (2.23) .457 *** (2.96) .580 *** (2.87) English 3 -.308 (1.23) -.250 (1.47) -.135 (0.71)
Note: Absolute t-values in parenthesis. Bootstrapped standard errors.
Statistical significance on a ten percent level is denoted by (*), on a five percent level by (**), and a one percent level by (***). All explanatory variables are the same as in Tables 5.1 and 5.2.
1
No of obs: 6386; .10 Pseudo R2 = 0.27; .50 Pseudo R2 = 0.39; .90 Pseudo R2 = 0.24
2
No of obs: 6277 .10 Pseudo R2 = 0.23; .50 Pseudo R2 = 0.36; .90 Pseudo R2 = 0.25
3
Let us begin with the quantile regressions. The basis for these estimations is still specification (3), but now we obtain estimates for the median student in the test score distribution by minimizing the residual sum of absolute deviations from the median of the residual. The effect on the 10th and 90th percentile student, respectively, is obtained in a corresponding manner. Thus, it would be consistent with the hypothesis that increased competition causes a wider dispersion in student performance ifβ1 is significantly smaller for lower- than for
higher-performing students. The results are reported in Tables 6.1 and 6.2. The standard errors are obtained through bootstrap simulations, based on 100 repetitions.16
Comparing the estimated coefficients that indicate the impact from increased school competition, they are very similar in magnitude across the distribution of test scores (Table 6.1). Furthermore, they do not differ much from the mean effect, i.e. from the OLS estimates in Tables 5.1 and 5.2. Are any of the differences in impact large enough to be statistically significant? The results from quantile regressions of the differences in coefficients between the 90th and the 10th percentiles, as well as between the 50th and 10th percentiles, are given in Table 6.2. These confirm that the effect from local variation in private school competition is rather homogenous for low and high performing students – there are no statistically significant differences. Only a few factors, such as gender, having attended special education classes and the local population share of immigrants (in one case), can be shown to have a significantly different impact.
Studying the effect on specific groups of students that are typically regarded as “at risk” of being left behind with a lower quality peer group, we simply extend specification (3) with an interaction term in the following way:
(6a) Yimt =ψYimt' + β1(Cim)t−t'+ (Xim)t−t'β2 +θ1Di*(Cim)t−t'+θ2Di + ωi
That is, if i belongs to the group of students that we are particularly concerned about – e.g. those with special educational needs – the dummy Di takes the value 1. Thus, the parameter
θ1 should be interpreted as the difference between the effect of school competition on
students with special educational needs and others. Thus, the hypothesis of interest is H1: θ1=0.
16
It could be the case, however, that the other covariates do not enter equally for the two groups of students as specification (6a) implicitly assumes. Therefore, a fully interacted model is estimated as well, allowing for differential effects of all covariates;
(6b) i t t m i i mt i i i t t m i i t t m i t t m i mt i mt i D Y D D C D C Y Y ϖ θ θ θ θ β β ψ + + + + + + + + = − − − − 4 ' ' 3 2 ' 1 2 ' ' 1 ' ) ( ) ( * ) ( ) ( X X
If we cannot reject the hypothesis H2: θ = 3 θ = 0 , 4
it implies that we cannot reject that specification (6a) is correct. Theresults are summarized in tables 6.3A-B.
Table 6.2 Quantile Regressions of the Difference between Percentiles
Math A Math B English
90th-10th pct 50th-10th pct 90th-10th pct 50th-10th pct 90th-10th pct 50th-10th pct
Share of private school enrollment 1997/98 .055 (0.18) -.159 (0.66) .140 (0.53) .016 (0.08) .173 (0.68) .059 (0.24) Student characteristics
Percentile ranking in 6th grade test 1
.005 (0.26) .034 ** (2.08) .036 * (1.94) .040 *** (2.72) .019 (0.96) .0222 (1.30) Percentile ranking in 6th grade test 2
.006 (0.28) .063 *** (3.75) .000 (0.01) .070 *** (3.66) .003 (0.11) .185 *** (8.12) Percentile ranking in 6th grade test 3
.008 (0.34) .173 *** (8.25) .022 (0.91) .174 *** (7.89) .026 (1.14) .072 *** (4.05) Special education -6.084 *** (3.97) -1.351 (1.17) -3.761 ** (2.14) -2.943 *** (2.61) -6.939 *** (3.93) -3.437 *** (2.77) Enrolled in private school
4.119 (0.80) -1.494 (0.48) -.994 (0.24) 2.753 (0.69) .142 (0.03) -2.730 (0.76) Woman .4229 (0.40) .798 (0.98) -1.896 ** (2.06) -.336 (0.47) .226 (0.22) 1.730 ** (2.10) Mother's education level
-.503 (1.24) .325 (1.02) -.254 (0.77) .378 (1.16) -1.051 ** (2.50) -.331 (1.02) Immigrant 2.164 (0.72) .331 (0.20) .132 (0.05) -.419 (0.23) -.306 (0.14) 3.892 ** (2.54) Municipal characteristics
Mean final grades 1991/92
-1.523 (0.15) -5.154 (0.65) 5.522 (0.75) 3.612 (0.60) 4.392 (0.44) -10.936 (1.40) Share of immigrants in population
-.126 (0.37) .141 (0.48) .343 (1.16) .212 (0.85) .256 (0.71) .417 (1.44) Share of pop with lower education
-.0490 (0.29) -.026 (0.18) .270 * (1.87) .206 ** (2.02) .053 (0.36) -.101 (0.72) Income (100 SEK) per resident
-.005 (0.70) .005 (0.90) .001 (0.20) .001 (0.12) -.009 (1.31) -.002 (0.33) Constant 63.160 * (1.75) 22.166 (0.74) 24.100 (0.85) -5.956 (0.26) 46.551 (1.33) 50.271 * (1.72) Number of obs 6386 6386 6277 6277 6397 6397 .90 Pseudo R2 0.2388 0.3865 0.2456 0.3648 0.2172 0.3456 .10 Pseudo R2 0.2675 0.2675 0.2325 0.2325 0.243 0.243
Statistical significance on a ten percent level is denoted by (*), on a five percent level by (**), and a one percent level by (***).
To start with, we can see that in the case of immigrant students born outside the EU and the Nordic countries, the interaction term for school competition is statistically significant on a five percent level with respect to mathematics (part A of the test). That is, the gain from increased school competition is significantly higher for this group of students than for others. For example, a ten percent increase in the degree of school competition corresponds to a further 9 percentile improvement in math test scores – almost twice the average impact. This result is confirmed by the fact that we cannot reject hypothesis H2 after estimating the fully interacted specification, i.e. we cannot reject that model (6a) is correctly specified in
assuming that all other covariates enter equally for the two groups of students. Immigrant students do also seem to gain from increased school competition with respect to the
probability of obtaining a higher grade in the Swedish test (Table 6.3B). This effect is about ten times as large as the average impact of an increased private school share on Swedish performance, but statistically significant at a ten percent level only.
From Table 6.3A we can also note that students having attended special educational classes during the seventh or eighth grade gain more than others from increased competition in terms of mathematics performance (part B of the test). This gain corresponds to a 5 percentile improvement in the test score distribution relative to other students when the share of private school students increases by ten percentage points. This result is statistically significant on a five percent level. Although this gain almost disappears when allowing for all other covariates to differ across student types (as indicated by the fully interacted model estimate), it is once again the case that we cannot reject the single interaction model.
However, for students whose mother’s educational attainment corresponds to the elementary schooling level there is a negative impact with respect to student performance in English as well as in the probability of receiving a higher overall test grade in Swedish. For example, a ten percentage point increase translates into a 6 percentile decrease in English test scores for this particular group of students. These findings are significant in a statistical sense on a one and five percent level, respectively. As before, the single interaction model is preferred to the fully interacted model.17
17
Defining the group of students as those with mothers whose educational attainment is 11 years or less, there are no longer any significant effects from school competition – neither in an economic nor in a statistical sense – on student performance.
Table 6.3A. Heterogenous Effects in Mathematics Across Student Types
Percentile ranking in Math, Test A Percentile ranking in Math, Test B
Single interaction (SI) model Fully interacted model Test of H0: SI-model correct F(11, 399) (p-value) Single interaction (SI) model Fully interacted model Test of H0: SI-model correct F(11, 390) (p-value)
Immigrant (born outside EU & Nordic countries) Priv school share * NONEU
.909 ** (.449) .716 (.761) 0.73 (.712) NR .352 (.499) .044 (.756) 0.70 (.735) NR Priv school share
.534 *** (.192) .536 *** (.194) .496 ** (.224) .492 ** (.224)
Special education during 7th or 8th grade Priv school share *SPEC
.238 (0.259) .218 (.544) 0.46 (.927) NR .574 ** (.291) .041 (.466) 1.08 (.376) NR Priv school share
.540 *** (.198) .553 *** (.206) .435 * (.227) .504 ** (.228)
Mother's level of education (elementary school) Priv school share * EDUE
.061 (.192) -.121 (.343) 1.00 (.443) NR .298 (.223) .014 (.368) 0.73 (.713) NR Priv school share
.535 *** (.198) .578 *** (.215) .436 * (.229) .490 * (.255)
Note: Robust standard errors in parenthesis based on the Huber-White sandwich estimator of variance and
corrected for clustering on ninth grade school. In addition to the specific dummies referring to student type (NONEU, SPEC and EDUE, respectively), the explaining variables are the same as in Tables 5.1 and 5.2, as are the number of observations and clusters.
Statistical significance on a ten percent level is denoted by (*), on a five percent level by (**), and a one percent level by (***).
Table 6.3B. Heterogeneous Effects in English and Swedish Across Student Types
Percentile ranking in English Overall test grade in Swedish
Single interaction (SI) model Fully interacted model Test of H0: SI-model correct F(11, 405) (p-value) Single interaction (SI) model Fully interacted model Test of H0: SI-model correct Chi2 (11) (Prob > Chi2)
Immigrant (born outside EU & Nordic countries) Priv school share * NONEU
-.236 (.468) .700 (.710) 2.14 (.017) R .053 * (.029) .081 (.050) 15.13 (.177) NR Priv school share
-.229 (.208) -.260 (.210) .004 (.015) .002 (.015)
Special education during 7th or 8th grade Priv school share *SPEC
.240 (.237) .050 (.408) 0.67 (.768) NR -.003 (.017) -.009 (.026) 15.22 (.173) NR Priv school share
-.279 (.207) -.265 (.213) .005 (.015) .005 (.015)
Mother's level of education (elementary school) Priv school share * EDUE
-.602 *** (.214) -1.026 *** (.330) 1.11 (.352) NR -.034 ** (.0139) -.034 (.023) 8.15 (.700) NR Priv school share
-.177 (.210) -.102 (.224) .009 (.015) .009 (.015)
Note: Robust standard errors in parenthesis based on the Huber-White sandwich estimator of variance and
corrected for clustering on ninth grade school. In addition to the specific dummies referring to student type (NONEU, SPEC and EDUE, respectively), the explaining variables are the same as in Tables 5.1 and 5.2, as are the number of observations and clusters. The results for the overall test grade in Swedish are ordered probit estimates.
Statistical significance on a ten percent level is denoted by (*), on a five percent level by (**), and a one percent level by (***).
7. Concluding Remarks: a Comparative Perspective
How does increased reliance on market mechanisms in schooling affect student performance? There is a relatively large literature devoted to this issue but yet little evidence on the effect of introducing a truly far-reaching, general school choice reform. The current paper contributes with such evidence by investiga ting the effect of school competition within the compulsory school system of Sweden with a rich set of individual level data. Although difficult to relate these results to the rest of the literature, taking into account the different institutional settings and the variety of outcome measures used across studies, we make an attempt to do so below.
Let us start by recapitulating this paper’s results concerning the average effect of school competition. A ten percent increase in the local share of private school enrollment has a statistically significant positive effect on student performance in mathematics,
corresponding to approximately one fifth (.17) of a standard deviation in math performance. This effect is of the same magnitude as a ten percentile increase in sixth grade math test scores, which improves ninth grade math achievement by close to a fifth of a standard deviation. There are, however, no significant effects of increased school competition on student performance in English or Swedish.
The positive effect on mathematics performance is largely in line with previous findings. For example, Hoxby (2000) shows that math and reading scores (as well as other school quality indicators) improves significantly from a higher degree of public school
competition arising from the availability of public school districts. Hoxby (1994) finds that an increase in the population share of Catholics that translates into a ten percent increase in the share of Catholic private school enrollment raises e.g. the armed fo rces qualifying test performance by two percentile points, as well as has a positive impact on a number of other school quality indicators. Dee (1999), using the same identification strategy as in Hoxby (1994), concludes that the public high school graduation rate is positively affected by intensified competition from privately funded private schools. However, Sander (1999) cannot find a statistically significant impact of increased private school competition on math test scores or other school quality measures. A common denominator of these studies is that, using US data, private school location as well as school district concentration shows clear signs of being endogenous to school quality. However, this does not seem to constitute a serious problem in the Swedish data as indicated by the municipal data analysis in appendix, and by the similar magnitude of the OLS and IV estimates.
Controlling for previous student performance, the results of Cullen et al. (2000) indicate that public school competition arising from open enrollment (measured as the
distance to a school other than the neighbourhood school) raises the probability of graduating high school for those who actively choose school relative to their otherwise equivalent peers. Using the experimental setup of the Milwaukee school voucher project, Rouse (1998) find that private voucher school students scores significantly higher on tests in mathematics – about 2 percentile points – than those eligible to attend but rejected by lottery. However, in terms of reading scores the evidence is inconclusive, showing both positive and negative effects. Another study based on experimental estimates is that of Angrist, Bettinger, Bloom, King & Kremer (2000), evaluating the Columbian voucher scheme. Also in this case, the students attending private schools as a result of being lottery winners (thereby gaining access to school vouchers) scored .2 standard deviations higher on standardized tests than the students who did not win a voucher.
Using Swedish data on public school students, Sandström & Bergström (2002) find that ninth grade math test scores increases with about one fifth (.19) of a standard
deviation when the local private school enrollment share increases by ten percent in their most preferred specificatio n (a Heckman selection specification in which private school
competition is assumed to be exogenous). 18 However, the estimates provided in section five of this paper improve upon those of Bergström & Sandström (2002) by controlling for student achievement and schooling experience prior to the ninth grade, and by using a less restricted specification. Another study of a general school choice reform is Hsieh & Urquiola (2002), focusing on the case of Chile. In line with this paper, these authors avoid problems with selection bias by incorporating also private school students in the analysis. Finding statistically insignificant, zero or negative effects of private school competition on overall student achievement they conclude that any productivity effects are dominated by adverse net effects from the peer group composition resulting from the “cream-skimming” behaviour of the private schools. That is, lower performing students tend to be left behind in the public schools and is adversely affected to an extent that is greater than the gain to the students that become subject to a higher-quality peer group.
If it is the case that private schools in Chile compete by selecting the best students rather than by raising productivity, as suggested by Hsieh & Urquiola (2002), it
18
They also estimate the effect on mean subject grades and the extent of failing grades as well as apply municipal panel data in a model with fixed effects. These results also indicate positive effects of increased competition from private schools.
should be kept in mind that the Swedish school choice opportunities are more general in scope through the requirement on private elementary schools to be open to all students. However, it could still be the case that the most motivated students tend to be the ones
actively exercising the opportunity to choose school. Such indications are given, for example, by the analysis of parental choice within the Chicago public school system by Cullen et al. (2000). At the same time, Cullen et al. (2000) do not find that the disadvantaged students become worse off by the gains of the more motivated students. In a similar vein, Hoxby (2000) finds that even though increased public school competition does increase sorting there is no evidence that disadvantaged groups of students lose from this.19 If learning externalities are important and a higher degree of school competition results in increased stratification of students along ability (or motivation) lines, the consequence could be adverse effects for the lower performing students that are left behind in a lower-quality peer group environment. If this is an important feature, we should be able to discern this by testing for differential impact of school competition on students in different parts of the test score distribution. Using
quantile regressions to investigate this important issue, we find rather homogenous effects, similar in magnitude to the average effect, on students in the 10th, 50th and 90th percentile of the performance distribution. That is, there is no significant difference in the impact of school competition on lower- and higher-performing students. Although this aspect probably should be the most essential one to consider from an equity perspective, concerns are also often raised about how disadvantaged groups of students will fare when school competition increases. Therefore, the quantile regression analysis is complemented with estimations of a model allowing school competition and student characteristics to interact. The results reported in section six indicate that in most cases, there are no significant differences across different groups of students. There are interesting exceptions, however. To begin with, immigrant students born outside the Nordic countries and the EU, as well as students requiring special education due to learning disabilities, gain significantly more from increased school
competition in terms of ninth grade mathematics achievement (in different sub-tests) than other students. This can also be noted with respect to Swedish test performance, but this effect is statistically significant only at a ten percent level. However, there are also indications in the opposite direction: in terms of English and Swedish test performance there is a negative effect of school competition on students whose mother’s level of education corresponds to the
19
Also, Fiske & Ladd (2000) conclude that increased school choice in New Zealand has resulted in a higher concentration of disadvantaged students in failing public schools. However, they do not quantify their results in terms of student performance.
elementary schooling level. The last mentioned effects are obviously not large enough to have a significant overall impact, since the average effect is small and statistically insignificant in linguistics performance.
What could explain the fact that we find significant positive overall effects on mathematics performance, but statistically insignificant effects on English and Swedish test performance? The quantile regression estimates indicate that the explanation is not differential effects across the test score distribution that cancels out the effect on net. A possible
explanation might simply be that in a more competitive environment, a higher priority is given to mathematics at the expense of other subjects such as English or Swedish.
The importance of the positive effects in terms of math performance will be easier to evaluate when data becomes available on the labor market performance of students who have been subject to a varying degree of school competition. At this stage, we might relate the cost of increasing local school competition by, say, ten percent to the cost of
achieving an impact of the same magnitude (improved math performance by about a fifth of a standard deviation) through, e.g., introducing smaller class sizes or increasing school
resources in other ways. From such a comparison, measures that increases the degree of school competition might well come out as the most cost-effective alternative, not least considering the lack of consensus in the literature about the effect of school resources on school quality, as illustrated by e.g. Hanushek (1986) and Card & Krueger (1992).
Interesting topics for future research would be to investigate more closely the mechanisms through which local school competition influences school quality. Also, as was mentioned above, the long-run impact of the school choice reform of Sweden ought to be studied when data on student performance in upper secondary school, university, and above all in the labor market becomes available for the generation of students that have experienced a competitive schooling environment.
References
Ahlin. Å., & Johansson, E. (2000). Demand for Local Public Schooling: Another Brick in the Wall. Working Paper No. 12. Department of Economics. Uppsala University.
Angrist, J., Bettinger, E., Bloom, E., King, E., & Kremer, M. (2001). Vouchers for Private Schooling in Colombia: Evidence from a Randomized Natural Experiment. Working Paper No. 8343. National Bureau of Economic Research.