Mälardalen University Press Dissertations No. 129
CHARACTERIZATION OF HOUSEHOLD
ENERGY CONSUMPTION IN SWEDEN
ENERGY SAVINGS POTENTIAL AND FEEDBACK APPROACHES
Iana Vassileva 2012
School of Sustainable Development of Society and Technology Mälardalen University Press Dissertations
No. 129
CHARACTERIZATION OF HOUSEHOLD
ENERGY CONSUMPTION IN SWEDEN
ENERGY SAVINGS POTENTIAL AND FEEDBACK APPROACHES
Iana Vassileva 2012
Copyright © Iana Vassileva, 2012 ISBN 978-91-7485-077-2
ISSN 1651-4238
Mälardalen University Press Dissertations No. 129
CHARACTERIZATION OF HOUSEHOLD ENERGY CONSUMPTION IN SWEDEN ENERGY SAVINGS POTENTIAL AND FEEDBACK APPROACHES
Iana Vassileva
Akademisk avhandling
som för avläggande av teknologie doktorsexamen i energi- och miljöteknik vid Akademin för hållbar samhälls- och teknikutveckling kommer att offentligen försvaras
onsdagen den 12 september 2012, 10.00 i Lambda, Mälardalens högskola, Västerås. Fakultetsopponent: professor Jenny Palm, Linköpings universitet
Akademin för hållbar samhälls- och teknikutveckling Mälardalen University Press Dissertations
No. 129
CHARACTERIZATION OF HOUSEHOLD ENERGY CONSUMPTION IN SWEDEN ENERGY SAVINGS POTENTIAL AND FEEDBACK APPROACHES
Iana Vassileva
Akademisk avhandling
som för avläggande av teknologie doktorsexamen i energi- och miljöteknik vid Akademin för hållbar samhälls- och teknikutveckling kommer att offentligen försvaras
onsdagen den 12 september 2012, 10.00 i Lambda, Mälardalens högskola, Västerås. Fakultetsopponent: professor Jenny Palm, Linköpings universitet
Abstract
Energy consumption is on a constant rise with domestic use contributing substantially to the overall consumption. The population growth along with ever increasing comfort levels and daily appliance usage are driving the domestic electricity demand to higher levels. Targeting domestic consumption is thus of great importance if global consumption is to be lowered. This involves understanding and changing consumers’ behaviour, awareness and increasing their knowledge on the subject of energy use. In this thesis various factors determining household energy consumption such as dwelling size, income and number of occupants have been found alongside consumer behaviour to influence consumption the most.
Energy awareness, related interest and knowledge have also been considered when trying to explain differences in household consumption patterns.
Despite all possible characteristics and factors, the largest differences in energy consumption are found between individual households.
Providing feedback and information to households has been proven effective when addressing the issue of reducing domestic energy use. In this thesis, the effectiveness of three of the most popular ways of currently delivering feedback and information on energy consumption (displays, websites and bills) have been investigated by analyzing consumption patterns before and after their implementation. Consumers living in apartments that followed their consumption through the web based feedback were the ones that achieved the greatest electricity reductions (17,5%) when compared to the years before the website.
In order to provide effective feedback, with long lasting results that would keep consumers interested, several parameters have been proposed to be included when developing feedback and information. The type of dwelling (house or apartment), the age of the occupants, their level of education, income and their energy awareness and interest are the main determinants of feedback preferences.
The findings presented in this thesis contribute to a better understanding of households’ energy consumption patterns closely related to their characteristics, behaviour, interest and awareness, and also provide ways of improving the development of consumption feedback and information.
ISBN 978-91-7485-077-2 ISSN 1651-4238
Characterization of household energy
consumption in Sweden
Energy savings potential and feedback
approaches
Abstract
Energy consumption is on a constant rise with domestic use contributing substantially to the overall consumption. The population growth along with ever increasing comfort levels and daily appliance usage are driving the do-mestic electricity demand to higher levels. Targeting dodo-mestic consumption is thus of great importance if global consumption is to be lowered. This in-volves understanding and changing consumers‟ behaviour, awareness and increasing their knowledge on the subject of energy use.
In this thesis various factors determining household energy consumption such as dwelling size, income and number of occupants have been found alongside consumer behaviour to influence consumption the most.
Energy awareness, related interest and knowledge have also been considered when trying to explain differences in household consumption patterns. Despite all possible characteristics and factors, the largest differences in en-ergy consumption are found between individual households.
Providing feedback and information to households has been proven effective when addressing the issue of reducing domestic energy use. In this thesis, the effectiveness of three of the most popular ways of currently delivering feedback and information on energy consumption (displays, websites and bills) have been investigated by analyzing consumption patterns before and after their implementation. Consumers living in apartments that followed their consumption through the web based feedback were the ones that achieved the greatest electricity reductions (17,5%) when compared to the years before the website.
In order to provide effective feedback, with long lasting results that would keep consumers interested, several parameters have been proposed to be in-cluded when developing feedback and information. The type of dwelling (house or apartment), the age of the occupants, their level of education, in-come and their energy awareness and interest are the main determinants of feedback preferences.
The findings presented in this thesis contribute to a better understanding of households‟ energy consumption patterns closely related to their characteris-tics, behaviour, interest and awareness, and also provide ways of improving the development of consumption feedback and information.
Sammanfattning
Energiförbrukningen ökar kontinuerligt över hela världen och energin som används i hushåll bidrar i allra högsta grad till den totala förbrukningen. Be-folkningstillväxt och högre krav på komfort är två anledningar till att an-vändningen av hushållsel ökar. Att fokusera på hushållens konsumtion av energi är därför av stor betydelse om den globala förbrukningen ska sänkas. Detta innebär att förstå och förändra konsumenternas beteende, att öka deras medvetenhet samt att förbättra deras kunskaper om energianvändning. I den här avhandlingen har flera faktorer som påverkar hushållens konsumt-ion av energi identifierats, såsom bostadsstorlek, inkomst och antalet bo-ende. För att förstå och bättre förklara skillnader i hushållens konsumtions-mönster har hänsyn tagits till energimedvetenhet, relaterade intressen och generella kunskaper om energi. Även när det finns likheter inom olika egen-skaper och faktorer finns det ändå stora skillnader i energiförbrukning mel-lan enskilda hushåll. Att ge återkoppling och information till hushållen om dess energikonsumtion har visat sig vara en effektiv metod när det gäller att minska energianvändningen. Effektiviteten av tre av de mest populära sätten att leverera återkoppling och information om energiförbrukning (displayer, webbplatser och räkningar) har undersökts genom att analysera konsumt-ionsmönster före och efter genomförandet av energiinformation. Konsumen-ter som bor i lägenheKonsumen-ter och samtidigt följde sin konsumtion via en webbase-rad tjänst var de som uppnått den största reduktionen i elkonsumtion (17,5%) jämfört med innan återkoppling av elförbrukningen lanserades. För att ge ef-fektiv återkoppling med långvariga resultat och för att bibehålla konsumen-ternas intresse är det viktigt att rätt verktyg används för återkopplingen av energiinformation. I avhandlingen presenteras hur olika parametrar påverkar konsumentens val av återkopplingsmetod. Typ av bostad, ålder, utbildnings-nivå, inkomst samt konsumenternas energimedvetenhet är de viktigaste fak-torerna som påverkar valet av återkoppling.
Resultaten som presenteras i den här avhandlingen bidrar till en bättre för-ståelse av hushållens energiförbrukning relativt de boendes egenskaper, be-teenden, intressen och medvetenhet. Vidare ger avhandlingen förslag på me-toder som kan förbättra utvecklingen av verktyg för återkoppling av och in-formation om energiförbrukning.
Acknowledgements
I am deeply thankful to my main supervisor, Prof. Erik Dahlquist for offer-ing me the possibility of workoffer-ing for interestoffer-ing projects and also for the support, encouragement, inspiration, patience and his always positive atti-tude over the years!
I too would like to thank my co-supervisors: Monica Odlare, who also helped me starting my PhD; Robert Öman, whose building experience helped me on many occasions; Fredrik Wallin, whose help and revision of my latest articles were very well appreciated!
Thank you to all of my colleagues from the HST department for making eve-ry day work at the University so easy and enjoyable! Special thanks to all the other PhD students who accompanied me at some point on this long journey! Most of my work was made possible thanks to the collaboration with com-panies such as Mimer, Mälarenergi, Eskilstuna Energi och Miljö, Eskilstuna Kommunfastighet, Logica, SUST, to name a few. Therefore I would like to thank all the people involved for all the help and data provided during the different stages of my work!
I would also like to thank my parents, Maria and Nikolay for their help and support, without which these 5 years would have been much harder! Thank you for all the ideas, knowledge and the passion for the world of science that you have given me during all my years of studying! My gratitude also goes to the rest of my family: my grandparents, cousins, aunt and uncle!
And last but not least, special thanks to Thomas, for being my friend and supportive partner and for bringing light into the long and dark Swedish win-ters!
List of Publications
This thesis is a comprehensive summary of the following papers, which are referred to in this thesis by their Roman numerals.
I.
Vassileva I., Dahlquist E. (2008). Economical savings through lowering energy consumption in rented apartments. A case study in Västerås area.Journal of Numerical and Applied Mathematics Vol. 1, (96):234–245.
II.
Vassileva I., Lundh M., Dahlquist E. (2009). Efficiency of interactivein-formation on energy consumption in households in Sweden. In
Proceed-ings of the International Conference on Applied Energy, January 5–7, Hong Kong.
III.
Vassileva I., Wallin F., Dahlquist E. (2012). Analytical comparison be-tween electricity consumption and behavior characteristics of Swedish households in rented apartments. Applied Energy, 90:182–188.IV.
Vassileva I., Wallin F., Dahlquist E. (2012). Understanding energycon-sumption behavior for future demand response strategy development.
Energy DOI: 10.1016/j.energy.2012.02.069.
V.
Vassileva I., Wallin F., Ding Y., Beigl M., Dahlquist E. (2011).House-hold indicators for developing innovative feedback technologies. In
Pro-ceedings of the Innovative Smart Grid Technologies (ISGT Europe). 2011 2nd IEEE PES International Conference and Exhibition on Innova-tive Smart Grid Technologies – Europe”, pp.1–7, 5–7 Dec.; doi: 10.1109/ISGTEurope.2011.6162715.
VI.
Vassileva I., Odlare M., Wallin F., Dahlquist E. (2012). The impact of consumers‟ feedback preferences on domestic electricity consumption.Author‟s contribution to the papers
Iana Vassileva contributed with ideas, methods, data collection and analysis and manuscripts preparation to all papers. Most of the ideas were discussed with Erik Dahlquist and Fredrik Wallin. The statistical analysis in Paper VI was provided by Monica Odlare.
Other publications not included in this thesis
I.
Vassileva I., Bartusch C., Dahlquist E. (2008). Differences inelectric-ity and hot water consumption in apartments of different sizes. In
Pro-ceeding of the Swedish National Energy Convention 2008 (Sveriges Energiting), 12–13 March, Stockholm, Sweden.
II.
Lundh M., Vassileva I., Dahlquist E., Wäckelgård E. (2008).Compar-ison between hot water measurements and modelled profiles for Swe-dish households. In Proceedings of Eurosun 2008, 7–10 October,
Lis-bon, Portugal.
III.
Vassileva I., Bartusch C., Wallin F., Dahlquist E. (2008). Asimula-tion model of the interacsimula-tions between power producers and custom-ers. SIMS 2008, 7–8 October, Oslo, Norway.
IV.
Widén J., Lundh M., Vassileva I., Dahlquist E., Ellegård K., Wäckel-gård E. (2009). Constructing load profiles for household electricity and hot water from time-use data-modeling approach and validation.Energy and Buildings, 41:753–768
V.
Vassileva I., Wallin F., Dahlquist E. (2009). Consumption patternstoday and tomorrow with respect to energy and how the energy sys-tem will be affected by this. In Proceedings for the Swedish National
Energy Convention 2009 (Sveriges Energiting), 11–12 March, Stock-holm, Sweden
VI.
Vassileva I., Dahlquist E. (2010). Analysis of the effects of individualpayment and tenants’ behaviour on electricity consumption. In
Pro-ceedings for the Swedish National Energy Convention 2010 (Sveriges Energiting), 17–18 March, Stockholm, Sweden
VII.
Vassileva I., Wallin F., Dahlquist E., Roots P. (2010). The relationbetween consumption of electricity and hot water and different con-sumer variables. In Proceedings for the Practicing Science and
Tech-nology, Performing the Social, 2–4 September Trento, Italy.
VIII.
Dahlquist E., Vassileva I., Wallin F., Thorin E., Yan J. (2011). Opti-mization of the energy system to achieve a national balance without fossil fuels. International Journal of Green Energy, 8:684–704.IX.
Dahlquist E., Vassileva I., Thorin E., Wallin F. (2011). How to saveenergy to reach a balance between production and consumption of heat, electricity and fuels for vehicles. In Proceedings for the
Interna-tional green Energy Conference, 5–9 June, Eskisehir, Turkey.
X.
Bartusch C., Wallin F., Odlare M., Vassileva I., Wester L. (2011). In-troducing a demand-based electricity distribution tariff in the residen-tial sector: Demand response and customer perception. Energy Policy, 39:5008–5025.XI.
Ding Y., Decker C., Vassileva I., Wallin F., Beigl M. (2011). A smartenergy system: distributed resource management, control and optimi-zation. In Proceedings for Innovative Smart Grid Technologies, 5–7
Table of Contents
Abstract ... i
Sammanfattning ...ii
Acknowledgements ... iii
List of Publications ... v
Author‟s contribution to the papers ... vi
Other publications not included in this thesis ... vi
List of Figures ... xi
List of Tables ... xi
Part I: Comprehensive summary ... 1
1 Introduction ... 3
1.1 Problem definition and research questions ... 4
1.2 Contribution of the thesis ... 5
1.3 Methodology ... 7
1.3.1 Papers evolution ... 7
1.3.2 Demographic group of interest ... 8
1.3.3 Questionnaire design ... 10
1.3.4 Software ... 10
2. Background ... 12
2.1 Electricity consumption ... 12
2.1.1 Electricity consumption in Europe ... 12
2.1.2 Electricity Consumption in Sweden ... 15
2.2 Smart grids ... 17
2.3 Current situation in Sweden ... 19
2.4 Previous research ... 20
3. Results and Discussion ... 23
3.1 Consumption: Trends and influencing Parameters ... 23
3.1.1 Seasonal, hourly and yearly variations ... 24
3.1.2 Socio-economic parameters influencing consumption ... 28
3.1.3 Behaviour and energy awareness ... 32
3.2 Information and feedback ... 37
3.2.1 Displays ... 39
3.2.3 Electricity bills ... 41
3.2.4 Conclusions about information and feedback ... 42
3.3 Conclusive discussion ... 43
4. Conclusions ... 45
References ... 49
Appendix I – Questionnaire ... 55
List of Figures
Figure 1. Representation of the main domestic energy consumption
interrelated features analyzed in this study. ... 5 Figure 2. Thesis and papers outline. ... 6 Figure 3. Final energy consumption by sector in 2009 [19]. ... 14 Figure 4. Total monthly electricity consumption for the apartments from
group I (N=19)... 25 Figure 5. Average hourly electricity consumption per apartment for the
month of January, 2006. ... 27 Figure 6. Average electricity consumption for year 2010 and confidence
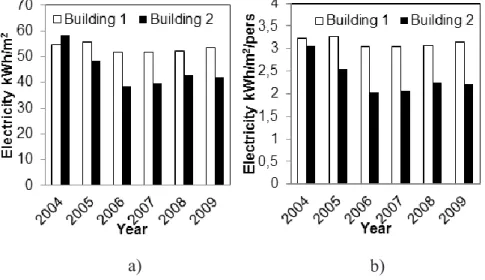
intervals for the different income-levels grouped houses from group III. ... 29 Figure 7. Average a) electricity and b) hot water consumption and
confidence intervals per group (N=8) of apartments from group I (N=24), for the years 2005 and 2006... 30 Figure 8. Total electricity consumption of 24 apartments (group I) for the
years 2005 and 2006, divided according their sizes. ... 30 Figure 9. Total annual electricity consumption a) per floor area and
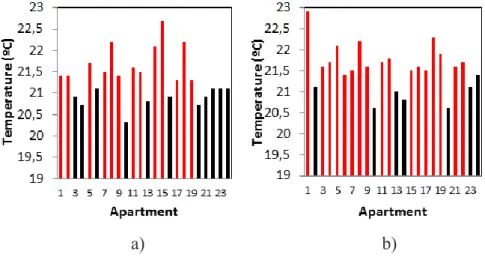
building and b) per floor area, person and building (group I). ... 31 Figure 10. Average indoor temperature from group I (N=24) during a)
January 2005 and b) January 2006 (red bars are for temperatures above 21°C). ... 33 Figure 11. Frequency of usage of domestic appliances in a) houses and b)
apartments. (WM= washing machine; DC =Drying closet; TD=Tumble drier; DW=Dishwasher). ... 35 Figure 12. Frequency of use of computers and TV/Videos/DVD per
household (N=19). ... 36
List of Tables
Table 1. Summary of characteristics of all households groups. ... 9 Table 2. Total electricity consumption and average temperatures in
Västerås for the month of January (2005-2009), group I (N=19). ... 25
1 Introduction
The increasing energy consumption is one of the most relevant concerns that current societies are facing. With incessant population growth, technological booming, development of societies which strive for having more and the best quality of everything, energy problems are inevitable.
The building sector alone is responsible for 40% of the total energy con-sumption in the European Union and is continuously expanding. In Sweden, the final use of electricity in 2009 reached 125 TWh of which the residential and services sector (formed by residential and commercial premises, holiday homes and land use) used 73 TWh. The total energy use in the sector was 149 TWh (residential buildings and commercial premises accounting for 87%) or 39% of Sweden‟s total final energy use. Therefore, households con-stitute one of the most important groups when addressing energy efficiency, policies and conservation measures in residential buildings.
However, despite all efforts (information campaigns, low energy consum-ing appliances and increasconsum-ing the energy efficiency) household energy con-sumption continues to increase. In Sweden, for instance, the household elec-tricity used for lighting and different electric appliances, has more than dou-bled between 1979 and 2006 (from 9.2 TWh to 22.1 TWh) [1].
One of the main reasons is the unavoidably increasing number of house-holds worldwide. Another explanation for many researchers is the higher household incomes and consequently the increase of the purchasing power of all income levels of society [2]–[6]. During the last decades a wide adop-tion of a variety of new household appliances and electronic equipment has occurred, changing consumers‟ overall routines and lifestyle and raising do-mestic electricity consumption.
Nevertheless, there are also several ways of reducing household energy con-sumption. Three of the main methods are mentioned by Wood and New-borough [7]: replacing the existing housing stock with low-energy buildings; promote use of low-energy domestic equipment; and finally, promote ener-gy-conscious behaviour among the consumers. While the first two would be very time and money consuming, changes in the behavioural patterns can save energy without additional investment in infrastructure and the effects would appear quickly [8]. In fact changing occupants‟ behaviour towards less energy usage already appeared in the mid-1970s probably related to the first oil crisis and it is described by Hayes and Cone [9].
Nowadays, with the introduction of smart meters, monitoring households‟ consumption has become easier also allowing the development of accurate and detailed information-feedback for the consumers.
1.1 Problem definition and research questions
Since domestic energy consumption is an important part of the worldwide total energy consumed, most of the scientific research, policies, legislation and technological developments are based on developing different energy saving measures. However,
There are no clearly established parameters to be used when assessing domestic energy consumption in order to acquire more knowledge on consumption and behavioural patterns.
Little research exists on how different feedback on energy consumption is accepted by the consumers and if it causes the expected effects (e.g. decreased consumption or increased consumers‟ energy awareness). When developing different ways of providing information or feedback to
the consumers, their preferences, knowledge and characteristics are not taken into account.
Therefore, the work included in this thesis could be summarized under the following four main research questions:
Question 1: Which are the main parameters affecting domestic energy consumption?
Question 2: How can households‟ energy consumption be reduced? Question 3: What are the effects of the installation of smart meters and
the provided information/feedback on the household consumption? Question 4: How feedback could be improved: what information should
it include and how should it be delivered to the consumers?
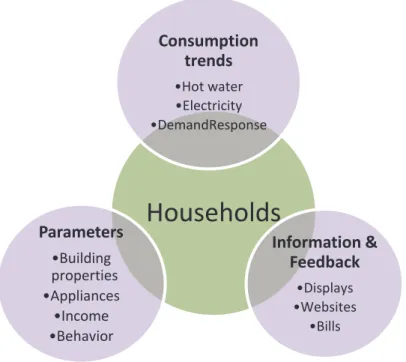
The aim of this thesis is to establish the importance of considering domestic energy consumption as a part of a complex system formed by diverse inter-connected components. The system has been illustrated in Figure 1. House-holds have been placed in the core since they are the ones stirring the con-sumption levels by their behaviour, awareness and characteristics. Therefore, in order to change the consumption trends, information and feedback have to be provided to the consumers and target changes in their behaviour, increase their energy awareness and only then energy savings would be achieved.
Figure 1. Representation of the main domestic energy consumption interrelated features analyzed in this thesis.
1.2 Contribution of the thesis
Despite all investigations on domestic energy done so far, there is a clear lack of a systematic analysis connecting the need for household energy sav-ings, people‟s behavioural characteristics, different saving strategies, appli-cable methods, types of consumption feedback and long lasting results lead-ing to the accomplishment of the targeted issues.
The above interrelations vary significantly depending on the country and region, but also mainly on individual households‟ characteristics. Closely re-lated to these problems are the following issues that have been addressed throughout this thesis:
For a full analysis of domestic energy consumption various factors have been proposed: consumers‟ energy related behaviour, awareness and households‟ type and structural characteristics. (PAPERS I, III and IV). The effects of providing direct feedback have been established through
analysis of hourly consumption patterns. (PAPER I and II).
In order to implement and design more efficient feedback and strategies it is important to analyze the determinants of household behaviour, ener-gy related awareness and current level of knowledge (PAPER III, VI).
Households
Consumption
trends
•Hot water •Electricity •DemandResponseInformation &
Feedback
•Displays •Websites •BillsParameters
•Building properties •Appliances •Income •Behavior Specific household characteristics that should be analyzed and included during the development of innovating technologies for providing feed-back, have been proposed (PAPER V).
The effectiveness of diverse types of feedback and different electricity payment methods have been determined through examination of house-hold consumption patterns and characteristics. (PAPER VI).
Different consumption trends and user profiles have been established (PAPERS III and VI).
The influence on consumers‟ behaviour of different ways of providing energy consumption feedback, tips and information and their effective-ness has been discussed (PAPER IV).
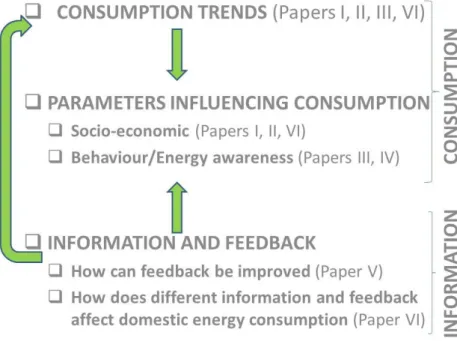
The connection between research questions and papers can be seen in Figure 2, which will also serve as an outline of the thesis.
Figure 2. Thesis and papers outline.
Domestic energy consumption trends have been investigated for different types of households in Sweden. The trends have first been analyzed from a “weather-time” perspective (seasonal, hourly, and yearly values) showing the importance of these variations. Further research has been carried out on the possible parameters influencing the consumption patterns (related to
households‟ characteristics, behaviour and energy awareness). Finally, the last part of the research is based on the description and improvement of in-formation feedback which is believed to cause a significant impact on the overall household energy consumption and would lead it to large savings.
1.3 Methodology
The proposed methodology for this thesis consists of collecting and analyz-ing hourly, daily, monthly and yearly energy consumption data sets (hot wa-ter and electricity) and indoor temperatures. In order to correlate socio-demographic characteristics and consumption data, user profiles were creat-ed to identify energy awareness and fecreat-edback preferences. To obtain the re-quired econometric information (user consumption patterns and feedback preferences), a questionnaire was designed and sent out to the demographic groups of interest.
1.3.1 Papers evolution
The purpose with the first paper was to estimate how much the selected 24 households were paying for their electricity and hot water based on a 2-year hourly consumption data. Low electricity prices were found to be the expla-nation for high electricity consumption in these households. It became nec-essary to determine if economic penalties might increase household energy awareness.
The aim of the second paper was thus to analyze this effect of economic penalties on energy awareness. The majority of the households in the study in-fact maintained their indoor temperatures regardless of the extra economic penalties which applied. These results lead to the foundation of the further research on consumer behaviour.
Paper III included the results from a questionnaire survey intending to justify the 6-year consumption patterns by behaviour, use of appliances, households‟ characteristics, level of education and so on.
In order to see if the findings could be generalized, a similar approach was adapted on a larger scale (2000 households) in Paper IV. Apart from in-tending to find common behavioural patterns another objective with the questionnaire sent out to 2000 households was to investigate the possible impact on consumption and behaviour after the introduction of web based feedback. In order to explain why some households did not visit the website, the investigation was directed towards finding common factors determining the preference for different types of feedback.
Paper V presents several indicators attributed to households‟ characteris-tics and preferences that are suggested to be used when developing future feedback and information.
The last paper aims at comparing the consumption patterns of three dif-ferent households groups which received information through difdif-ferent feed-back methods (website, bill, display). The information presented on a web-site resulted as the one that achieved the major electricity savings during the studied period.
1.3.2 Demographic group of interest
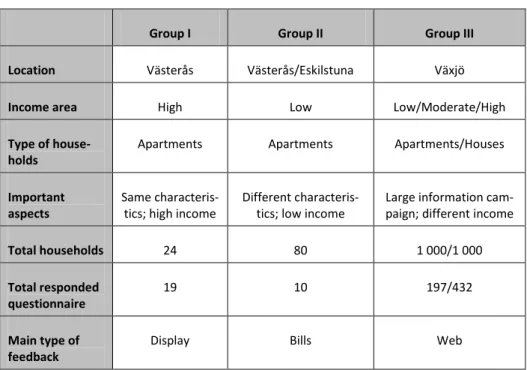
Three different groups of households with different socio-economic charac-teristics were selected, in order to obtain contrasting consumption patterns and econometric data correlations.
The first group was formed by 24 apartments from a high-income area in Västerås, Sweden. The group consisted of two multi-family houses (12 apartments each) built in 2001. This group had the following characteristics: Homogeneity: This first group had almost equal characteristics: same
number of occupants per apartment, no children, infrequent changes of the household owners and same building insulation. In this way the comparison of the different consumption patterns was highly dependent on personal energy usage rather than the households‟ characteristics. Advanced Metering Infrastructure (AMI): These apartments were
pro-vided with smart meters and hourly measurements of hot water and elec-tricity were available for 2+ years. Moreover, elecelec-tricity values were presented in small displays in each apartment, providing instant feed-back on consumption to the household members, helping increase their energy usage awareness.
Demand Response: A demand response scheme was implemented by penalizing the occupants with extra payment for each indoor temperature degree over 21 ºC. The traditional billing scheme required consumers to pay for their exact heating consumption.
The second group was formed by 80 apartments located in low-income areas in Västerås and Eskilstuna. This group had the following characteristics: Heterogeneity: Opposed to the first group, this one had contrasting
char-acteristics; different cultural backgrounds, occupant‟s age, family struc-ture and very varying household energy consumption data. The buildings containing these apartments were older than the ones from the previous group and did not have any major energy efficiency upgrades.
Lack of detailed metering infrastructure: The apartments from this group situated in Västerås, have never paid specifically for electricity con-sumption, since it was aggregated to their monthly rent. The ones located in Eskilstuna have been paying for their consumption every three months on estimation-based rates because the meter reading only occurred twice a year. This group started paying for their actual consumption in 2008, after the installation of smart meters.
The third and largest group of interest consisted of 2 000 households (1 000 houses and 1 000 apartments) located in the city of Växjö. The local power supplier provided them with a web based feedback on energy consumption.
The website was launched in 2008 accompanied by a large advertising campaign. The web based feedback was advertised in newspapers, televi-sion, radio, cinemas and the electricity bills. Houses and apartments were se-lected from random areas in the city although households in apartments were further divided into different groups according to their monthly income. For this group, only households with complete consumption values sets were used for analyzing consumption patterns.
Table 1. Summary of characteristics of all households groups.
Group I Group II Group III Location Västerås Västerås/Eskilstuna Växjö
Income area High Low Low/Moderate/High
Type of
house-holds Apartments Apartments Apartments/Houses Important
aspects Same characteris-tics; high income Different characteris-tics; low income Large information cam-paign; different income
Total households 24 80 1 000/1 000
Total responded
questionnaire 19 10 197/432 Main type of
1.3.3 Questionnaire design
A questionnaire was designed with the objective of obtaining behavioural patterns of different groups of households that were going to be studied as a whole. These questionnaires have had different structures and contained dif-ferent questions depending on the type of household they were addressed to (apartment or detached house), the purpose of the study and the location of the households (see Appendix).
This questionnaire based approach (also used in, [6], [8], [10]–[12]) was chosen to favor a higher relationship between what the respondents an-swered and reality. The work follows the hypothesis that many factors con-sidered together affect the final total energy consumption. There are two types of questions included in the survey: one includes a qualitative ap-proach, where respondents have to evaluate their behaviour, level of knowledge, etc. The other type of questions requires quantitative.
Other types of survey approaches such as time diaries, phone interviews or focus groups were considered, but found unsuitable for the present re-search, because even though they provide high-detailed behavioural data, on-ly do it for a very short time-span. The proposed methodology was aimed at analyzing a greater number of households with larger historical energy con-sumption data sets, in order to analyze concon-sumption patterns that could in-clude seasonal changes and temperature effects.
Furthermore, it is also considered that using less direct-personal observa-tion approach participants will not feel observed and the different behaviour due to the awareness of being observed, known as the Hawthorne effect (also mentioned in Wilhite and Ling, [13]) will be minimized.
1.3.4 Software
Several commercial software packages were used throughout the research process. For analysis and organization of the received data (consumption values and responses received from the questionnaires) Microsoft Excel was mainly used. For the scientific and statistical analysis of the thesis, more specialized software packages such as SigmaPlot, SPSS and The Unscram-bler were used. Significant effects between the different factors were evalu-ated by one-way ANOVA followed by Tukey‟s HSD multiple comparison test using the computer software package SPSS 19 (SPSS Inc., Chicago, IL, USA.). The Unscrambler (2011, CAMO Software) was used for performing PCA (Principal Component Analysis) in order to confirm the influence of income and other parameters on the households‟ final electricity consump-tion. The PCA analysis allows the study of all measured variable simultane-ously capturing the most important data set information in the first
compo-nents revealing patterns and structures not always revealed by classical sta-tistical methods.
2. Background
20 181 TWh of electricity were produced in the world in 2008; more than three times the electricity produced in 1973. 13 675 TWh, 67% of the total production, came from burning fossil fuels, contributing heavily on the over-all CO2 and greenhouse gases emissions [14].
Many different Directives, policies and research programs worldwide have targeted energy consumption reductions. The European Union, particu-larly, has been driving very important programs on energy efficiency, in-creased use of renewable energy and CO2 emissions. The associated
formu-lated policies have been based on competitiveness, sustainability and securi-ty of supply.
2.1 Electricity consumption
2.1.1 Electricity consumption in Europe
Europe contributed to 3 170 TWh of the electricity production in 2008; 54% from burning fossil fuels, but what is more important, most of these fuels were imported (83.5% oil and 64.2% gas), increasing the supply dependency of the European Union [15].
In order to overcome this and to mitigate the EU‟s impact on greenhouse gas emissions, it has been the leading party in many international negotia-tions regarding climate changes. Two of the most remarkable treaties are the United Nations Framework Convention on Climate Change (UNFCCC) in 1992 and the Kyoto Protocol in 1997.
The United Nations Framework Convention on Climate Change was cre-ated in order to “achieve, in accordance with the relevant provisions of the Convention, stabilization of greenhouse gas concentrations in the atmos-phere at a level that would prevent dangerous anthropogenic (originating in human activity) interference with the climate system” [16].
The governments of the countries that ratified the Convention are com-mitted to exchange information on their greenhouse gas emissions, national policies and practices. The governments are also responsible for introducing
different strategies limiting greenhouse gas emissions and preparing for the possible impacts originated from the climate change.
Linked to the Convention, the Kyoto Protocol is one of the major interna-tional agreements on committing the participating industrialized countries to reduce their greenhouse gas emissions. In order to reach the targeted emis-sion thresholds, the countries are conceded with three different types of mechanisms [17]:
Emissions trading: where countries with an excess of emission capacity sell emissions to countries without a surplus.
Joint implementation: enables countries to earn emission reduction units (ERUs) from an emission-reduction/removal project in another Kyoto participating country. The ERUs can be used towards meeting a coun-try's own Kyoto target. The ERUs are each equivalent to one tonne of CO2.
Clean development mechanism: is used by countries to obtain emission reduction credits by implementing emission-reduction projects in devel-oping countries. The first country is given certified emission credits, each equivalent to one tonne of CO2.
With regard to the Convention and the Kyoto Protocol, in 2009 the European Commission adopted the so called 20/20/20 Climate strategy. This climate package focuses mainly on emission cuts, renewable energy and energy effi-ciency. The policy targets a 20% cut in emissions of greenhouse gases by 2020 (with respect to 1990 levels); a 20% increase in the share of renewables in the countries‟ energy mix; and finally a 20% cut in energy consumption. In addition to the previously mentioned objectives, in the new strategy adopted by the European Council, in June 2010, energy, efficient use of re-sources and innovation are the main new areas complementary to the 20/20/20 targets.
In order to fulfill these targets, incentive mechanisms have been created decreasing the costs of the technical solutions, land and capital, including re-duction of the CO2 taxes, lower interest rates or simply reduced taxes.
Moreover many Directives originated by the European Union are trying to direct and encourage the transition towards more sustainable and efficient use of energy and the expansion of renewable energy sources in the residen-tial sector.
Additionally, the European Union is also striving to extend the use of en-ergy from renewable sources in the Directive 2009/28/EC. The Directive in-cludes legally binding national targets such as reaching the 20% of renewa-ble energy by the year 2020 and provides the countries with different help measures in order to achieve the targeted limits. The results show a positive trend, being the renewable energy 62% of the total energy generation
in-vestments in the EU during 2009. The European Union expects the increase of the use of renewable energy to reach 217 Mtoe by 2020 (gross final ener-gy consumption), 45% of which would be constituted by the electricity sec-tor [18].
In order to fulfill the 20/20/20 goals, increased use of renewables alone are not going to be enough to meet the EU´s consumption requirements, therefore the final use of energy in every sector must be more efficient.
Figure 3. Final energy consumption by sector in 2009 [19].
As presented in figure 3, households alone, account for more than a quarter of the EU‟s total energy consumption. If all the office buildings‟ energy con-sumption is included, the building sector accounts for 40% of the total ener-gy consumption in the Union. In order to reduce their enerener-gy footprint, a re-vised Directive concerning the Energy Performance of Building presented in 2010, established that from 2020 all new buildings must be close to zero en-ergy buildings [20].
There are differences between the EU Member States with regard to their targeted building energy efficiency levels. The Netherlands for instance, will try to reduce their energy consumption by 25% by 2011 and by 50% by 2015 (compared to previous standards) while in Sweden buildings are planned to be consuming 20% less energy by 2020 and 50% by 2050 (compared to 1990 levels).
Moreover, the methodologies for determining buildings‟ energy efficien-cy and the standards on the energy performance of new buildings have been compiled in the Directive 2002/91/EC on Energy Performance of Buildings [21]. Households; 27% Transport; 34% Services; 13% Agriculture; 2% Industry; 24%
In relation to the previously mentioned Directive and the improvement of energy efficiency, the Directive 2006/32/EC claims that “improved energy end-use efficiency will make it possible to exploit potential cost-effective energy savings in an economically efficient way”. The energy efficient use would consequently allow the Community to reduce its dependence on ener-gy imports and also to reduce CO2 and other greenhouse gas emissions. The
main aim of the Directive is to create stronger incentives for the demand side. The final consumers should be provided with information (comparative final consumer profiles, energy efficiency improvement measures, etc.) and should be encouraged to check their meter readings regularly. The Directive thus considers that energy efficiency improvement could be achieved by technological, behavioural and/or economic changes. [22].
2.1.2 Electricity Consumption in Sweden
Electricity consumption in Sweden was 138.3 TWh in 2009; 4% lower than the electricity consumed in 2008. The major consumption reduction was in the industrial sector, reducing its electricity use by nearly 12% - the lowest electricity use by the industrial sector since 1986 -. The sector involving res-idences, and services, however, increased its electricity consumption by nearly 3 percent to 71.3 TWh [23].
Moreover, Swedish local electricity production has also decreased: its production in 2009 was 133.7 TWh, 8% lower than in 2008. Hydropower fell by nearly 5% and total nuclear energy produced was only 50 TWh, 18% lower than in 2008 and the lowest since 1984. Wind power, however, showed an increase of 25%, to 2.5 TWh. Finally, conventional thermal gen-erating stations (and the most expensive ones) increased their production by 11% to 15.9 TWh. To compensate the production-consumption deficit, Swe-den had to purchase approximately 4.7 TWh for 2009. In 2008 SweSwe-den was a net exporter of 2 TWh.
These changes have affected the local electricity market and Sweden ex-perienced a considerable price increase in the electricity spot price. On Feb-ruary 22nd, 2010, at 8 am, the electricity spot price was 1400 EUR/MWh, about 25 times higher than the average price. During the rest of the year, the mean spot price in Sweden was 54.48 EUR/MWh, the highest annual mean price even recorded [24].
In 2009 a joint climate and energy policy was approved establishing targets and strategies for future development. Some of the targets include reaching the 50% of renewable sources of the total energy supply by 2020, in line with the previously mentioned EU Directive No. 2009/28/EC. A new 40% reduction in greenhouse gas emissions by 2020 in comparison with 1990 has also been established in the new policy. Regarding the use of energy in
resi-dential and commercial buildings, it must be reduced by 20% by 2020 and by 50% by 2050 in relation to 1995 level. Regarding the current situation of energy provided by renewable sources in Sweden, they amounted to 44.7% in 2009 (while in 1990 it was only 33.3%). The main contribution was made by electricity production of which a major proportion was provided by hydro power. Sweden is also the country with highest proportion of renewable en-ergy used in relation to final enen-ergy use when compared to the rest of coun-tries in the entire EU [23, 25].
Bearing in mind that the rate of new building in Sweden is only 1% of the total building stock per year, in 2006 the Agency started the so called Ener-gy, IT and Design program [26] focused on influencing consumers‟ every-day habits, values and behaviour. The program, intended to end by the end of 2012, is aiming at making it easier for the households to control their con-sumption while transforming the energy concon-sumption into a more efficient one. The targets would be achieved by the creation and design of different technical methods oriented towards changing end-users‟ behaviour.
The Swedish Energy Agency through this program considers that residen-tial energy consumption could be reduced by focusing the strategies towards three different areas: the building, the technical equipment in the buildings and buildings‟ users. However, highly efficient buildings do not assure that their occupants have the knowledge of how to use them.
Furthermore, in order to promote the most cost-effective production of re-newable electricity the Swedish Government in 2003 introduced the Green Electricity certificate. The Certificate is a market-based support system to assist expansion (by 25 TWh by 2020) of electricity production in Sweden from renewable sources and from peat. Its target defines the amount of new renewable electricity production that should be developed by a certain date [23]. Electricity certificates for every MWh of produced electricity is given to the producers and subsequently sold for an extra income in addition to the sale of electricity. This system has proved to be highly effective and there-fore, has been extended to 2030.
Another important step within the Swedish energy policy, was the deregu-lation of the electricity market in 1996 ensuring competition and consequent-ly lower prices. Household customers were given the opportunity to choose to sign contracts with whichever of the electricity suppliers connected to the grid. One of the next steps was the introduction in 2003 of monthly meter readings affecting 5.2 million customers. This system also ended an era characterized by payment for estimated values of electricity consumption, and electricity being included in the rent for some of the customers. One of the negative effects was the increase of the electricity prices. During the first ten years after the deregulation, a report from the Swedish Energy Markets Inspectorate states that the total electricity costs for a typical apartment household increased by more than 50% [27].
With increasing customers‟ participation in the power system and capaci-ty adjusting to changing demand conditions, the so called demand response has been on focus when aiming to reduce supply uncertainty and utilities‟ exposure to price risk. These reductions can be achieved by switching de-mand from peak to off-peak usage times or by generally lowering the total demand. Both utilities and consumers are required to follow several actions such as increasing energy efficient behaviours and changing the pricing sys-tems. Financial incentives and penalties are the main ways used to achieve lower seasonal and daily peaks although results have proven them not so ef-fective: in 2008 peak load reductions in European countries reached an aver-age of just 2.9%.
2.2 Smart grids
The basic architecture of today‟s electric grid has almost not changed since it was designed over 100 years ago. However, our current societies and econ-omies are in need of a 21st century grid to provide more cost effective,
effi-cient, reliable and cleaner electricity [28].
With the liberalization of the electricity systems in many countries, the access to transmission and distribution grids has become more accessible. Simultaneously, there has been a rapid increase in the development of re-newable energy technologies and co-generation and energy resources and storage. Consumers have been pressured to increase their participation in all energy related aspects, as end-users, power producers, and so on.
The introduction of smart grids has meant the integration and improved rela-tionship between power generation, transmission, distribution, consumers, markets and finally, service providers.
There are many different ways of defining „smart grids‟ and probably the most official one is given by the European Technology Platform: „electricity networks that can intelligently integrate the actions of all users connected to it – generators, consumers and those that do both – in order to efficiently de-liver sustainable, economic and secure electricity supplies‟ [29].
The main advantages with smart grids are the integrations of supplying power together with information and intelligence, by better planning and running existing electricity grids, increasing the energy efficiency and ena-bling new energy services.
From the consumers‟ point of view, which is of interest for the research in this thesis, the installation of smart meters is beneficial for providing infor-mation and options for choice of supply and allowing them to participate in the operating of the system. The provided bills will be based on real con-sumption and will be received more often. Historical data will be also
pro-vided with the bill allowing customer to compare their current consumption with the one from past years. Smart meters would entail other advantages such as: the possibility of installing micro generation measures; time sensi-tive pricing, allowing them to purchase electricity when costs are lower; and the possibility to reorganize consumption patterns in order to take advantage of time of use tariffs [30].
Another new term included in smart grids, connecting consumers and smart grids, is demand response. Demand response is primarily an electricity tariff or program created in order to increase the changes in households‟ electricity consumption, reducing the electricity used when market prices are high or with grid reliability problems. In this way, end-users become in-volved in a process that traditionally was a producer‟s responsibility. By changing their behaviour and routines, they can shift their electricity usage from peak to off-peak time periods, reducing network congestion.
The main benefits of demand response have been summarized by Kim and Shcherbakova [31]: lower risk of power interruptions from lower peak loads; improved operating conditions for utility firms from increased peak-time rates, reduced marginal costs of lower peak power quantities and ability to postpone infrastructure investment; cost savings for end users from a combination of reduced off-peak tariffs and a greater awareness of one‟s level and pattern of power consumption; increased spread of energy-efficient appliances; and a general increase in responsibility and prudence with regard to electricity use.
From all the European countries, Italy is the country that stands out for glob-ally leading the development of smart grids. By the end of 2009, around 85% of the Italian homes could monitor their consumption thanks to smart meters. The main driving force was the major utility in Italy, Enel. Already in 2001 Enel, started a 5-year project for installation of smart meters in 40 million homes and businesses. The utility‟s customers are given the possibility to have a greater control over their electricity bills and reduce them almost by half with only changing their habits from high peak (with high prices) to low peak periods [32].
However, a report elaborated by the International Energy Agency, states that despite all efforts and investments made the scale of demonstration and deployment coordination still has to be increased. The report concludes that collaboration between governments and private sectors is vital in order to achieve the goal of modernizing the electrical systems [33].
2.3 Current situation in Sweden
The results from all these reforms are still hard to evaluate and cannot be conclusive since the current period is of a transition and adaptation.
Regarding smart metering, there is a need for changing the current regula-tions and also the infrastructures used for data collection and the reporting of the measured values. The hourly based tariff prices have to be used and made understandable for the customers.
Regarding the deregulated electricity market, in Sweden the outcomes are being debated in different reports and have not been very positive. An evalu-ation of 1200 apartments and houses in Sweden showed that only 20% of the consumers see deregulation as something positive and 30% of the house-holds had switched electricity supplier during the last 5 years. The main rea-sons for not changing suppliers were mainly the costs (time) for searching for information to change electricity suppliers being too high [11].
In a later study carried out in the end of 2009, including 2 000 households (evaluated in Paper IV), occupants living in houses were more active when it comes to changing electricity supplier, 28.5% of the total changed it during the last four years, while only 15.5% of the occupants living in apartments changed it. On the other hand, from the total Swedish households, the num-bers can significantly vary among the different years. In 2008 the monthly average households that changed their supplier was 33 224; in 2009 it was 43 356 and 35 634 in 2010 [34]. One of the main explanations for these vari-ations could be the varying electricity prices, especially during the winter pe-riods. Time constraints, attention, resources and the ability to process infor-mation are considered important obstacles to reach higher consumer partici-pation.
Additionally, for most of the consumers, the introduction of smart meters, new ways of payment, large amount of not tailored information and the de-regulation of electricity markets have mainly translated into an increase of their electricity bills. This is partly occurring due to the lack of dynamic pricing designs and implementation even in countries with advanced meter-ing infrastructure already installed. On the other hand, the adoption of dy-namic tariffs would be very low if customers are the ones in charge of mak-ing the switch, rather than havmak-ing a dynamic tariff as the default [35]. Higher adoption of dynamic tariffs could be achieved by increasing customer partic-ipation, stressing out the environmental benefits and financial rewards and offering them a lower flat tariff in return for choosing an automatic demand response.
What is clear is that more attention needs to be paid to making customers understand how crucial their participation in the energy system is and to
in-form them about the consequences that their every-day practices have from the global energy perspective.
Therefore, it is of great importance, to first better understand households‟ consumption patterns, to try to develop different information techniques, policies and other regulations and to consider the end-users‟ preferences and interests in order to achieve great energy savings.
The integration of all these matters (households‟ consumption patterns, interests, knowledge, preferences and reactions towards different feedback) are included in the following sections of this thesis.
2.4 Previous research
If the increased blackouts during peak-time and the unreliability of the elec-tricity supply characterized the conventional grid used in the past century, the customer-side constitutes one of the cores of the smart grids. Consumers are expected to make more informed decisions, to increase their participation in the electricity market and to generally change their behaviour and adapt to new pricing systems, policies and perhaps the automated use of some of their appliances.
While most of the focus relied on hardware upgrades of the grid, soft-ware, control systems and policies are still in progress [36]. Reports and studies started addressing the consumers‟ side only a few years ago. The most cited ones could be divided into two groups according their main ob-jectives: energy consumption patterns and different types of feedback. Within the first group, Sardianou, analyzed the energy conservation in 500 Greek households using face-to-face interviews with one adult from each household [37]. The author determined that the energy-saver consumer has a high income, owns the house and is a member of an extended family core. On the other hand, the number of rooms, size of the dwelling, the sex, educa-tional level and marital status cannot be predictors of energy conserving be-haviour.
Ndiaye and Gabriel, conducted a similar study in Canada including 221 phone surveys and 1-year electricity consumption data [38]. Amongst the 60 variables that were included in their principal component analysis, the num-ber of occupants, the home ownership and the vocational period were select-ed as the main energy consumption prselect-edictors.
In Sweden, Ek and Söderholm, analyzed 564 questionnaires concluding that price incentives, information and environmental moral concerns are necessary to promote less electricity use [10].
Research should also focus on people‟s day-to-day actions and how they vary depending on physical, economic and moral-based contexts. On the
other hand, a more recent study, performed by the University of Gothenburg, used data of 4 000 Swedish households collected by the Society, Opinion and Media Institute for studying patters of energy savings [39]. The most prominent socio-economic factors affecting energy consumption were found to be: age, housing type and household income. The authors found that envi-ronment-related attitudes had weaker effects on saving energy in owner-occupied detached houses. Homeowners seemed to react better to economic incentives. Households with higher incomes and living in non-detached houses (and apartments) were more sensitive to environmental attitudes. The study recommends that policy measures should be tailored to fit household preferences depending on income and housing forms.
A number of researchers point out that behaviour (as the action taken by the households in their use of energy at home) plays a major role in deter-mining energy consumption [40]–[43]. It seems therefore logical to target different behavioural aspects when attempting to increase energy awareness and savings. This could be mainly achieved by providing feedback and in-formation. These tools would also make the electricity more visible, espe-cially important in countries like Sweden, where until recently many house-holds had their energy consumption included in their rent.
In one of the most cited reports where energy saving through feedback has been analyzed, it is concluded that direct feedback (in-home displays) could save up to 15% electricity, while indirect feedback (bills) would only achieve reductions of 10% [44].
In another report, written by Fischer [45], where 21 original studies were analyzed, from 10 different countries, savings achieved about 20%, alt-hough, depending on the nature and frequency of the feedback. Providing the households with a frequent feedback and over a long period improves its ef-fectiveness. The author concludes also that the information has to be pre-sented in a clear and appealing way, preferably by interactive tools.
The effects of direct feedback was also analyzed Hargreaves at al., in 12 households in the UK [46]. The authors found out that the monitors needed to look good to fit in with the wider household and also that the information they provide needed to be clear, transparent and flexible. In some of the ana-lyzed cases, the devices were giving the participants sense of control and empowering them to take stronger action to reduce their consumption, to discuss energy issues with their family and friends and to seek further infor-mation and tips.
However, very few authors consider the preferences of the consumers when it comes to receiving feedback and the type of information they want to receive. In a recent study, Karjalainen [47] presented different information prototypes to 14 households in Finland. After interviewing them, the conclu-sions he obtained were that people preferred visualizing the costs of their consumption and also presented in kWh instead of simply the power (W);
the appliances specific breakdown was also important in order to understand the amount of electricity consumed by the different appliances; and finally, a historical comparison of the consumption was also preferred by the consum-ers. Similar results were obtained in the UK, after examining 240 question-naires regarding householders‟ awareness of energy issues, attitudes to ener-gy savings and enerener-gy behaviour in general. 73% of the consumers consid-ered that better information should be provided by the utilities when it comes to the energy consumed by the different appliances. Also the most preferred ways for receiving such information were the energy bills and the newspa-pers (chosen by 35% and 25% of the participants, respectively) [43].
After reviewing the previously mentioned reports and many other research papers, several gaps have been found between the different approaches tak-en. Very few authors have analyzed the effects of different types of provided feedback on the actual electricity consumption (followed up for several bill-ing periods after the introduction of the feedback). Just a limited number of authors have combined consumption-related behavioural patterns, energy consumption and the provided feedback.
Moreover, there is not much information available on consumer‟s prefer-ences regarding types of information and desired energy usage visualization formats.
All these issues are considered throughout this thesis and are essential for further policy development in the public sector and increased consumers‟ awareness and control over their energy consumption; a very important topic for utilities interested in deploying large-scale demand-response. Also, In order to design appropriate demand response programs, accurate energy de-mand-consumption models should be developed to simulate different house-hold scenarios. This can only be achieved by further understanding consum-er‟s behaviours and preferences in order to have a deeper understanding of the smart grids‟ performance with the consumer as the “smart” component of it.
3. Results and Discussion
Household energy consumption is affected by many different factors such as building and appliances efficiency, location, occupants‟ behaviour and so-cio-demographical characteristics (income, age, occupancy patterns, etc.). In this thesis research has been directed at analyzing the relation between these factors and energy consumption patterns investigated in the first place.
Additionally, domestic energy consumption and some of the previously mentioned factors (as the type and use of appliances) could be modified by changing occupants‟ behaviour, decisions and daily routines. Different be-haviour modifications techniques have been found to achieve energy reduc-tions by 10 – 30% [48, 44]. Therefore, in the second part of this section, the effectiveness of several ways of providing feedback have been evaluated and different ways of improving consumption feedback in the future have been proposed.
The Results and Discussion part of the thesis has been divided into two main sections (following the outline presented in Figure 2):
3.1 Domestic energy consumption patterns and influencing parameters 3.2 Information and Feedback
These two sections are followed by: 3.3 Conclusive Discussion
3.1 Consumption: Trends and influencing Parameters
(Papers I, II, III and VI)
Analyzing electricity consumption patterns (magnitude and time of peak loads) constitutes an important part of a better planning of the electrical grids. Investigating domestic energy consumption would also be necessary for the improvement of forthcoming information, feedback and policies.
Many different factors affect the final household energy consumption. In the beginning of this work attention was mainly paid to non-behavioural
consumption analysis. Therefore the first part of the thesis tries to answer: which are the household characteristics that influence consumption the most?
Throughout this thesis, electricity and hot water hourly measurements were collected and analyzed for different periods of time: daily consumption (weekdays and weekends) would give us more information on peoples‟ daily routines; monthly data is used in order to find seasonal variation and yearly consumption is used for investigating how households‟ consumption varies in a more global perspective.
Furthermore, several households‟ characteristics (size, number of occu-pants and the monthly income) were related to the consumption pattern anal-ysis in order to observe their effects on the final consumption.
With the help of questionnaires, occupants‟ behaviour and energy aware-ness were included in the investigations in order to explain the consumption variations that could not be explained by the non-behavioural characteristics.
3.1.1 Seasonal, hourly and yearly variations
(Papers I, II, III, VI)
Seasonal changes in the domestic energy consumption are common in the Nordic countries and have been reported by many authors [49, 7]. Electricity consumption is usually higher during the winter in comparison to the sum-mer period, especially in countries that, as Sweden is, are characterized by long and dark winters.
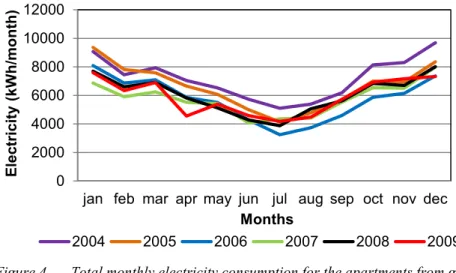
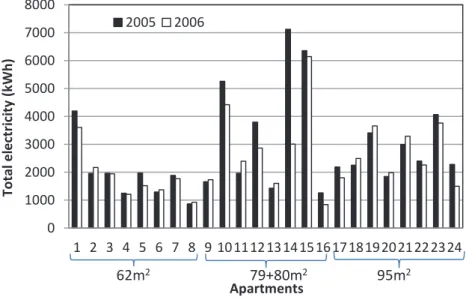
Seasonal variations of domestic electricity consumption for a long period of time have been analyzed in Paper III and are presented in Figure 4. The total electricity consumption per month for 19 apartments from group I for a six-year period, shows overall stable levels with approximately 2 500 kWh of difference between some of the years.
Figure 4. Total monthly electricity consumption for the apartments from group I (N=19).
The results showed large differences between summers and winters, reach-ing up to 5 000 kWh difference in the year 2006 for instance. Such large fluctuations demonstrate the necessity of adding specific tips about winter savings to the information/feedback given to the occupants.
On the other hand, the total electricity consumption during the month of January for the 5-year period has been further compared to the average tem-perature for the same period finding no relevant effects of outdoor tempera-ture on the consumption (Table 2).
Table 2. Total electricity consumption and average temperatures in Västerås for the month of January (2005-2009), group I (N=19).
Year Electricity
(kWh/month) Outdoor Temperature- January (ºC)
2005 9 365 0,47
2006 8 095 -4
2007 6 866 -0.9
2008 7 697 1.7
2009 7 598 -2.3
The fact that the highest consumption level was reached in a year which Jan-uary‟s average temperature was not the lowest of the period investigated in-dicates that the outdoor temperature is not the only driving parameter of
0 2000 4000 6000 8000 10000 12000
jan feb mar apr may jun jul aug sep oct nov dec
Elec tr ici ty (kW h/mo nt h) Months 2004 2005 2006 2007 2008 2009
electricity consumption during the winter. The observed seasonal differences however, are mainly explained by the fact that occupants spend more time at home during the winter, and consequently use their appliances and lighting for longer periods of time.
Similar results have been obtained when analyzing hot water consumption levels: lowest consumption was reached in July for years 2008 and 2009. Relatively higher measurements were recorded during the year 2008 espe-cially during the cold months (October-February). If related to weather con-ditions, according to an analysis of the outdoor temperatures recorded by the Swedish Meteorological Center, the temperatures during 2008 were 14% higher than a normal year. Therefore, it could be concluded that there is no clear effect of the outdoor temperatures on the household tap hot water con-sumption.
In conclusion, this part of the study shows that there is no direct influence of outdoor temperatures on domestic electricity or hot water consumption. The winter-summer consumption variations are attributed to holiday periods (households away from their homes during summer time and spending more time at home during the winter time) and excessive usage of electricity (es-pecially for lighting) during the winter periods. During the colder months, Swedish energy consumers tend to spend more time at their homes conse-quently leading to higher consumption of both, electricity and hot water. It is therefore, important to analyze the daily/hourly variations in order to better understand peoples‟ routines.
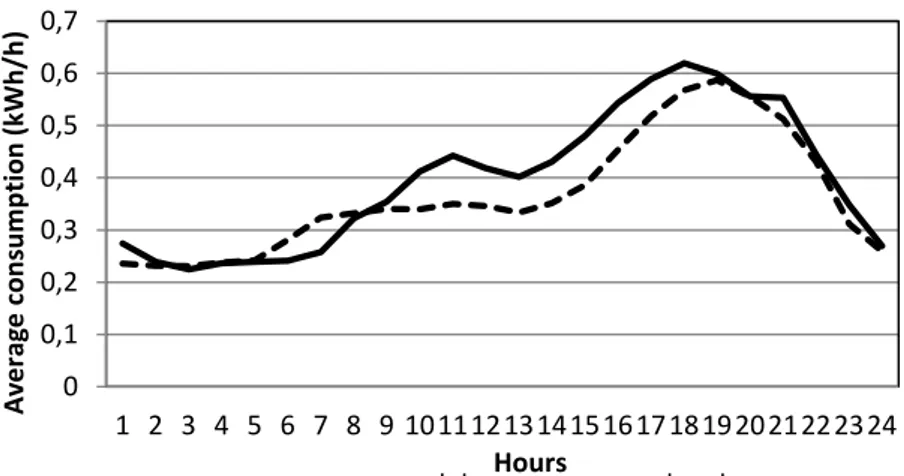
At the same time, hourly measurements are also giving us important in-formation that is necessary for predicting future electricity demand and con-sequently create demand response measures [50]. In this thesis hourly meas-urements were only available for households from group I. The average hourly load curves of weekend days and week days are presented in Figure 5. These curves reflect the average consumption per apartment for group I.
![Figure 3. Final energy consumption by sector in 2009 [19].](https://thumb-eu.123doks.com/thumbv2/5dokorg/4906197.134981/32.718.145.455.248.468/figure-final-energy-consumption-sector.webp)