Preprint
This is the submitted version of a paper published in Applied Energy.
Citation for the original published paper (version of record): Thorin, E., Olsson, J., Schwede, S., Nehrenheim, E. (2017)
Co-digestion of sewage sludge and microalgae: Biogas production investigations.
Applied Energy, : http://dx.doi.org/10.1016/j.apenergy.2017.08.085
https://doi.org/10.1016
Access to the published version may require subscription. N.B. When citing this work, cite the original published paper.
Permanent link to this version:
* Corresponding author. Tel.: +46-21-101564
E-mail address: eva.thorin@mdh.se
The short version of the paper was presented at ICAE2016 on Oct 8-11, Beijing, China. This paper is a substantial extension of the short version of the conference paper
Co-digestion of Sewage Sludge and Microalgae- Biogas
Production Investigations
2
Eva Thorin*, Jesper Olsson, Sebastian Schwede, Emma Nehrenheim
3
School of Business, Society and Engineering, Mälardalen University, PO Box 883, SE-721 23 Västerås, 4 Sweden 5 6 7
Abstract
8At municipal waste water treatment plants algae could be utilized for cleaning the water
9
and in the same time produce biomass that can be used for energy utilization. By
10
anaerobic digestion the microalgae can contribute to biogas production when
co-11
digested with sewage sludge. In this paper previous published results on co-digestion of
12
sewage sludge and microalgae are summarized and remaining knowledge gaps are
13
identified. The available batch tests in literature mostly concern digestion at mesophilic
14
conditions and studies on investigations of thermophilic conditions are less common.
15
Most of the mesophilic investigations indicate a synergetic effect for the co-digestion.
16
Also investigations of semi-continuous processes of co-digestion of microalgae and
17
sludge are scarce. The available results show good possibilities for co-digestion of
18
sewage sludge and microalgae. Further investigations are needed to find optimal
19
conditions for biogas production and analysis on a system level of microalgae
20
implementation on waste water treatment to also identify the total mass balance of
21
substrate and nutrient recovery.
22 23
Keywords: biomass, waste water treatment, batch, continuous, BMP, anaerobic
24
digestion
1. Introduction
Among the possible renewable energy sources biomass from microalgae is a promising
26
resource. Compared to other biomass resources the growth rate is high and it can be
27
cultivated without competition to food production on valuable land areas. Brune et al.
28
[1] have shown that CO2 mitigation with microalgae systems are 10 times more efficient
29
than forests. An attractive process solution for municipal waste water treatment plants is
30
to utilize algae for cleaning the water and in the same time produce biomass that can be
31
used for energy utilization [2-4]. Theoretical calculations based on stoichiometric
32
balancing show a potential of almost 20% higher methane production per reduced N for
33
a microalgae based waste water treatment plant compared to the traditional activated
34
sludge process [2] when utilizing the microalgae biomass for biogas production by
35
anaerobic digestion. By introducing algae in the waste water treatment plant several
36
benefits can be achieved. By capturing CO2 when growing, instead of using organic
37
carbon, the algae provide a path to balance the unfavorable C/N ratio in today’s
38
municipal waste water treatment plants based on the activated sludge process. This will
39
lead to a more sustainable nutrient recovery and higher biogas production since more
40
biomass is produced in the system. The microalgae also produce oxygen that can be
41
used by the bacteria cleaning the waste water and the need for aeration of the treatment
42
step decrease which also contributes to a more energy efficient process. Several process
43
solutions introducing microalgae in municipal waste water treatment with following
44
biogas production by anaerobic digestion are possible. However, for most solutions
45
microalgae will probably be a co-substrate in the biogas production process step since
46
there will still be primary sludge and still also waste activated sludge if microalgae are
47
only partly integrated or used to treat the reject water flow.
48
Experimental studies on co-digestion of sewage sludge and microalgae at different
49
conditions including batch test and continuous tests are described in [5-17]. Important
50
issues for a full-scale plant are the possibility to maintain stable operation and optimal
The short version of the paper was presented at ICAE2016 on Oct 8-11, Beijing, China. This paper is a substantial extension of the short version of the conference paper
biogas production but also suitable digestate characteristics. The compositions of the
52
substrates are important for achieving stable degradation processes. Too low carbon to
53
nitrogen (C/N) ratio can lead to high ammonia levels that inhibit the production of
54
biomethane, especially at high process temperatures [7, 8, 10, 18, 19]. Another factor
55
that can decrease the biomethane production is low availability of the substrates for the
56
microorganisms, for example due to large particle size or cell wall resistance [7, 10, 19].
57
Concerning digestate characteristics, the possibility to dewater the digestate, to recover
58
nutrients (phosphorous and nitrogen) and low levels of metals and other possible
59
harmful substances are important [9-11]. In [6] and [9] it was shown that co-digestion
60
with microalgae enhance the dewaterability of the digestate.
61
In this paper experiences and results from previous studies on co-digestion of sewage
62
sludge and microalgae both in batch and continuous tests at mesophilic and thermophilic
63
conditions are addressed. The aim is to summarize and compare the results of previous
64
studies, and identify remaining knowledge gaps for further understanding and
65
development of process design for biogas production at waste water treatment plants
66
with integrated algae cultivation.
67
2. Methods
The paper presents a compilation of significant literature in the area of microalgae as
68
a co-substrate to sewage sludge for biogas production. Batch tests in both mesophilic
69
and thermophilic conditions are included and compared. Possible synergetic effects are
70
evaluated based on results of biochemical methane potential (BMP) tests on single
71
substrates. The enhanced yield is expressed as the ratio between the difference between
72
the measured and calculated BMP of the mixtures and the calculated BMP obtained
73
from results of mono-digestion of the respective substrate. When the available data
74
allows, the theoretical methane potential is determined from the content of lipids,
75
carbohydrates and proteins and calculated based on the equation given by Symmons and
Buswell [20] and previously used in for example studies by Angelidaki et al [21], Wang
77
and Park [7] and Patinvoh et al [22], see equation 1.
78
CcHhOoNnSs + yH2O → xCH4 + nNH3 + sH2S + (c-x) CO2 Eq 1.
79
With the compositions C5H7O2N, C6H10O5 and C57H104O6 for proteins, carbohydrates
80
and lipids the theoretical biomethane potentials are 496, 415 and 1014 Ncm3 CH4 gVS-1
81
[21]. The conversion efficiency is expressed as the ratio between the measured
82
potential and the theoretical potential. When data for volatile solids (VS) degradation is
83
available the conversion efficiency is instead expressed as the ratio between the
84
amounts of VS degraded and VS added.
85
Results from continuous digestion investigations are also collected and compared.
86
Here the influence of the organic loading rate (OLR) and the hydraulic retention time
87
(HRT) on the biomethane production and process stability are selected as factors for the
88 evaluation. 89
3. Results
3.1. Characteristics 90In Table 1 the characteristics of the substrates used in the different tests are shown.
91
An advantage of co-digestion can be the possibility to achieve a better C/N ratio and
92
better balance of also other macro- and micronutrients and of fast degradable
93
carbohydrates and slower degradable proteins and fats as mentioned in [23]. From the
94
characteristics given for the different microalgae and sewage sludge (Table 1) it is not
95
obvious that co-digestion of microalgae and sludge can give those benefits since the
96
C/N ratios and compositions of lipids, carbohydrates and proteins are similar. The
97
average C/N ratio of all microalgae samples investigated (7.4±3) is only slightly higher
98
than the C/N ratios observed in WAS (4.7-5.5). Another possible reason for beneficial
99
effects for co-digestion is better balance of essential trace metals (Se, Co, Mo and Ni)
100
[5, 9].
The short version of the paper was presented at ICAE2016 on Oct 8-11, Beijing, China. This paper is a substantial extension of the short version of the conference paper
Table 1. Characteristics of substrates used in the BMP and continuous tests. 102 Substrate TS [%] VS [% of TS] C/N Protein [% of TS] Carbohydrates [% of TS] Lipids [% of TS] Ref. M1-Microalgae 1 (cult. in lw) 4.3 70 9.4 26 36 7 [8] M2-Microalgae 2 (cult. in mww) 90 65 7.8 26 31 3 [8] M3-Microalgae 3 (cult. in mww) 8.4 59 5.9 33 35 3 [9] M4-Microalgae 4 (Chlorella) 0.73 81 13.4a 47 - - [6] M5-Microalgae 5 (Micratinium) 0.69 76 12.0a 52 - - [6] M6- Microalgae 6 (Spirulina platensis) 1.5 50 6 - - - [5] M7- Microalgae 7 (Isochrysis galbana) 0.9-1.0 90 7.1 46 14 20 [10] M8- Microalgae 8 (Selenastrum capricornutum) 0.9-1.0 98 9.2 39 29 30 [10]
M9- Microalgae 9 (Chlorella vulgaris) 10.84 79 4.6 55 16 0 [11] M10- Microalgae 10 (pre-treated M9) 5.41 84 5.7 45 25 0 [11] M11- Microalgae 11(Spirulina maxima) 4.5 86 4.2 - - - [12] M12- Microalgae 12 (Chlorella sorokiniana) - 94b 5.3 - - - [13] M13- Microalgae 13 (Chlorella Sp.) 10 - 5.4 67 6 16 [14] M14-Microalgae 14 (Scenedesmus sp.) - - - [15] M15-Microalgae 15 (Chlorella sp.) - - - [15] M16-Microalgae 16 (mix of Chlorella
sorokiniana and Scenedesmus sp.)
0.68 84 33a - - - [16]
M17- Microalga 17 (Chlorella sp.) 0.77 64 66a [17]
Average and standard deviation 77 ±14 7.4±3a
S1-Sludge 1 (mixed WAS+ PS) 3.5 80 9.2 25 43 11 [8]
S2-Sludge 2 (WAS) 5.4 73 4.7 49 19 6 [9]
S3-Sludge 3 (PS) 5.5 77 12.7 18 45 9 [9]
S4-Sludge 4 (WAS) 0.74 73 10.3a - - - [6]
S5-Sludge 5 (WAS) 1.5 67 - - - - [5]
S6-Sludge 6 (mixed WAS+PS) 3.05 88 - - - - [10]
S7-Sludge 7 (WAS) 3.98 72 5.5 35 43 0 [11] S8 – Sludge 8 (PS) 2.96 67 10.0 27 46 0 [11] S9-Sludge 9 (pre-treated S7) - - - [11] S10-Sludge 10 (PS) 4.8 78 14 - - - [12] S11-Sludge 11 (WAS) - - 4.9 - - - [13] S12-Sludge 12 (PS) 18.5 - 7.8 - - - [14]
S13-Sludge 13 (mixed WAS+PS) - - - [15]
S14-Sludge 14 (WASc)
1 72 17a - - - [16]
S15-Sludge 15 (WASc)
1 78 16a - - - [17]
S16-Sludge 16 (WAS) 0.21 72 13a - - -
Average and standard deviation 74±7 9.5±3a
cult.= cultivated, lw=lake water, mww= municipal waste water, a COD/N ratio instead of C/N ratio, the values are not included in
103
the average, b VS given as kg/kg, c from a short solids retention time (SRT) activated sludge systems, aerobic phase (S14) and
104
anaerobic phase (S15), WAS=waste activated sludge, PS= primary sludge, - = data not available
105 106
In [9] it is shown that the microalgae (M3) contain more Co, Mo and Ni than the sludge
107
(S2 and S3).
The second culture of microalgae (M2) is dried. Microalgae 3, 6, 11 and 16 (M3, M6,
109
M11and M16) and Sludge 14 and 15 (S14 and S15) are frozen. Microalgae 10 (M10)
110
and Sludge 9 (S9) are pre-treated thermally at 120°C for 40 minutes. All other
111
substrates (M1-M2, M5, M7- M9, M12-M15, S1- S8, S10-S13, and S16) are not
pre-112
treated. According to Bohutskyi and Bouwer [24] studies have shown that drying can
113
reduce the biogas potential of microalgae up to about 20% while thermal pre-treatment
114
can increase the biogas potential and the increase is dependent on temperature,
115
treatment duration and biomass concentration.
116
3.2. Batch tests
117
The results of the batch tests are presented in Table 2 and 3. Table 2 shows the results
118
from batch tests conducted at temperatures 33-37 °C, corresponding to mesophilic
119
conditions, while the results presented in Table 3 are from tests conducted at
120
temperatures 50-55 °C, corresponding to thermophilic conditions. In both Table 2 and 3
121
the measured BMP values are given for digestion of single substrates as well as for
122
digestion of mixtures and for the tests on mixtures the BMP calculated from the BMP of
123
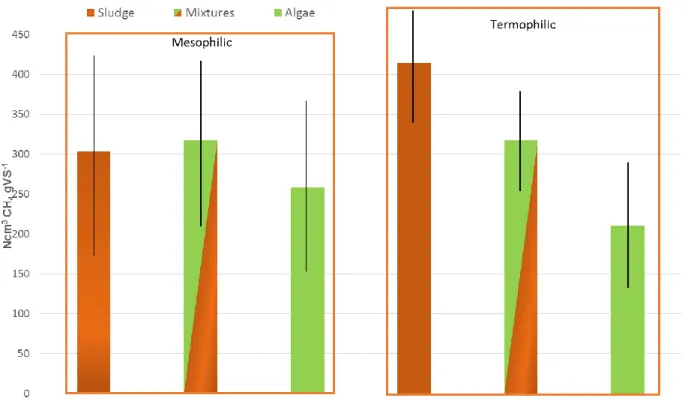
the single substrates is also given. In Figure 1 the average BMP for the sludge,
124
microalgae and mixtures of sludge and microalgae in tests 1-7 and 12-18 are shown and
125
the standard deviations are also indicated. The ten different types of sewage sludge used
126
in the mesophilic tests 1-7 and 12-18 have a BMP of 304 ± 118 Ncm3 CH
4 gVS-1, the 13
127
different microalgae used in the same tests have a BMP of 258 ± 106 Ncm3 CH
4 gVS-1
128
and the BMP for the 29 different mixtures co-digested is 317 ± 101 Ncm3 CH
4 gVS-1,
129
which shows that the variation is large.
130
For the microalgae, the methane production decreases in thermophilic conditions
131
compared to the production in mesophilic conditions while sewage sludge digestion
132
result in higher methane yields in thermophilic conditions.Also for the thermophilic
133
tests the variation in the results is large with a BMP of 210 ± 78 Ncm3 CH4 gVS-1 for the
134
microalgae and a BMP of 318 ± 60 Ncm3 CH4 gVS-1 for the different mixtures.
The short version of the paper was presented at ICAE2016 on Oct 8-11, Beijing, China. This paper is a substantial extension of the short version of the conference paper
Table 2a. Results of batch tests at mesophilic conditions. Batch tests 1-10 136 Batch test nr Substrate [% of VS content] Temp. [°C] Meas. BMP [Ncm3 CH 4 gVS-1] Calc. BMP [Ncm3 CH 4 gVS-1] Enhanced yield [%] Theor. BMP [Ncm3 CH 4 gVS-1] Conv. Effi. [%] Meas./ Theor. Ref. 1 100 % S1 37 331±35 - - 521 64 [8] 1 88% S1 + 12% M1 37 344±15 335 3 519 66 [8] 1 75% S1+25% M1 37 358±61 350 2 516 69 [8] 1 63% S1+ 37% M1 37 408±17 355 15 514 79 [8] 1 100 % M1 37 367±5 - - 503 73 [8] 2 88% S1+ 12% M2 37 387±67 313 24 512 75 [8] 2 75% S1+ 25% M2 37 348±65 293 19 502 67 [8] 2 63% S1+ 37% M2 37 325±67 283 15 494 63 [8] 2 100 % M2 37 179±38 - - 447 40 [8] 3 35% S2 + 65% S3 35 317±2 - - 595 64 a 3 19%S2 +39% S3+42%M3 35 239±9 235 2 526 45 a 3 100% M3 35 120±2 - - 447 40 a 4 100 % S4 mesoph. 243 - - - 60b [6] 4 79% S4 + 21% M4 mesoph. 253 240 5 - 56 b [6] 4 100 % M4 mesoph. 230 - - - 42 b [6] 5 79% S4+ 21% M5 mesoph. 236 236 0 - 59 b [6] 5 100 M5 mesoph. 209 - - - 40 b [6] 6 100 % S6 33 347±9 - - - - [10] 6 75 % S6+25% M7 33 318±5 345 -8 - - [10] 6 50 % S6+50% M7 33 356 343 4 - - [10] 6 25 % S6+75% M7 33 343 340 1 - - [10] 6 100 % M7 33 338±3 - - 562 62 [10] 7 75 % S6+25% M8 33 303±11 312 -3 - - [10] 7 50 % S6+50% M8 33 302±3 278 9 - - [10] 7 25 % S6+75% M8 33 254±5 243 5 - - [10] 7 100 % M8 33 209±5 - - 632 33 [10] 8 100 % S7 35 80±2c - - 494 - [11] 8 75 % S7+25% M9 35 92±2 c 87 c 5 - - [11] 8 50 % S7+50% M9 35 91±8 c 94 c -4 - - [11] 8 25 % S7+75% M9 35 107±8 c 101 c 6 - - [11] 8 100 % M9 35 108±1 c - - 460 - [11] 9 100 % S8 35 266±14 c - - 490 - [11] 9 75 % S8+25% M9 35 252±4 c 227 c 11 - - [11] 9 50 % S8+50% M9 35 210±3 c 187 c 12 - - [11] 9 25 % S8+75% M9 35 171±3 c 148 c 16 - - [11] 10 100% S9 35 95±3 c - - 408 - [11] 10 75 % S9+25% M10 35 103±3 c 115 c -11 - - [11] 10 50 % S9+50% M10 35 140±6 c 135 c 3 - - [11] 10 25 % S9+75% M10 35 152±6 c 155 c -4 - - [11] 10 100 % M10 35 176±5 c - - 393 - [11] 11 75 % S8+25% M10 35 293±10 c 254 c 15 - - [11] 11 50 % S8+50% M10 35 283±15 c 243 c 16 - - [11] 11 25 % S8+75% M10 35 262±3 c 232 c 13 - - [11] a tests described in [9] but data not previously published, bconversion efficiency based on VS degradation, cthe unit for the results
137
are Ncm3 CH
4 gCOD-1,- = data not available
138 139 140
Table 2b. Results of batch tests at mesophilic conditions. Batch tests 11-18 141 Batch test nr Substrate [% of VS content] Temp. [°C] Meas. BMP [Ncm3 CH 4 gVS-1] Calc. BMP [Ncm3 CH 4 gVS-1] Enhanced yield [%] Theor. BMP [Ncm3 CH 4 gVS-1] Conv. Effi. [%] Meas./ Theor. Ref. 12 100% S11 35 362 - - - [13] 12 75%S11+25% M12 35 442 351 26 - - [13] 12 50%S11+50% M12 35 380 340 12 - - [13] 12 25%S11+75% M12 35 354 329 8 - - [13] 12 100% M12 35 318 - - - - [13] 13 100%S12 35 127 ± 7.2d - - - - [14] 13 50%S12+50%M13 35 116 ± 3.5d 76 53 - - [14] 13 100% M13 35 25 ± 2d - - - - [14] 14 100%S13 37 414 - - - - [15] 14 50%S13+50%M14 37 411 382 8 - - [15] 14 100%M14 37 351 - - - - [15] 15 50%S13+50%M15 37 416 382 9 - - [15] 15 100%M15 37 349 - - - - [15] 16 100%S14 37 363±68 - - - - [16] 16 90%S14+10%M16 37 400 ± 22 360 11 [16] 16 100%M16 37 331 ± 76 - - - - [16] 17 100%S15 37 449±17 - - - - [16] 17 90%S15+10%M16 37 560±24 437 28 - - [16] 18 100% S16 35 86f - - - [17] 18 95%S16+5%M17 35 96f 98 -2 - - [17] 18 90%S16+10%M17 35 122f 110 11 - - [17] 18 75%S16+25%M17 35 209f 147 43 - - [17] 18 60%S16+40%M17 35 307f 183 68 - - [17] 18 50%S16+50%M17 35 317f 207 53 - - [17] 18 25%S16+75%M17 35 275f 268 3 - - [17] 18 100%M17 35 328f - [17] d the unit of the measurement results are not clear, f values read from graph - = data not available
142
Table 3. Results of batch tests at thermophilic conditions.
143 Batch test nr Substrate [% of VS content] Temp. [°C] Meas. BMP [Ncm3 CH 4 gVS-1] Calc. BMP [Ncm3 CH 4 gVS-1] Enhanced yield [%] Theor. BMP [Ncm3 CH 4 gVS-1] Conv. Effi. [%] Meas./ Theor. Ref. 19 100 % S1 55 363±6 - - 521 70 [8] 19 88% S1+ 12% M1 55 388±75 358 8 519 75 [8] 19 75% 1+25% M1 55 338±65 352 -4 516 65 [8] 19 63% S1+ 37% M1 55 321±15 356 -10 514 62 [8] 19 100 % M1 55 317±53 - - 503 63 [8] 20 88% S1+ 12% M2 55 323±8 337 -4 512 62 [8] 20 75% S1+25% M2 55 298±55 307 -3 502 58 [8] 20 63% S1+37% M2 55 276±10 281 -2 494 54 [8] 20 100 % M2 55 150±13 - - 447 34 [8] 21 100 % S6 50 464±4 - - - - [10] 21 75 % S6+25% M7 50 420 403 4 - - [10] 21 50 % S6+50% M7 50 340 342 -1 - - [10] 21 25 % S6+75% M7 50 259 280 -8 - - [10] 21 100 % M7 50 219±10 - - 565 39 [10] 22 75 % S6+25% M8 50 370 386 -4 - - [10] 22 50 % S6+50% M8 50 286 308 -7 - - [10] 22 25 % S6+75% M8 50 201 230 -13 - - [10] 22 100 % M8 50 152±6 - - 624 24 [10]
- = data not available
The short version of the paper was presented at ICAE2016 on Oct 8-11, Beijing, China. This paper is a substantial extension of the short version of the conference paper
145
146
Figure 1. Average methane production in the batch tests. The lines indicate the standard deviation. 147
148 149
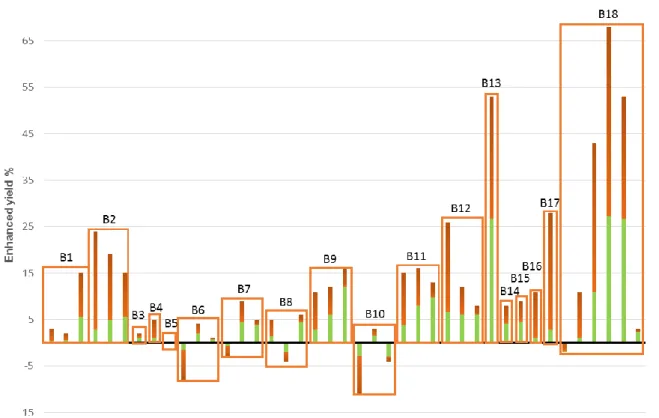
The results of the calculation of the enhanced yield for the co-digestion tests on
150
mixtures of microalgae and sludge are presented in Table 2 and 3 and also illustrated in
151
Figure 2 and 3. The majority of the tests in mesophilic conditions indicate enhanced
152
methane production, with enhancements up to almost 70%, when microalgae and
153
sewage sludge are co-digested. However, the results are uncertain since standard
154
deviations for some of the BMP tests are in the same order of magnitude as the
155
identified enhancement. High values of enhanced methane production are found for
156
tests (no 2, 9, 13 and 17), where sewage sludge with high BMP values are co-digested
157
with microalgae with low BMP values. This might be due to a higher importance of
158
enhanced hydrolysis of algae biomass by sludge microorganisms, as mentioned in [7],
159
for those cases. However, also test no 11 and 12 with slighlty higher BMP values for the
160
microalgae, even though still lower than the BMP for the sludge, show high values of
Figure 2. Enhanced yield for the different mesophilic batch tests on mixtures of microalgae and sludge. 162
The green color indicate the proportion of algae and the boxes indicate results from the same batch test 163
(B1-B18 in Table 2). 164
165
the enhancement. Test no 18 also show high enhancements even though the microalgae
166
in this case has much higher BMP value than the sludge used in the co-digestion.
167
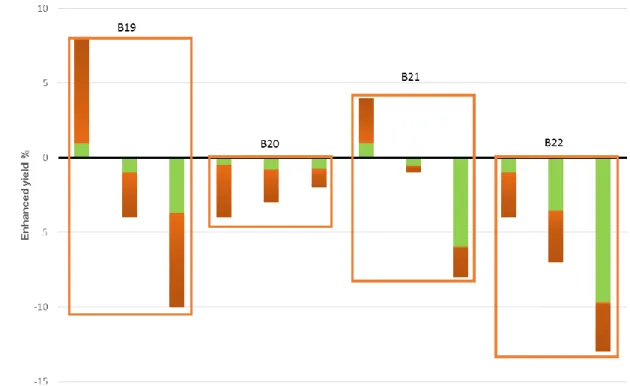
The majority of the co-digestion tests at thermophilic conditions show negative
168
enhancement values down to about -10%.
169
The conversion efficiency is higher than 50% for most co-digestion cases, for which
170
the conversion efficiency can be evaluated, in both mesophilic and thermophilic
171
conditions. However, for the pure microalgae the conversion efficiency is lower than
172
50% in most cases with typical values around 40%.
173 174
The short version of the paper was presented at ICAE2016 on Oct 8-11, Beijing, China. This paper is a substantial extension of the short version of the conference paper
175
Figure 3. Enhanced yield for the different thermophilic batch tests on mixtures of microalgae and sludge. 176
The green color indicate the proportion of algae and the boxes indicate results from the same batch test 177
(B19-B22 in Table 3). 178
3.3. Continuous tests
179
The results of the continuous tests are presented in Table 4. The working volumes in
180
the continuous tests are 5, 7 and 1.5 dm3 for test 1, 2 and 3, respectively [8, 5, 12]. In
181
the continuous test no 2 a two-stage system is used including one stage of 2 dm3and a
182
second stage of 5 dm3 [5]. The HRT used are similar in the different tests in a range
183
from 10 to 20 days. The organic loading rates are different for the different tests with
184
low loading rates below 1 kgVSm-3d-1 for the two-step process (the second test) and a
185
range from 1.5 to 6 kgVSm-3d-1 for the first and third tests. The yields for the
co-186
digestion cases show high variation with an average of 290±115 Ncm3 gVSin-1. The
187
methane yield per reduced VS show a lower variation with an average of 682±76 Ncm3
188
gVSred-1,
Table 4. Results of continuous tests. 190 Cont. test nr Substrate (% of VS content) Temp. [°C] OLR [kgVSm -3d-1] HRT [days] CH4 prod. [Ncm3 dm-3 d-1] Normalized CH4 yield [Ncm3 gVS in-1] CH4 /VS conv. [Ncm3 gVS red-1] Ref. 1 40% S2+60% S3 37 2.5 3.5 15 10 305±55 388 ± 39 200±33 177 ±21 393±69 371±58 * 1 22 % S2+51% S3 + 37% M3 37 2.5 3.5 15 10 260 ± 35 353 ± 31 172±26 158±15 607±165 568±62 * 2 100% S5 36 0.7** 14 270 386 643 [5] 2 67% S5+ 33% M6 36 0.64** 14 295 461 738 [5] 2 100 % M6 36 0.54** 14 179 332 498 [5] 3 100% M11 35 1.5 3.0 4.5 6 20 310 370 510 620 310 190 170 160 733 725 688 661 [12] 3 9.3% S10 + 90.7% M11 35 3.2 20 690 310 701 [12] 3 32.7% S10+67.3% M11 35 4.4 20 820 280 731 [12] 3 49.4% S10+ 51.6% M11 35 5.8 20 1410 360 748 [12] 3 100% S10 35 2.8 20 640 330 721 [12]
* tests described in [8] but data not previously published,** OLR based on the total volume of the two-stage process.
191 192
where the standard deviation is similar to the reported standard deviations for the first
193
test.
194
Varol and Urgulu [5] report lower variations in pH for the co-digestion test compared
195
to digestion of the single substrates. This could be due to providing higher buffer
196
capacity when co-digesting with microalgae as observed in [23], where microalgae and
197
corn silage were co-digested. The results from the second and third continuous tests
198
indicate a synergetic effect of the co-digestion and methane yield per reduced VS
199
increase for the co-digestion case for the first continuous test. The influence of OLR and
200
HRT on the biogas production and process stability cannot clearly be seen. None of the
201
studies report on any major process instabilities. 202
4. Discussion and identified knowledge gaps
As can be seen in Figure 1 the variation in BMP for microalgae is large. In [7] it is
203
mentioned that different species and growth conditions can cause variations in methane
204
yield and Passos et al [25] show that the methane yield from microalgae biomass
The short version of the paper was presented at ICAE2016 on Oct 8-11, Beijing, China. This paper is a substantial extension of the short version of the conference paper
cultivated in a waste water treatment plant varies during the year due to variations in the
206
dominant microalgae species. This shows the need for more studies also of co-digestion
207
of sludge and microalgae on a system level related to the conditions for microalgae
208
cultivation and variations in sludge quality to better understand the overall biomethane
209
production potential for the system during the year. Also the proportions of sludge and
210
microalgae needs to be related to the overall system. In most of the cases (40 of 55)
211
investigating the methane production of mixtures of sludge and microalgae presented in
212
Table 2, 3 and 4 the proportions of sludge are 50% or more. In a system with cultivation
213
of microalgae utilizing carbon also from CO2 in the air, in a waste water treatment plant
214
with integration of microalgae cultivation, the microalgae biomass production might be
215
larger than other sludge production and more studies on co-digestion of microalgae and
216
sludge where the proportion of microalgae are more than 50% are of high relevance.
217
Investigations on system level to find optimal conditions for overall biogas production,
218
and quantifying captured nutrients (C, N, P) in comparison to the traditional activated
219
sludge process are needed.
220
The low conversion efficiency for many of the batch tests on pure microalgae
221
indicates that pretreatment of the microalgae could be a way to increase the biogas
222
production also for the co-digestion of microalgae and sludge. Good results, concerning
223
increased biogas production, in anaerobic digestion of thermally pretreated microalgae,
224
are reported in for example [24] and [11]. However, as shown in table 2 the VS content
225
of wastewater derived microalgae cultures is rather low compared to mono-microalgae
226
cultures. The lower VS content reduces the potential of organic material that can be
227
released by pretreatment. Anbarasan et al [26] give an indication that thermal
228
pretreatment of wastewater grown microalgae has rather a slight effect on the
229
degradation kinetics than on the final yield. Mendez et al [27] also show that the
230
pretreatment effect is dependent on the microalgae species. Further, the energy balance
231
of the whole process needs to be considered. Passos et al [18] show that both thermal
and microwave pretreatment methods can have negative energy balances and that
233
further development are necessary for decreasing the energy demand of the pretreatment
234
processes.
235
The different batch tests have been run for different times in the interval 20 to 55
236
days, with 55 days for batch tests 1, 2, 19 and 20, 42 days for test 13, 35 days for batch
237
test 3, 6 and 7, 32 days for batch test 8, 28 days for batch test 9 and 11, 27 days for
238
batch tests 12, 16, 17, 21 and 22, 25 days for test 14 and 15, 23 days for batch test 10,
239
and 20 days for batch tests 4, 5 and 18. This introduces an uncertainty in comparing the
240
reported biogas potentials. In [8] the batch test results have been correlated to a kinetic
241
model of the biogas production, the modified Gompertz equation presented by Zhu et al
242
[28]. The Gompertz model gives the biogas yield potential that might be a better value
243
for evaluation of the full biogas potential than the measured accumulated biogas volume
244
in the experiment.
245
Ward et al [29] report on several continuous studies on digestion of microalgae. They
246
conclude that the focus in most of those studies was on concentrating and dewatering
247
the substrate to avoid too low concentration of digestible substrate. They also report on
248
several studies indicating that a two-step process is favorable for digestion of
249
microalgae resulting in a more stable process and higher biogas yields. Very few
250
continuous studies on co-digestion of microalgae and sludge have been found. Also the
251
available continuous studies are scarce in process data. To better understand the process
252
it is of interest to follow other parameters than the biogas production, such as volatile
253
fatty acids, ammonia and alkalinity.
254
5. Conclusions
Available investigations of co-digestion of sewage sludge and microalgae mostly 255
concern batch tests at mesophilic conditions while investigations at thermophilic
256
conditions and of semi-continuous processes are scarce. For the microalgae, mesophilic
257
conditions is favourable for high methane production while thermophilic conditions
The short version of the paper was presented at ICAE2016 on Oct 8-11, Beijing, China. This paper is a substantial extension of the short version of the conference paper
give higher methane production for sewage sludge. Tests on co-digestion with high
259
proportions of sludge dominates in the studies found. Synergetic effects of co-digestion
260
of microalgae and sewage sludge at mesophilic conditions are indicated in both batch
261
and semi-continuous tests. The available test results clearly show the possibility for
co-262
digestion of sewage sludge and microalgae. The variations in conditions and presented
263
results between different studies are large and including kinetic models of the test
264
results in more studies might make it easier to compare different experimental results.
265
Further investigations are needed to find operation conditions (proportions, loading
266
rates and retention times) for optimal methane production and studies on using higher
267
proportions of microalgae in the co-digestion are especially of interest. For better
268
understanding of the process, more studies following process parameters such as
269
volatile fatty acids, ammonia and alkalinity as well as more analysis of the substrate and
270
digestate composition are needed. In addition, the effect of microalgae implementation
271
on waste water treatment has to be evaluated on a system perspective to identify the
272
total mass balance of substrate, resulting biogas production and nutrient recovery
273
considering also variations during the year.
274
Acknowledgements
The project is a co-production study within the framework Future Energy. The
275
Knowledge Foundation in Sweden (KKS) and Mälarenergi AB are thanked for their
276
funding and knowledge contributions.
277
References
[1] Brune D.E., Lundquist T.J., Benemann J.R. Microalgal biomass for greenhouse gas reductions: 278
Potential for replacement of fossil fuels and animal feeds. J Environ Eng 2009; 135: 1136-1155. 279
[2] Selvaratnam T., Pegallapati A., Montelya F., Rodriguez G., Nirmalakhandan N., Lammers P. J., 280
van Voorhies W. Feasibility of algal systems for sustainable wastewater treatment. Renew Energ 2015; 281
82: 71-76.
[3] Chen G., Zhao L., Qi Y. Enhancing the productivity of microalgae cultivated in wastewater toward 283
biofuel production: A critical review. Appl Energ 2015; 137:282–291. 284
[4] Cheah W.Y., Ling T. C., Show P. L., Juan J. C., Chang J. S., Lee D. J. Cultivation in wastewaters 285
for energy: A microalgae platform. Appl Energ 2016; 179:609–625. 286
[5]Varol A., Ugurlu A. Biogas Production from Microalgae (Spirulina platensis) in a Two Stage 287
Anaerobic System. Waste Biomass Valor 2016; 7:193–200. 288
[6] Wang M., Park C. Investigation of anaerobic digestion of Chlorella sp.and Micractinium sp. grown 289
in high-nitrogen wastewater and their co-digestion with waste activated sludge. Biomass Bioenerg 2015; 290
80:30-37.
291
[7] Wang M., Sahu K.A., Björn R.., Park C. Anaerobic co-digestion of microalgae Chlorella sp. and 292
waste activated sludge. Bioresour Technol 2013; 152: 585–590. 293
[8] Olsson J., Feng X.M., Ascue J., Gentili F.G., Shabiimam M.A., Nehrenheim E., Thorin E. Co-294
digestion of cultivated microalgae and sewage sludge from municipal waste water treatment. Bioresour 295
Technol 2014; 171: 203–210. 296
[9] Olsson J., Forkman T.,Gentilli F.,Nehrenheim E., Schwede S., Thorin E. Semi-continuous Co-297
digestion of Microalgae and Representative mix of Sewage Sludge. 5th Int. Symposium on Energy from 298
Biomass and Waste, Venice Italy, 19-22 Nov 2014 299
[10] Caporgno M.P., Trobajo R., Caiola N., Ibanez C., Fabregat A., Bengoa C. Biogas production from 300
sewage sludge and microalgae co-digestion under mesophilic and thermophilic conditions. Renew Energ 301
2015; 75 : 374-380. 302
[11] Mahdy A., Mendez L., Ballesteros M., González-Fernández C. Algaculture integration in 303
conventional wastewater treatment plants:Anaerobic digestion comparison of primary and secondary 304
sludge with microalgae biomass. Bioresour Technol 2015; 184 : 236–244. 305
[12] Samson R., LeDuy A. Improved performance of anaerobic digestion of Spirulina maxima algal 306
biomass by addition of carbon-rich wastes. Biotechnol Lett 1983; 5:677-682. 307
[13] Beltran C., Jeison D., Fermoso F. G., Borja R. Batch anaerobic co-digestion of waste activated 308
sludge and microalgae (Chlorella sorokiniana) at mesophilic temperature. J Environ Sci Heal A 2016, 51: 309
847–850. 310
[14] Kim J., Kang C. M. Increased anaerobic production of methane by co-digestion of sludge with 311
microalgal biomass and food waste leachate. Bioresour Technol 2015;189: 409–412. 312
[15] Skorupskaitė V., Makarevičienė V., Šiaudinis G., Zajančauskaitė V. Green energy from different 313
feedstock processed under anaerobic conditions. Agron Res 2015; 13: 420–429. 314
The short version of the paper was presented at ICAE2016 on Oct 8-11, Beijing, China. This paper is a substantial extension of the short version of the conference paper
[16] Wágner D. S. , Radovici M., Smets B. S., Angelidaki I., Valverde-Pérez B., Plósz B. G. 315
Harvesting microalgae using activated sludge can decrease polymer dosing and enhance methane 316
production via co-digestion in a bacterial-microalgal process. Algal Res 2016; 20:197–204. 317
[17] Lee E., Cumberbatch J., Wang M., Zhang Q. Kinetic parameter estimation model for anaerobic 318
co-digestion of waste activated sludge and microalgae. Bioresour Technol 2017:228: 9–17. 319
[18] Passos F., Solé M., García J., Ferrer I. Biogas production from microalgae grown in 320
wastewater:Effect of microwave pretreatment. Appl Energ 2013;108:168–175. 321
[19] Schwede S., Rehman Z.-U., Gerber M., Theiss C., Span R. Effects of thermal pretreatment on 322
anaerobic digestion of Nannochloropsis salina biomass. Bioresour Technol 2013;143: 505–511. 323
[20] Symons G. E., Buswell A. M. The methane fermentation of carbohydrates. J Am Chem Soc 1933; 324
55: 2028-2036.
325
[21] Angelidaki I., Sanders W. Assessment of the anaerobic biodegradability of macropollutants. Rev 326
Environ Sci Biotechnol 2004;3:117-129. 327
[22] Patinvoh R.J., Osadolor O. A., Chandolias K., Horváth I. S., Taherzadeh M. J. Innovative 328
pretreatment strategies for biogas production. Bioresour Technol 2017; 224 : 13–24. 329
[23] Schwede S., Kowalczyk A., Gerber M., Span R. Anaerobic co-digestion of the marine microalga 330
Nannochloropsis salinawith energy crops. Bioresour Technol 2013; 148: 428–435. 331
[24] Bohutskyi P., Bouwer E. Biogas Production from Algae and Cyanobacteria Through Anaerobic 332
Digestion: A Review, Analysis, and Research Needs, J.W. Lee (ed.), Advanced Biofuels and Bioproducts, 333
Springer Science and Business Media, New York, 2013 334
[25] Passos F., Gutiérrez R., Brockmann D., Steyer J. P., García J., Ferrer I. Microalgae production in 335
wastewater treatment systems, anaerobic digestion and modelling using ADM1. Algal Res 2015;10: 55-336
63. 337
[26] Anbalagan, A., Schwede, S., Lindberg, C.-F., Nehrenheim, E., 2016. Influence of hydraulic 338
retention time on indigenous microalgae and activated sludge process. Water Res 2016;91: 277–284. 339
[27] Mendez L., Mahdy A., Ballesteros M., González-Fernández C. Methane production of thermally 340
pretreated Chlorella vulgaris and Scenedesmus sp. biomass at increasing biomass loads, Appl Energy 341
2104; 129:238–242. 342
[28] Zhu B., Gikas P., Zhang R., Lord J., Jenkins B., Li X. Characteristics and biogas production 343
potential of municipal solid wastes pretreated with a rotary drum reactor. Bioresour Technol 2009; 344
100:1122–1129.
345
[29] Ward A.J., Lewis D.M., Green F.B. Anaerobic digestion of algae biomass: A review. Algal Res 346
2014; 5: 204–214. 347
![Table 2b. Results of batch tests at mesophilic conditions. Batch tests 11-18141 Batch test nr Substrate [% of VS content] Temp](https://thumb-eu.123doks.com/thumbv2/5dokorg/4899495.134548/9.816.82.738.166.577/table-results-mesophilic-conditions-batch-batch-substrate-content.webp)