COMPARISON AND EVALUATION OF
HARDWARE MODELLING AND SIMULATION
TOOLS
MATTIAS KARLSSON
MASTER THESIS 2011
ELECTRICAL ENGINEERING
COMPARISON AND EVALUATION OF
HARDWARE MODELLING AND SIMULATION
TOOLS
MATTIAS KARLSSON
This thesis work is performed at Jönköping Institute of Technology within the subject area Electrical Engineering. The work is part of the university’s master’s engineering degree. The author is responsible for the given opinions, conclusions and results. Supervisors: Ph.d. Håkan Forsberg and Professor Shashi Kumar
Examinator: Professor Shashi Kumar Credit points: 30 points (D-level) Date:
Abstract
Avionics Division of Saab AB develops advanced electronics that need to be robust and work in harsh environments with for example extreme temperatures and cosmic radiation without any failure. To succeed with this the electronics need to be simulated and tested. Therefore this thesis work is done to
strengthen the Avionics Division’s knowledge of hardware modelling and simulation by evaluating the simulation tools LTSpice, PSpice and
SystemVision, their functions and capabilities.
In this thesis a survey is carried out with help of a questionnaire to study the Avionics Division’s needs for simulation. The survey is underlying an analysis of the analyses that can be performed by the simulation tools for example Sensitivity analysis, Worst Case analysis, Monte Carlo analysis and Parametric Sweep analysis. The different analyses are discussed in the thesis. The
questionnaire is also underlying an analysis of the tools LTSpice, PSpice and SystemVision. The result of the analysis is summarized in Table 1.
A case study of a circuit simulation in SystemVision, based on an existing circuit used by Avionics Division, is also done within this thesis work. The study is done to evaluate the tool’s usability, to see if it is easy to perform a simulation and if it is easy to find and use suitable models from the model library.
The case study describes how a simulation is performed in SystemVision and how an AC analysis of a Butterworth filter is done. A stability and reliability check of the tool is performed as well as a robustness simulation. The analyses were easy to do and the overall impression is that SystemVision is reliable and user friendly structured. In order to check and compare the results of the AC analysis the same analysis is performed using LTSpice. The comparison shows that the results differ. This depending on that the models of the circuit were some what different in LTSpice and SystemVision.
The final conclusion is that SystemVision would fit within Avionics Division’s workflow. Using SystemVision demands education of the engineers to secure maximum use of all the advantages of SystemVision.
Keywords
Keywords
SystemVision, Monte Carlo, VHDL-AMS, Spice,
PSpice, LTSpice, modelling, simulation,
To my beloved Sofie Rasmus and Olivia
Table of contents
Contents
1 Introduction... 6
1.1 BACKGROUND...6
1.2 PURPOSE AND AIMS...8
1.3 DELIMITS...8 1.4 METHOD...9 1.5 OUTLINE...10 2 Theoretical background... 12 2.1 INTRODUCTION TO SIMULATION...12 2.2 ABSTRACTION LAYERS...15 2.3 SPICE MODELS...16 2.4 MAST...19 2.5 THE VHDL-AMS MODEL...20 3 Survey... 23
3.1 THE ACCOMPLISHMENT OF THE QUESTIONNAIRE...23
3.2 TYPE OF HARDWARE DESIGNED TODAY...24
3.3 THOUGHTS ABOUT SIMULATING HARDWARE...24
3.4 COMPLEXITY AND LEVEL OF THE HARDWARE DESIGN...26
3.5 EXPERIENCES FROM SIMULATING HARDWARE...27
3.6 ENSURING ACCURATE DATA...30
3.7 ENSURING ENOUGH DATA...31
3.8 ENSURING ACCURATE MODELS...31
3.9 ENSURING THE CORRECT FORMULAE...32
3.10 NEEDS WHEN SIMULATING THE HARDWARE...33
3.11 HARDWARE COMPLEXITY...37
3.12 OTHER AREAS OF SIMULATION...38
3.13 CONCLUSIONS...39
4 Simulation analyses ... 40
4.1 DC ANALYSIS...40
4.2 AC ANALYSIS...41
4.3 TRANSFER FUNCTION ANALYSIS...42
4.4 SENSITIVITY ANALYSIS...43
4.5 WORST CASE ANALYSIS...43
4.6 THE OPTIMIZER TOOL...43
4.7 TRANSIENT ANALYSIS...44
4.8 FOURIER ANALYSIS...47
4.9 TEMPERATURE SWEEP...47
4.10 MONTE CARLO ANALYSIS...48
4.11 SMOKE ANALYSIS...52
4.12 PARAMETRIC SWEEP ANALYSIS...52
5 Simulation tools ... 55
5.1 SPICE...55
5.2 LTSPICE IV...58
5.4 SYSTEMVISION...70
5.5 SUMMARY...77
6 A case study of SystemVision... 80
6.1 THE BUTTERWORTH FILTER IN LTSPICE...80
6.2 THE CASE STUDY IN SYSTEMVISION...82
6.3 AN AC ANALYSIS OF THE BUTTERWORTH FILTER...85
6.4 STABILITY AND RELIABILITY TEST...86
6.5 ROBUSTNESS SIMULATION...87
6.6 CONCLUSION OF THE CASE STUDY...89
7 Conclusions and final discussion... 90
7.1 REASONS FOR MODELLING AND SIMULATION...90
7.2 ONE OR SEVERAL TOOLS?...90
7.3 LTSPICE,PSPICE OR SYSTEMVISION?...91
7.4 CASE STUDY...91
8 Future research... 93
9 References ... 94
Introduction
1 Introduction
Saab AB is a Swedish company which develops advanced technology products for both the civilian market and military market such as Gripen aircraft and military training simulator systems [1]. All together the company consists of five business areas, all divided into divisions.
This thesis is done at Avionics Division of Saab AB. Two examples of what the Avionics Division produces are RIGS a head-up display for civilian aircraft, which makes it possible for the pilot to land in complete fog, and a mechatronic high lift system for commercial airlines. These products are built with world leading solutions and the requirements on their electronics are high. To manage all these requirements and to ensure the robustness of the electronics Avionics Division uses several software and hardware simulation tools.
Most electronic engineers at Avionics Division simulate their analogue designs with tools like LTSpice and PSpice. These tools are restricted to low-level simulations because they are based on and use Spice as simulation tool. Spice is developed for and can only handle the electronics domain. Simulations of larger designs in various abstraction layers have to be done in other tools like Saber, SystemVision or Matlab with its toolboxes SimElectronics and
SimPowerSystems.
This thesis work is done to strengthen the Avionics Division in its knowledge of hardware modelling and simulation tools. It will also present motives why the Avionics Division will need to model and simulate its hardware even more than is done today.
1.1 Background
A simulation tool simulates and validates electronic circuit design. The simulations provide better understanding of how the circuits will behave in different environments. For example the Avionics Division develops advanced technology suitable for flight safety according to the standards DO-254 and DO-178 [1]. This demands advanced tests of the electronics which also need a longer guaranteed lifetime than 20 years in the rough environment.
To simulate circuits tools as Spice, LTSpice, PSpice and SystemVision can be used. These tools, each one separately, provide knowledge of the behaviour of the simulated circuit, which gives opportunities to make the design robust and save development time. The time is saved due to that the simulation is faster done with a simulation tool in a computer than by building and evaluating the circuit in reality [2].
The use of Monte Carlo and Worst Case analyses along with statistical tools helps the engineer predict how the circuit will behave after it has been
manufactured and helps to ensure the maximum production yield [2][3]. Each of the tools mentioned above has its own pros and cons and in this thesis the different tools will be compared and evaluated.
1.1.1 How a simulation can be done
In this section a brief explanation of how a simulation can be done is given. The first step, when to do a simulation, is to identify the circuit or the function of the circuit that needs to be simulated. If the identified function for example is a filter, all the filter characteristics need to be set. The filter characteristics are tested using Matlab.
The second step involves selecting a simulation tool. The selected tool needs to handle all the desired analyses as well as it has to have all the component models. If some models are missing they need to be downloaded or created. It is important to identify all the characteristics of the component that are needed for the specific simulation. Most simulations only need certain subsets of the component’s characteristics. The paper ‘How to Model Power Systems’ [4] illustrates the problem through an example where a 10 kΩ resistor is simulated. The first question asked is what a resistor really is? A device which simply obey ohms law or does the resistance change as a function of the
temperature? Even if the resistor changes as a function of the temperature, does the resistor change its values within the simulation? The second question is if the resistor is exactly 10 kΩ? The actual resistor used in the complete system has a tolerance of +/- 1 %. If all this is considered before the component is modelled it makes the modelling and the simulation easier. The simulation of the circuit will also be faster if the calculations that are not needed are not calculated [4].
The third step when simulating a circuit is to prepare the circuit or the function in the schematic of the chosen simulation tool. After the schematic has been created select the desired analysis and simulate the circuit. Depending on what analysis is chosen and the performance of the simulating computer the results will be presented shortly.
The fourth step is to evaluate the circuit or the function by comparing the result of the analysis with the requirements in the requirements document. If there is any divergence the circuit needs to be complimented or changed or some of the components need to be replaced. All in order to get the desired circuit or
function to work as expected. After the changes have been done it is
recommended to simulate the circuit or the function once more to secure that the desired result is attained.
Introduction
The fifth step is to simulate the circuit with statistical analyses as the Monte Carlo analysis or the Worst Case analysis. The statistical analyses are used to guarantee the robustness of the circuit. If necessary both step four and five is repeated until the results are satisfying.
The sixth step involves producing the hardware and testing it in the lab. The test results from the lab are compared with the results from the simulation. If anything diverges go back and do the needed alternations. Finally the circuit will be robust enough, fulfilling all the requirements. Then it is ready for production in full scale.
It is important to follow up the simulations done even after the circuit has reached the market. This involves securing that the simulations and calculations were correct and taking advantage of the work done for future simulations.
1.2 Purpose and aims
The purpose of this thesis work is to strengthen the Avionics Division’s
knowledge of hardware modelling and simulation. To achieve this, the motives for why and how the Avionics Division ought to model and simulate its
hardware must be identified. This is done through a questionnaire, identifying simulations done today and expected simulations in the future.
Based on the results of the questionnaire the next aim of this work is to present different simulation tools which might be suitable for the Avionics Division. This part includes a presentation of the capabilities and functions of each tool. To strengthen the knowledge even more an aim of this thesis is to implement one of Avionics Division’s already existing designs into Mentor Graphics modelling and simulation tool SystemVision and evaluate if that tool fits Avionics Division’s development flow. The tool fits the flow if there are possibilities to simulate the same design as is used on the printed circuit board (PCB). It was predetermined by Avionics Division that SystemVision was to be used for this part of the thesis work.
1.3 Delimits
There are several different tools on the market for modelling and simulating electronic circuits. In this thesis only Spice, LTSpice, PSpice and SystemVision are analysed and compared. In the final part of this thesis only SystemVision is used to implement an existing design to test the workflow. Both these
limitations are done due to limited time.
At Avionics Division a commonly used simulation tool is HyperLynx.
HyperLynx simulates the circuits on the PCB and targets other aspects than the tools analysed in this thesis. Therefore it is not included in this thesis even though it is commonly used.
The limitation of time also results in that the check of how accurate the models of for example a transistor in the model library are against the reality is
skipped. Still there will be some kind of control against reality due to the comparing between tools. Different tools use different libraries to model the components and when the tools calculate the tests they sometimes use different algorithms to get the same result. If the results from the different tools do not correspond, it indicates that something is erroneous.
This thesis will not cover the standards DO-254 and DO-178 even if they are almost exclusively used in Avionics Division’s circuit designs. The standards are so complex that it is not possible to take them into consideration given this work’s time limits. Much of the work in this thesis will however discuss areas relating to the standards, but nothing specific will be pointed out or described within the context of the standards.
1.4 Method
The method used in this thesis is based on a project plan from Avionics
Division. The project plan describes what this thesis should contain. The thesis work started out with an initial study of Avionics Division’s needs, following the specified elements of the project plan. The initial survey was carried out as a questionnaire and can be found in Chapter 3. In section 1.4.1 a more detailed description of the method used for the questionnaire is given.
The project plan also states that a tool analysis is to be done. The tool analysis started with a literature study of different simulation tools, analyses and
electronics’ theory. The literatures were chosen based on their contents and its availability. A list of the literature is found in Chapter 9.
An empirical study of the tool SystemVision was also performed. An
installation of the DxDesigner tool and the SystemVision tool was first done. An existing design was than imported from DxDesigner into SystemVision and the tests were performed. The case study of the tool SystemVision is found in Chapter 6.
1.4.1 Survey
For the survey in Chapter 3 a qualitative approach was chosen. The qualitative approach is mainly linked with the interpretivism [5]. The interpretivism tradition of research weight the meanings made by people as they understand their world. The accuracy of the result in the qualitative method is depending on how close to the information source the research is [6].
Introduction
As mentioned before a survey was done to screen the use of simulation at Avionics Division. The survey was done through a questionnaire. A
questionnaire is used when gathering general information. In this case general information about how the simulations are done, what kind of tools is used for it and what kind of simulations are missing. The method selected to collect data about the knowledge of modelling and simulation at Avionics Division was the small purpose sampling method [5]. In the small purpose sampling method the respondents are handpicked due to their knowledge and profession in the area of interest [5].
First the answers to the questionnaire were written into an Excel document to make the answers more viewable. Secondly the answers were analysed to get an overall understanding and the necessary information for this thesis.
1.4.2 Illustrations
The illustrations used in this thesis are given as overall examples and are not supposed to be studied in detail. Therefore the illustrations are neither
described nor explained in detail in the figure texts. The illustrations extend the information in the text with graphical information in order to visualize the meaning of the text.
1.5 Outline
This thesis is organized as follows:
In Chapter 2 an introduction to simulation of electronics is given and different ways of minimizing bugs and fixes are accounted for, illustrating why
simulation is a good alternative when designing circuits. The chapter also describes so called abstraction layers to give the reader a better understanding of how simulations are done with different extent of details. The chapter ends with a description of different types of models which are used by the simulation tools analysed in this thesis.
Chapter 3 contains a study of Avionics Division’s needs for simulation done through a survey. This chapter presents the results of the survey. The survey was carried out through a questionnaire which in its full format is found in Appendix A. The chapter discusses and concludes about the answers.
Chapter 4 gives information about some of the most common analyses that can be performed by simulation tools. The chapter illustrates how the analyses can be done by different simulation tools and also how the results can be viewed. In the chapter the tools LTSpice, PSpice and SystemVision are used for the
illustrations provided. The different tools that handle the analyses are discussed in Chapter 5.
Chapter 5 gives an overview of the simulation tools Spice, LTSpice, PSpice and SystemVision, their functions and capabilities. The different tools are compared with each other and pros and cons with them are given. All this to get a possibility to evaluate the different tools, which is done throughout the text and in the summary found in Chapter 5.5. That section also includes a summary of Chapter 5 in form of a table to make the comparison easy to over look.
Chapter 6 contains a case study of a circuit simulation in SystemVision, based on an existing circuit used by Avionics Division. The case study describes how the tool SystemVision is installed as an overlay installation of DxDesigner. It also describes how the circuit was loaded into SystemVision and how the components were updated to fit the SystemVision simulation. The case study goes on with suitable analyses done on the circuit.
Chapter 7 contains the main conclusions of the whole work and a final discussion.
Chapter 8 gives ideas for future research related to the work performed within this thesis.
Theoretical background
2 Theoretical background
In this chapter an introduction to simulation of electronics is given and
different ways of minimizing bugs and fixes are accounted for, illustrating why simulation is a good alternative when designing circuits. The chapter also describes so called abstraction layers to give the reader a better understanding of how simulations are done with different extent of details. The chapter ends with a description of different types of models which can be used by the simulation tools.
2.1 Introduction to simulation
The simulation tools use models to simulate electronic devices. A model is described in different ways and one way is as a Spice model and another way is as a VHDL-AMS model. The most basic Spice model describes the physical properties of the silicon. These physical mechanisms are used, by the
simulation tool, to calculate the behaviour of the electronic device, as voltage and current, in a specific situation.
The embedded systems of today are highly advanced and it is difficult to take care of every aspect when building an embedded system. Fortunately there is help available. Saber and SystemVision are examples of tools which are simulating hardware, software and mechanical systems in a virtual environment. As Saber writes on its web page ‘Software and hardware development has become so interdependent that maintaining separate development efforts can cost designs 8-20 month’ [7].
Another way to describe the complexity of today’s electronics is to use Moore’s law which indicates that the numbers of transistors which fit on a silicon chip are doubled every 24 month [8]. If a programmer or a hardware constructor shall be able to take advantage of all these new transistors in embedded systems, new ways of working are needed. These new ways of producing code also need to minimize the number of bugs. One solution to produce more code with minimized amount of bugs is to reuse old code. If old code is reused most of the bugs are already found and has been taken care of. Another solution to minimize the bugs in embedded systems is by using advanced tests. Most of the tests today are done at the end of the production cycle when the hardware already is produced and therefore is available for tests. This is a way which is not optimal, as to the possibility to do changes in the design at an early stage. The ordinary way of working is to develop a circuit design, manufacture the board with the circuits on and first at this stage let the tests start. This process is time consuming and all the changes found at this point are expensive to fix. Especially if one of the changes makes it necessary to redesign and reconstruct the whole board.
An alternative to advanced tests, which is supposed to be outmanoeuvring the most advanced tests in the near future, is simulation. There is just one problem; although well developed simulation tools, even today many engineers do not trust the computer simulations. The Spice Circuit Handbook [9] gives an example where the design engineer is shown a computer simulation where the tested circuit has an impedance error. The reaction from the engineer is to check the hardware. Even when the same error is shown by the hardware tests the engineer wants to go on and try to solve the problem in the hardware. If the engineer instead had trusted the computer simulation from the beginning the impedance error could have been solved at an early stage of the development process and before the hardware for the test was produced.
Yet one way to produce code with minimized number of bugs is to simulate the hardware by a computer using Monte Carlo analysis. The Monte Carlo analysis tests several parameters of one or several components and returns a statistical overview of the component’s results. The components can be analysed by the Monte Carlo analysis without any damages on the hardware or interruptions in the workflow. The simulation tool can by using the Monte Carlo analysis evaluate the circuit faster than it can be evaluated by hand [2].
Another way to minimize bugs is by using a Worst Case analysis. This analysis gives the designing engineer the possibility to evaluate the complete circuit design using all the circuit’s component’s worst case parameters. The test can be done without jeopardizing any circuits or hardware, something that can not be done in reality [2]. The tool can help the engineer to test the circuit, which operates correctly under normal conditions, to secure that it will work normal under all specified conditions [9]. During the test it is possible to analyse the interacting extremes of for example temperature, pressure and radiation.
2.1.1 Simulation today and tomorrow
The usual way to simulate a mechatronic system is by using several simulation tools, one tool for each part of the system. Typical parts of a mechatronic
system are the electronic part and the mechanic part. In the electronics there are analogue, digital and mixed signals. The electronics are usually simulated by a Spice tool. The mechanical parts are mechanical, electro-mechanical, magnetic and electromagnetic [3] and are usually simulated by Matlab.
The different simulation tools are isolated from each other which lead to that each tool requires its own time when modelling the simulation. Unfortunately the models can not be transferred between the tools due to lack of
standardizations. This makes all the setups time consuming. Even do the
modelling in different tools is time consuming by itself there is lot of time to be saved compared with building and testing a real product, which as said is the traditional way to test a system.
Theoretical background
The forthcoming way of simulation is tools which perform analyses in several different areas of the system during the same simulation. This means that it is enough to model the system once and that the hardware, the software and the mechanical designer each can test their own part of the system on a virtual environment at an early stage of the development process [3]. During the development process the models of the system are getting more and more accurate due to that all the involved engineers contribute with their parts and that the models are getting more detailed for each part. The forthcoming tools can simulate the electronics and the systems in all abstraction layers and even at different abstractions layers at the same time.
To minimize the time to market the companies need to start testing their systems earlier in the designing process than done today. This will save lot of time as the time it takes to make a change is growing exponential with how long in the designing process the bug is found and due to how many design stages need to be redone [10]. To minimize the changes at the end of the development process and to save expensive development time the tests and the development need to run concurrently. It takes less time today to sell the first one million units then 25 years ago [11].
Benefit by simulating the electronic systems are not just the time, it even improves the system quality. The improved quality is achieved when the system can be tested and designed concurrently making it possible to achieve a final product with minimized amount of bugs and fixes.
2.1.2 Sources of errors when simulating
Even if the computer simulations are close to the reality they do not replace the hardware tests completely. There are several situations where a simulation tool does not give a correct picture of the circuit and a traditional hardware test may be a good complement. One situation is when the models in the simulation tool use incorrect characteristics compared to the real component. A simulation with incorrect models will provide faulty results.
Another situation is when the used simulation tool does not have the correct formulae or when the formulae do not completely cover the whole simulated algorithm or when the formulae do not manage the complete situation
Yet another situation is when the simulation is done the wrong way. When for example all the aspects are not taken care of, such as wrong impedance
between the stages in the simulated circuit, or when the simulations are done incorrectly by the simulating engineer. An incorrect simulation will of course provide incorrect results when comparing with reality.
2.2 Abstraction layers
The simulation tools which are studied in this thesis manage to simulate the electronics in different levels of details. These levels are often in literature represented by different so called abstraction layers. To clarify the terms of abstraction layers several conceptual frameworks have been developed and one example is the Y-chart diagram illustrated in Figure 1. The Y-chart diagram was first invented in 1983 and uses three domains where each domain is focusing on different aspects of the model [12][13][14].
Figure 1: A visual view of the abstraction layers in a Y-chart diagram [15].
The domains described in the Y-chart diagram are the Behavioural, the Structural and the Physical domain. Each of these domains is in itself divided into several levels of abstraction where the lowest level and also the most detailed level is in the middle of the Y-chart diagram.
Theoretical background
As an example to visualize the Y-chart diagram the book “The system
designer’s guide to VHDL-AMS” [14] gives an analogue circuit described by the algorithms and the circuit’s characteristics. The algorithms of the circuit are placed in the outer end of the behavioural domain of the Y-chart diagram. If the analogue circuit is an amplifier or a filter, the circuit’s function can be
described as a transfer function or a mathematical description which is placed in the middle of the Y-chart diagram in the behavioural domain.
The transfer function can be divided into a set of so called macro models which are more detailed than the transfer function and therefore closer to the centre of the Y-chart diagram. The macro models can further more be divided into even more detailed models, so called micro models. The micro models are placed in the centre of the Y-chart diagram as they describe the silicon of the circuit. The most detailed extent as possible.
2.2.1 Abstraction layers in Spice
When simulating electronic devices by a computer the most commonly used tool and de facto standard is Spice. The Spice tool used today manages simulations in several abstraction layers. The model on the lowest layer of Spice describes the silicon inside the plastic chip. When this model is used the simulation is performed at the lowest level of the physical domain in the Y-chart diagram. This is illustrated in Figure 1.
To gain understanding it is preferred to use a higher abstraction layer when simulating [4]. Even when the computer is calculating the simulation the higher level of abstraction is preferred because of the minimized number of
calculations. New tools and modelling languages are developed to be able to simulate at higher abstraction layers. New languages like Mast and extensions on VHDL as VHDL-AMS are able to model components and circuits at several abstraction layers in all domains.
2.3 Spice models
As mentioned before the Spice tool is commonly used for simulation. When simulating circuits with Spice the simulation tool can use different models of the same component. The different models are used depending on what simulation or which analysis is done [10]. An example is when simulating an operational amplifier within a filter. To calculate a filter the needed number of calculations is mostly related to the frequency. Simplifying the operational amplifier model minimizes the number of calculations necessary and makes the high frequency filter possible to simulate within a realistic period of time.
Another example is when simulating the same circuit but with different analyses. For example when simulating a switching power supply with the transient analysis there is something happening in a near future. This is more important than the switching, why the switching does not need to be so
accurate. Opposite, in an AC analysis the frequency response is the target and then the most important thing is the switching part, why a model must be chosen that returns high accuracy.
When simulating a passive component the Spice models often only handle a certain range of the frequency band. The Spice model for example does not include parasitic elements like equivalent series resistance or parasitic
inductance. The parasitic elements derive from the components’ leads and its packaging which make them unavoidable and dependent on the package [10]. The parasitic elements, which are illustrated in Figure 2, can dominate the simulations so to skip them when simulating is a disaster. To include these parasitic elements would however be incorrect as they would make the model too complex and the simulation overloaded with unnecessary calculations. The parasitic elements must however be included when they are justified and it is up to the simulating engineer to know when.
Figure 2: A model of a NPN transistor (Q1) with parasitic elements (all other parts).
The electronic circuits are always modelled over a finite range of frequencies in Spice due to the complexity and the unnecessary information. Even the nodal equations that the Spice tools use when calculating the transient analysis are not valid in the whole frequency range [2].
Theoretical background
The electronic device manufacturer does not always publish a correct Spice model or does not publish all data about an electronic device. These two things can make the simulation models incorrect [3][4]. If the model does not exist in the simulation tool it is often easier to reparameterize a similar model or
functional equal model than to create a complete new model. It is also to prefer to change the model description before creating a complete new model to make sure that no parameter is missing [4].
The commercial Spice tools are enclosed with, depending on which tool, several hundreds of models. The enclosed models are widely used in many simulations which make them very precisely. Depending on the extent of details of the model it relies to one out of three kinds of Spice models; micro, macro or behavioural model.
2.3.1 Spice micro model
The most accurate way to describe a silicon device is named a micro model. The micro model is modelled exactly as the silicon and is usually used by the silicon manufacturer to build new components as they serve as blueprints for the components [10][16]. The manufacturers of the silicon devices do not often provide the micro model to buyers because it contains the complete silicon model [10]. The micro model is therefore exposing too much information to the competing companies within the electronic industry. Examples of parameters which are deliberately left out are carrier lifetime, doping concentration and mobility [16].
The micro model is the most accurate model and also the most time consuming model to use when simulating [10]. The micro model is time consuming due to all the calculations that need to be done to get the results. As the model is very detailed it is placed in the centre of the Y-chart diagram which is illustrated in Figure 1.
2.3.2 Spice macro model
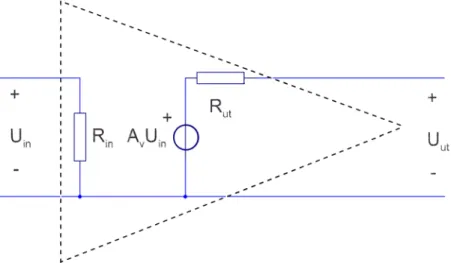
In the middle of the physical domain in the Y-chart diagram a simplified model of the micro model usually called a macro model can be found. A macro model of an amplifier is illustrated in Figure 3. The illustration describes an
operational amplifier where the gain is modelled by a gainer and the Rin is an
ordinary resistor which has the same resistance as the operational amplifier. The Rout is modelled by a resistor in series with the output [10]. Through doing
the simulation this way it is possible to save many time demanding calculations as the operational amplifier as a micro model would have contained hundreds of transistors but as the described macro model contains no transistors. This simplified model can be used, among others, to simulate the gain in the circuit [10].
Figure 3: A macro model of an operational amplifier which normally contains several hundreds transistors.
2.3.3 Behavioural model
When simulating big circuits the run time of the simulation can vary from several hours and up, depending on the circuit. To avoid very long calculation times there is an alternative to the micro and macro models, if the simulation does not need complete accuracy. This alternative is usually called the behavioural model.
The behavioural model describes the behavioural of the model as a transfer function [10]. The transfer function describes the connection between input and output as a Laplace transform. The simulation tool can make a transfer function of an ordinary model called Transfer function analysis. The transfer function model can then be used by the simulation tool as a behavioural model to simplify and minimize the number of calculations, speeding up the simulation time needed.
An example is when constructing a filter. The filter properties can be described with a transfer function instead of calculations for each and every device in the analogue filter. Many calculations can therefore be skipped during the
simulation which will contribute to speed up the simulation time.
2.4 MAST
When simulating circuits the Spice models are not flexible enough to model all desired combinations. To extend the models and make them more flexible new model languages have been created.
Theoretical background
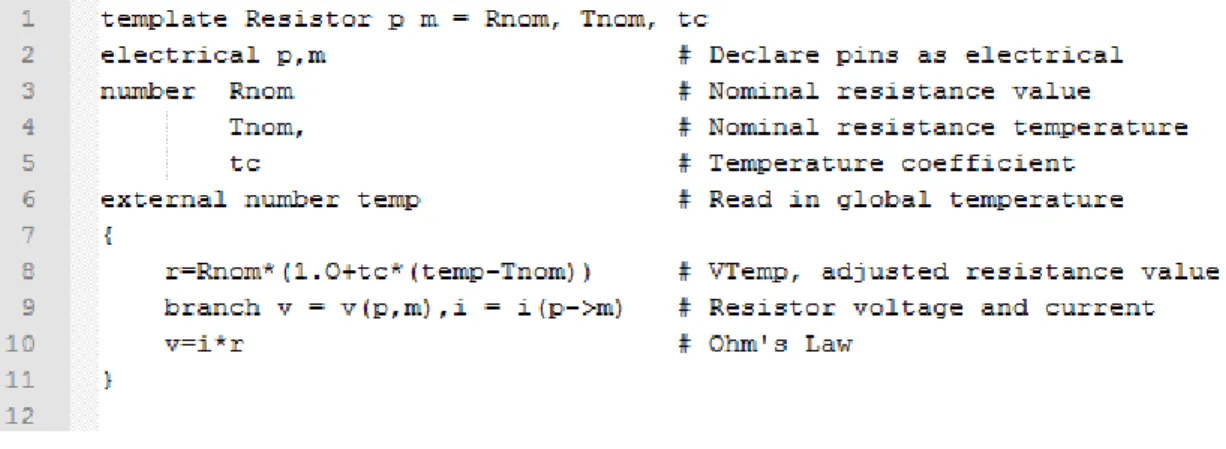
The MAST hardware description language was first released in 1986 by a company named Synopsys. MAST is able to model both analogue and mixed signals and models both analogue and driven behaviour. An event-trigged model is a model where there is no need to calculate until a special event occur. An example of an event-trigged model is a voltage comparator [7]. MAST is mostly used by IC suppliers, ASIC vendors and EDA tool providers and uses an interface to access C++ and FORTRAN routines within a model. The routine helps to reuse existing models from other languages. MAST uses hierarchy when modelling and it encourages reusing old models, which is seen as an advantage. MAST manages several areas when simulating such as
thermal, mechanical, hydraulic and optical systems. The language also handles S-domain and Z-domain models. All the models can be described in their native units [7]. An example of a MAST model is given in Figure 4 where a resistor is modelled with temperature effects added.
Figure 4: A MAST model of a resistor with temperature effects added.
MAST models are stored as ASCII files and are possible to encrypt. The ASCII coding makes the models easy to exchange between computers. The parameters are defined in three ways; predefined, custom or correlations [7]. MAST
provides features for statistical analysis but to be able to do this kind of advanced simulations the models need to be prepared in advanced with the correlations defined parameters.
2.5 The VHDL-AMS model
VHDL-AMS is an extension of the programming language very high speed integrated circuits hardware description language (VHDL) with features to model analogue signals. VHDL-AMS is an Institute of Electrical and Electronic Engineers standard (IEEE 1076.1-1999) and has several useable packages to make models of electronic devices. Examples of these packages are electrical_systems, mechanical_systems, fluide_systems, thermal_systems, math_real and fundamental_constants [14].
The electrical_systems package for example contains models of electronic devices and uses types like voltage, current, charge, resistance, capacitance, inductance and flux. These types are helpful when modelling the components in VHDL-AMS. The modelling and simulations in VHDL-AMS can be done in several abstraction layers at the same time which is an advantage.
The VHDL-AMS models can handle different amounts of characteristics
depending on the performed simulation. The different amount of characteristics can be used when for example a simulation is done on a switched power stage. A switched power stage uses switching at the rate of 100 kHz or more which makes it possible to save many calculations through using a transient analysis. Almost the only situation when a model needs to have all its characteristics is when it is used in a library. This is because that it will be used in many
different projects and serves many different situations and that it needs to be as accurate as possible [4].
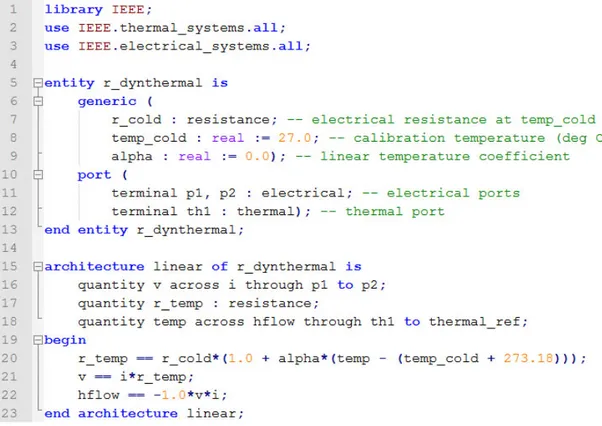
A VHDL-AMS model can in the electrical domain simulate the behaviour of a single resistor up to a complete circuit with several hundred transistors as operational amplifiers. The modelling engineer using VHDL-AMS builds the complete component algorithm and has full control of how the components are simulated and how accurate the models are. An example of a VHDL-AMS model is given in Figure 5 where a resistor is modelled with temperature effects added. In Figure 4 the same model is shown as a MAST model.
Theoretical background
The big difference between models which are Spice based and VHDL-AMS based is the way of providing the mathematical formulae when calculating the circuits. The Spice tools are distributed with all the needed formulae and the Spice models contains all characteristics to the formulae. In VHDL-AMS all the formulae are provided within the model of the component. This is
illustrated in Figure 5, where the formulae to calculate the resistor is located from line 20 to line 22. The tool uses these formulae to calculate the values.
3 Survey
In this thesis a study of Avionics Division’s needs for simulation is done through a survey. This chapter presents the results of the survey. The survey was carried out through a questionnaire which in its full format is found in Appendix A.
Each of the following sections, except Section 3.1, relates to one question. First a background to the question is given, upon which the question itself is
recalled. After the question some of the answers follow, summarized and rewritten. Last under each section is a short analysis of the answers to the specific question. The chapter ends with a conclusion. The result of this analysis is used when the comparison is done between the simulation tools in Chapter 5.
The complete results of the survey are only exposed to Avionics Division due to confidentiality. The answers to each question are therefore summarized in the following text in this chapter.
3.1 The accomplishment of the questionnaire
As already mentioned the survey was done through a questionnaire. A
questionnaire is used when gathering general information. In this case general information about how the simulations at Avionics Division are done, what kinds of tools are used for it and what kind of simulations are missing.
The method selected to collect data is the small purpose sampling method. In the small purpose sampling method the respondents are handpicked by their knowledge and profession in the area of interest [5].
The questionnaire consists of two different types of questions. The first type of question is a closed question. At the closed question the respondent is presented with a number of alternative answers. The respondent can choose to mark zero up to all the alternative answers. The advantage with a closed question is that it guides the respondent’s answers which clarify the kind of answers sought. The closed question type can be used to collect quantitative data [5].
The questionnaire also uses open questions. The open questions generate qualitative data which gives the quantitative data a supplement. The open questions are used to get the respondent’s own word in reply. The advantage when using open questions is that the answers are qualified and that they let the respondent answer the questions precisely. Another advantage is that if the respondent do not understand the question it will be clear through the answer. The open question type can be used to collect qualitative data [5].
Survey
A disadvantage with using a questionnaire is that the response rate tends to be low. Another disadvantage is the difficulty to get a cross-section of the
population. To avoid a low response rate the questionnaire used for this thesis was introduced during an oral presentation of the subject and followed up by several reminders of the importance in answering. The questionnaire was also directed to handpicked persons which makes the response rate higher [5]. The questionnaire was sent out to 32 respondents where of 24 were
handpicked. 13 of them answered. There were answers from pure analogue engineers as well as pure digital engineers. The answers from the pure digital engineers will make the answers look odd but can be valuable for the result where as a pure digital engineer is used to different simulation tools than those only working with analogue electronics.
3.2 Type of hardware designed today
The first question is asked to gain knowledge of what type of hardware the respondent is designing today. The knowledge is used to define what type of simulations the chosen tool must be able to manage. The question is a closed question and reads:
The answers show that all three categories are represented at Avionics Division and that it is important that the simulation tools manage all three types of hardware. This indicates already at this stage of the thesis work that the chosen simulation tools need more features than today’s commonly used Spice has to offer and that newer tools which also handle mixed signals are to prefer. A deeper analysis of this will be performed in Chapter 5.
3.3 Thoughts about simulating hardware
The second question is asked to gain knowledge of what the respondent thinks about simulation. The response to this question is used to collect thoughts and ideas about simulation and simulation tools from the respondent. The question is an open question to allow the respondent to express his or hers thoughts and reads:
The response to this question is divided into three parts: Purpose of simulation, Wish list for future simulations and Pros and Cons with simulation. In section 3.3.4 conclusions of all the answers are given.
3.3.1 Purpose of simulation
Some of the answers to the main question were related to what simulations are used for today. Here follows a summary of the answers:
• To confirm functions and solutions of circuits.
• To verify how circuits behave in different environments.
• To make it possible to switch the characteristics of the device during the simulation.
• To use the simplicity of building the circuits in the computer environment instead of on a breadboard or in the lab.
3.3.2 Wish list for future simulations
Some of the answers to the main question were related to thoughts about future simulations. Here follows a summary of the answers:
• Positive if only one simulation tool could manage all simulations. • Positive if the tool could model and simulate the complete mechatronic
system and especially in the transient mode.
• Positive if the tool could simulate circuits on a higher level of abstraction.
• Positive if the tool could simulate circuits not only in the ambient temperature (27 degrees Celsius) but also in the upper and lower extremes to ensure the robustness of the circuits.
• Positive if the tool would include models of small designs ready to use in new designs.
3.3.3 Pros and Cons with simulation
Some of the answers to the main question were related to Pros and Cons with simulation. Here follows a summary of the answers:
• It is positive to be able to secure that the circuit is correct with no bugs. • It is positive to be able to avoid lengthy and costly integrations or
quality problems.
• It is positive to be able to avoid costly investigations on complete PCB with bugs.
• A disadvantage is doubts about the usability when simulating large complex designs.
• Another disadvantage is that it takes much effort to get relevant data to put into the simulations and to interpret the output data.
Survey
• Yet another disadvantage is difficulties to verify the correctness of the models.
3.3.4 Conclusions
Conclusions drawn from the answers to question number two are that the chosen simulation tools need to handle advanced simulations and that the tools need to be simple when changing the characteristics of the simulated
components. The tools also need to illustrate the behaviour of the circuit in a simple way and give the possibility to measure not only the most obvious values but also values which can be unmeasurable in a real lab environment. Other conclusions drawn from the answers are that there is a need of
simulations in both the upper and lower temperature extremes and that the tool should have small circuits that could be used and modified.
This thesis will use the answers and these conclusions when illustrating and discussing the simulation tools in Chapter 5. Still it is possible to already now state that the most of the tools today manage all these requirements but that their interfaces differ.
3.4 Complexity and level of the hardware design
The third question is asked to gain knowledge of how complex the hardware is that the respondent is designing today. The knowledge is used to decide how advanced the simulation tools at Avionics Division need to be. The answers are used when the simulation tools are selected for the following tool analysis. The question is an open question but includes frames of reference to guide the respondent’s answer and reads:
The gathered response to this question decides which types of analyses are needed. The answers illustrate that there are varying complexity of the circuits that are simulated at Avionics Division today. The simulation tools must therefore handle both the most basic simulations and more complex ones.
Some example of simulations that the simulation tools need to manage are several operational amplifiers, mixed signals, DC/DC transformers, complete high power module and simulations of complete systems. The answers also show that the simulation tools must be able to simulate digital IC, signal integrity, DC-drop, crosstalk and rise and fall time. The last examples of
simulations must be done when the PCB has been drawn up and is therefore not part of this thesis.
The conclusion drawn from the answers is that the chosen simulation tool needs to be advanced or that several complementary tools need to be available to cover all possible simulations.
3.5 Experiences from simulating hardware
The fourth question is asked to gain knowledge of the experiences that the respondent has from simulation today. The question is divided into several subquestions: Simulation of hardware today, Used simulation tools, Properties observed, Simulation of functionality and Lack of hardware analysis. In
Section 3.5.6 conclusions are given.
The knowledge is used when the simulation tools are selected for the following tool analysis, which is done to define the capabilities of each tool. The main question reads:
3.5.1 Simulation of hardware today
The first subquestion is an open question to allow the respondent to express the experience of simulation today and reads:
The response to this question decides which types of analyses the tools need to manage or replace or extend. The response tells that the circuits are both tested in the lab and calculated, often by hand. The response to this question also shows that the simulations are done on smaller parts of the circuits instead of on the complete circuit. Examples of properties that are measured are timing, length of wires, load on busses, fast interfaces and crosstalk.
Survey
3.5.2 Used simulation tools
The second part of the question is asked to gain knowledge of the tools used today when simulating the circuits. The question is an open question to allow the respondent to express all the tools used and it reads:
The response to this question gives knowledge of what tools the circuits are simulated with today and what kind of analyses the tools need to replace or extend. The answers collected show that the tools LTSpice, PSpice,
HyperLynx, ModelSim and Excel are used.
3.5.3 Properties observed
The third part of question number four is asked to gain knowledge of the
properties observed today when simulating the circuits. The question is an open question to allow the respondent to express all the properties observed and it reads:
The response to this question decides which types of properties the simulation tools need to manage. Here follows a summary of the answers:
• Transient analysis • Phase margin
• Sensitivity to variations in component’s value • Power dissipation
• Crosstalk • DC-drop
• Undershoot and overshoot • Rise and fall time levels • Frequency response
• Phase and amplitude margins • Voltage and current levels • Input and output limits • Signal distortion • Reflections
• Timing
• Propagation delay • DC-levels
3.5.4 Simulation of functionality
The fourth part of question number four is asked to gain knowledge about if the respondent simulates functionality in his or her simulations. The knowledge is used to define today’s needs for simulation of functionality. The question is a closed question and it reads:
The gathered response to this question decides if the chosen simulation tools need to be able to simulate functionality. The collected answers show that not all of the engineers at Avionics Division simulate functionality.
3.5.5 Lack of hardware analysis
The fifth part of question number four is asked to gain knowledge about if there is any lack of hardware analyses when simulating today’s circuits. The
knowledge is used when the simulation tools are analysed to see if there are tools available that can meet the needs. The question is an open question to allow the respondent to express all the missing analyses with own words and it reads:
The response to this question shows if there are any missing analyses which could help when simulating circuits. Here follows a summary of the answers:
• Integration between the complete circuit boards. • Not analysis but lack of models.
• Probability estimation with help of experience. • PCIe and RapidIO when using SPICE-files. • Systematic tolerance analysis.
• Function simulation of analogue functions.
• Integration (digital against switched power supply). • Power qualities.
Survey
3.5.6 Conclusions
Conclusions drawn from the response to the first subquestion are that the chosen simulation tools need to be able to extend the tests done in the lab and to give the engineer a tool that in a simple way extends or replaces the needed calculations. The tools also need to be able to simulate larger circuits to extend today’s simulations.
The conclusion drawn from the answers to the second subquestion is that most simulations today are performed in LTSpice and that a few simulations are done with the tool HyperLynx. The chosen simulation tools need to be able to extend or replace the tests done in LTSpice and HyperLynx. The tool
HyperLynx is as described earlier not part of this thesis.
The conclusion drawn from the answers to the third subquestion is that the chosen simulation tools need to be advanced and able to simulate the circuits in all their stages from the first small circuit till when it is drawn on a PCB.
The conclusion drawn from the answers to the forth subquestion is that the chosen simulation tools need to handle functionality simulations.
The conclusion drawn from the answers to the fifth subquestion is that the chosen simulation tools need to be able to extend the simulations done today as the respondents according to the answers lack several hardware analyses.
3.6 Ensuring accurate data
The fifth question is asked to gain knowledge of how the respondent ensures that the data from the simulations done today are accurate. The response to this question is used to investigate if the analysed simulation tools can extend the simulation accuracy. The question is an open question and reads:
The response to this question shows if there is anything which helps to gain the accuracy when simulating the circuits. Here follows a summary of the answers:
• Checks correlations against a special test rig. • Compares the result with theoretical calculations. • Compares with datasheets.
• Hardware measurements in the laboratory. • Board level tests.
The conclusion drawn from the response is that the chosen simulation tools should be able to extend the simulations and compare the results against the results from the lab. Another conclusion is that the chosen simulation tools should help the engineer to extend or replace and automate the needed manual calculations in a simple way.
3.7 Ensuring enough data
The sixth question is asked to gain knowledge of how the respondent ensures that the simulations produce enough data. The response to this question is used to investigate if the analysed simulation tools can extend the simulation
accuracy. The question is an open question to allow the respondent to express his or hers thoughts and reads:
The response to this question shows if there is anything which helps to gain the accuracy when simulating the circuits. Here follows a summary of the answers:
• Ensure correct setup in the tool. • Have knowledge about the tool. • Make variation in the steps. • Use the engineer’s experience.
• The simulations do not get better than what is put into them.
The conclusion drawn from the answers to the sixth question is that each of the chosen simulation tools should be able to do the same simulation in different ways to ensure the correctness of the simulation. Another conclusion is that the chosen simulation tools should help the engineer to ensure that the simulation is simulating the circuits correct. Yet another conclusion is that the engineer needs experience and knowledge about the tool, this is why education in the chosen tools is important.
3.8 Ensuring accurate models
The seventh question is asked to gain knowledge of how the respondent
ensures that the simulations use correct models. The response to this question is used to investigate if analysed simulation tools can extend or simplify the tests done to secure correct models. The open question reads:
Survey
The response to this question shows if there is anything which helps to gain the accuracy of the models when simulating the circuits. Here follows a summary of the answers:
• Compares with the hardware result in the lab. • Assert based test benches.
• Simulates the models on the lowest abstraction layer and compares the result with datasheet or real tests.
• Trusts the model if the experience tells that the output is correct.
• Runs simple cases that can be verified from datasheets and calculations. The conclusion drawn from the answers to the seventh question is that the results from the chosen simulation tools should be possible to compare with hardware analyses’ results. Another conclusion is that the chosen simulation tools should have assert based test benches to help the engineer to ensure that the simulation is correct. An assert based test bench is where the model itself flags or stops the simulation if some value is to high or something else is not correct.
3.9 Ensuring the correct formulae
The eighth question is asked to gain knowledge of how the respondent ensures that the simulations use correct formulae. The response to this question is used to investigate if the analysed simulation tools are able to help ensure the use of correct formulae when simulating. The open question reads:
The response to this question shows if there is anything which helps to ensure that the simulation tools use correct formulae when simulating the circuits. Here follows a summary of the answers:
• Checks manuals of how the models are built. • Compares with the hardware result in the lab.
• Runs simple cases that can be verified from datasheets and calculations. • Runs the same simulation in different tools.
• Deepens the knowledge about the models and the simulation tools. The conclusion drawn from the answers to the eighth question is that the results from the chosen simulation tools should be possible to compare with the
hardware analyses’ result. Another conclusion is that the engineer needs experience and knowledge about the tool used, why education is important.
3.10
Needs when simulating the hardware
The ninth question is asked to gain knowledge about the needs for simulating that the respondent sees today. The question is divided into several
subquestions: Internal risk mitigation, Robust hardware, Design reuse, Reduced manufacturing costs, Simplified HW/SW integration, Simulate mixed analogue and digital circuits, Thermal simulation, Rapid examination of design tradeoffs, Validation of requirements by simulation, Simulate glitches, Simulate delay variances, Simulate reliability, error detection and correction and Fault
injection within the simulation. In section 3.10.14 a short conclusion is given. The knowledge is used when the simulation tools are selected for the following tool analysis, which is done to define the capabilities of each tool. The main question reads:
3.10.1 Internal risk mitigation
The first subquestion is a closed question and reads:
The response to this question gives knowledge about if internal risk mitigation is important when simulating. The overall response shows that internal risk mitigation is important at Avionics Division today.
3.10.2 Robust hardware
Survey
The response to this question gives knowledge about if it is important to secure more robust hardware through the simulations. The gathered response shows that it is important to secure robust hardware at Avionics Division today.
3.10.3 Design reuse
The third subquestion is a closed question and reads:
The response to this question gives knowledge about if simplified design reuse is important. The gathered response shows that the majority of the respondents sees a need for simplified design reuse.
3.10.4 Reduced manufacturing costs
The fourth subquestion is a closed question and reads:
The response to this question gives knowledge about if it is important to use simulations as a tool to reduce the manufacturing costs. The gathered response shows that the majority of the respondents thinks that it is important to reduce the manufacturing costs through the use of simulations.
3.10.5 Simplified HW/SW integration
The response to this question gives knowledge about if it is important to simplify HW/SW integration with help of simulations. The collected response shows that the majority of the respondents thinks that it is important to simplify HW/SW integration.
3.10.6 Simulate mixed analogue and digital circuits
The sixth subquestion is a closed question and reads:
The response to this question gives knowledge about if it is important to
simulate mixed analogue and digital circuits. The gathered response shows that the majority of the respondents thinks that it is important to be able to simulate mixed analogue and digital circuits at Avionics Division today. This result will probably be decisive for which simulation tool is to be chosen, as it limits the range of selectable tools.
3.10.7 Thermal simulation
The seventh subquestion is a closed question and reads:
The response to this question gives knowledge about if it is important to do thermal simulations. The gathered response shows that the majority of the respondents thinks that it is important to be able to perform thermal simulations.
3.10.8 Rapid examination of design tradeoffs
Survey
The response to this question gives knowledge about if it is important to do rapid examination of design tradeoffs through the use of simulations. The gathered response shows that the majority of the respondents thinks that it is important to be able to do rapid examination of design tradeoffs.
3.10.9 Validation of requirements by simulation
The ninth subquestion is a closed question and reads:
The response to this question gives knowledge about if it is important to validate requirements already at the simulation stage of the development process. The gathered response shows that the majority of the respondents thinks that it is important to be able to validate requirements using simulation tools.
3.10.10 Simulate glitches
The tenth subquestion is a close question and reads:
The response to this question gives knowledge about if glitches are important to simulate. The gathered response shows that the majority of the respondents thinks that it is important to be able to simulate glitches.
3.10.11 Simulate delay variances
The response to this question gives knowledge about if the delay variances are important to simulate. The gathered response shows that the majority of the respondents thinks that it is important to be able to simulate delay variances.
3.10.12 Simulate reliability, error detection and correction
The twelfth subquestion is a closed question and reads:
The response to this question gives knowledge about if reliability, error detection and correction are important to simulate. The gathered response shows that the majority of the respondents think that it is important to be able to simulate reliability, error detection and correction.
3.10.13 Fault injection within the simulation tool
The thirteenth subquestion is a closed question and reads:
The response to this question gives knowledge about if fault injection is important within the simulation tool. The gathered response shows that the majority of the respondents thinks that it is important to be able to use fault injection.
3.10.14 Conclusion
The conclusion is that all the subparts of the question are important. A note is that not all the respondents answered yes to all questions as they were expected to do.
3.11
Hardware complexity
The tenth question is asked to gain knowledge of the hardware complexity of future simulations. The response to this question is used when analysing and comparing the simulation tools in Chapter 5. The question is an open question to allow the respondent to express the thoughts and reads:
Survey
The response to this question points out how complex the future systems might be that might be objects for simulations. This knowledge helps decide what the chosen simulation tools must be able to full fill, so Avionics Division can be at the frontline of simulation. Here follows a summary of the answers:
• The complete system.
• The complete analogue board.
• Simplified integration between PCB.
• The complete system in a virtual environment. • Connect the electronics to some mechanics. • In all level in the system.
The conclusion drawn from the answers to the tenth question is that the chosen simulation tools shall be able to extend the simulations to larger circuits than today. The future simulations might possibly contain the whole mechatronic system in a virtual environment.
3.12
Other areas of simulation
The eleventh question is asked to gain knowledge of hardware simulation in future simulations. The response to this question is used when analysing and comparing the simulation tools in Chapter 5. The question is an open question to allow the respondent to express his or hers thoughts and reads:
The response to this question points out if there is any other area where simulation could be suitable. Here follows a summary of the answers:
• Requirement validation.
• Worst case execution time estimations.
• Information about cards connected to each other.
The conclusion drawn from the answers is that the chosen simulation tools need to be accurate and able to simulate all possible outcomes in order to validate the requirements already at the simulation stage. Another conclusion drawn from the answers is that the simulation tools need to be able to simulate several cards at the same time.
3.13
Conclusions
Many conclusions could be drawn from the answers to the questionnaire. An overall conclusion is that simulation is a very important tool to secure robust and reliable electronics. This makes it a critical part of Avionics Division’s workflow.
In addition to the overall conclusion it is possible to conclude that the chosen simulation tools need to manage analogue, digital and mixed signals. The tools also need to simulate the circuits in all their stages from the first small circuit up till when it is drawn on a PCB. The tools also need to handle advanced simulations like whole mechatronics systems in virtual environments and extend the today’s simulations with several missing hardware analyses such as Monte Carlo analyses and Worst Case analyses.
Effective ways to secure that the simulation is correct are needed. The tools should therefore be able to do the same simulation in different ways to ensure that the models and circuits are accurate. Alternatively the tools should be able to extend or replace the needed calculations to help the engineer to ensure that the circuits are simulated correct. The tools should also have an analysis that changes the characteristics of the components within a simulation.
Another conclusion is that the tools need to extend the tests done in the lab and that it should be possible to compare the results of the simulation against the lab results. Furthermore the tools should also be able to do assert based tests. It would be positive if the simulation tools could be used for validation of the requirements set by the client.
Yet a conclusion drawn from the answers to the questionnaire is that most simulations today are performed in the tool LTSpice. Changing simulation tool creates a need for education in the new tool as the new tool does not have the same interface even if it is simulating the same thing. As there are difficulties to decide if the simulations are correct, given that the simulating engineer can use both inaccurate models and that the simulation tool can simulate
incorrectly, the experience, education and hardware tests are still important to secure robust and reliable electronics.
This survey is not specific for Avionics Division and the results are relevant in other industrial areas like the car industry and the embedded industry.
![Figure 1: A visual view of the abstraction layers in a Y-chart diagram [15].](https://thumb-eu.123doks.com/thumbv2/5dokorg/5423492.139665/17.892.238.665.533.951/figure-visual-view-abstraction-layers-y-chart-diagram.webp)