Research Institute of Industrial Economics P.O. Box 55665 SE-102 15 Stockholm, Sweden
info@ifn.se www.ifn.se IFN Working Paper No. 1378, 2021
Anticipation of COVID-19 Vaccines Reduces
Social Distancing
Ola Andersson, Pol Campos-Mercade, Armando N.
Meier and Erik Wengström
1
Anticipation of COVID-19 Vaccines
Reduces Social Distancing
*Ola Andersson Pol Campos-Mercade Armando N. Meier Erik Wengström
December 23, 2020
Abstract
We show that the anticipation of COVID-19 vaccines reduces voluntary social distancing. In a large-scale preregistered survey experiment with a representative sample, we study whether providing information about the safety, effectiveness, and availability of COVID-19 vaccines affects compliance with public health guidelines. We find that vaccine information reduces peoples’ voluntary social distancing, adherence to hygiene guidelines, and their willingness to stay at home. Vaccine information induces people to believe in a swifter return to normal life and puts their vigilance at ease. The results indicate an important behavioral drawback of the successful vaccine development: An increased focus on vaccines can lead to bad health behaviors and accelerate the spread of the virus. The results imply that, as vaccinations start and the end of the pandemic feels closer, existing policies aimed at increasing social distancing will be less effective and stricter policies might be required.
*Andersson: Uppsala University, UCFS and the Research Institute of Industrial Economics, Sweden. e-mail: ola.andersson@nek.uu.se. Campos-Mercade: University of Copenhagen, Denmark. e-mail: pcm@econ.ku.dk. Meier: University of Lausanne and University of Basel, Switzerland. e-mail: armando.meier@gmail.com. Wengström: Lund University, Sweden and Hanken School of Economics, Finland. e-mail: erik.wengstrom@nek.lu.se. Declarations of interest: none. We are thankful for financial support from Riksbankens Jubileumsfond and Handelsbankens forskningsstiftelse.
2 1 Introduction
As the global spread of COVID-19 reaches all-time highs (WHO 2020), governments urgently ask citizens to respect social distancing recommendations, such as avoiding in-person contacts and staying home when sick. At the same time, vaccine trials show promising results, and vaccination programs launch earlier than anticipated (Krammer 2020; Gaebler and Nussenzweig 2020). These encouraging news are widely covered in the media, instilling hope that the pandemic will soon be over.
Knowing whether and how the good news about COVID-19 vaccines affects social distancing behavior is crucial to assess the effectiveness of social distancing policies. On the one hand, the prospect of a vaccine means that more careful behavior now will not just delay infection of oneself or others but may prevent infection entirely. Getting information about COVID-19 vaccines may thus foster social distancing if people realize that they only have to make one last effort to avoid infection (Eichenbaum et al., 2020; Makris and Toxvaerd, 2020). On the other hand, a large literature shows that optimism and good mood reduce perceived risks (Lerner et al., 2015), leading to more risk-taking (Haushofer and Fehr, 2014; Cohn et al. 2015; Meier, 2019). If the encouraging news about vaccines make people optimistic and less worried about the pandemic, vaccine anticipation can reduce social distancing. Hence, whether new vaccine information increases or reduces social distancing is an open and important question.
In a preregistered survey experiment, we show that getting information about COVID-19 vaccines and their effectiveness reduces people’s engagement in social distancing and their willingness to stay at home. We also document that people become more optimistic when they learn about vaccines, thinking that the pandemic will be over sooner. Taken together, we find that learning about vaccines makes people optimistic and less vigilant about the virus. Such a vaccine optimism effect
3
may partly explain why many countries have struggled to curb infections during the last months of 2020, as positive news about the upcoming vaccines have filled the headlines. The findings also suggest that the tone and extent of vaccine communication from governments and the media can shape adherence to social distancing recommendations. Perhaps most importantly, our findings highlight that social distancing policies aimed at stopping the spread of the virus will likely be less effective as vaccination programs roll out. Stricter policies might instead be needed as the end of the pandemic starts feeling closer.
By documenting the impact of vaccine anticipation on health behaviors, we complement an interdisciplinary literature that aims to understand how behavioral factors contribute to the spread and prevention of COVID-19 infections (Bavel et al., 2020; Betsch, 2020; Betsch et al., 2020; Briscese et al., 2020; Campos-Mercade et al., 2020; Cappelen et al., 2020; Charoenwong et al., 2020; Clinton et al., 2020; Galasso et al., 2020; Gollwitzer et al., 2020; Rau and Müller, 2020; Thunström et al., 2020). We also add to a large literature studying the role of psychological factors and economic preferences in shaping health behaviors (Maurer et al., 2009; Betsch et al., 2010; Harris et al., 2010; Milkman et al., 2011; Betsch et al., 2017; Brewer et al., 2017; Galizzi and Wiesen 2018; Lau et al., 2019; Schilbach 2019; Korn et al., 2020). Last, we build on previous findings which document important effects of news and information on people’s beliefs and behavior in general (Tonin, 2017; Armona et al., 2019; Haaland and Roth, 2020; Roth and Wohlfart, 2020) and particularly during the COVID-19 pandemic (Ajzenman et al., 2020; Bursztyn et al., 2020; Fetzer et al., 2020; Simonov et al., 2020).
To study the effect of information about COVID-19 vaccines on people’s behavior, we run a large-scale survey experiment with a representative sample of the Swedish population (N=1,617). Using Swedish data is ideal for the purpose of studying social distancing behavior because, despite having similar COVID-19 cases per capita as the US and other European countries, fewer mandatory
4
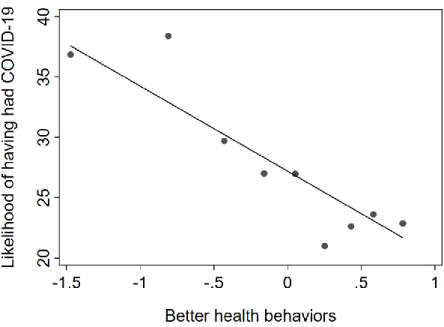
restrictions were in place at the time of data collection. This allows us to study an array of social distancing behaviors, such as avoiding traveling and wearing a face mask, that are fundamental to avoid the spread of the virus. Moreover, Swedes have similar vaccination perceptions to citizens of many other Western countries, such as Germany, the UK, and the US (de Figueiredo et al., 2020). We preregistered the data analysis and collected the data between December 10 and 13, as the first vaccinations with the Pfizer COVID-19 vaccine were taking place in the UK. We measure participants’ social distancing and hygiene behaviors using ten different intended health behaviors, including maintaining physical distancing, washing hands, and staying at home when sick. These behaviors correlate strongly with actual observed behaviors, such as buying a mask and seeking information about the pandemic (Campos-Mercade et al., 2020), as well as with the probability of having had COVID-19 (Fig. S4). We further run a choice experiment where we ask participants whether they would be willing to stay at home under different scenarios, varying the number of weeks they would have to stay at home, the number of hours per week they would be allowed to go outside, and a potential compensation.
Participants in the treatment group are informed about the newly developed COVID-19 vaccines. In particular, we tell them that some vaccines are more than 90% effective, that vaccination has already begun in some countries, and that the EU is expected to approve the first vaccine by the end of December. We then ask participants questions about their intended health behaviors and willingness to stay home. In contrast, participants in the control group answer the questions before receiving the vaccine information. We then compare the health behaviors and willingness to stay home between participants who got the vaccine information before answering the questions, the treatment group, with those who got the information after, the control group.
5 2 Results
2.1 Main Result: Anticipation of COVID-19 Vaccines Reduces Social Distancing
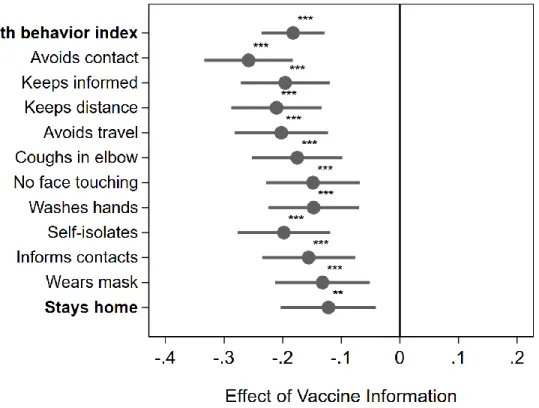
Providing information on the availability and effectiveness of vaccines reduces social distancing. Fig. 1 shows the treatment effects from a regression of each outcome on an indicator taking the value 1 if a participant got the information about the vaccine before answering the questions about health behaviors and willingness to stay at home and 0 otherwise. The regressions control for the preregistered battery of socio-economic and socio-demographic variables (see Tab. S1 for the summary statistics) and the coefficient estimates give the change in the outcome variable in standard deviations. The estimates show that giving information about vaccines reduces desirable health behaviors by 0.12-0.25 of a standard deviation.
We create the variable “Health behavior index” by averaging across the ten standardized health behaviors (non-bold-faced behaviors in Fig. 1, see Fig. S1 for histograms of each behavior). Tab. S12 shows that results are equivalent using the principal component of the ten health behaviors. Using the index of health behaviors shows that health behaviors are worse when participants receive information about a vaccine (p<0.01). The coefficient estimates for each single behavior (non-bold-faced) confirm that this result comes from a uniform shift across behaviors. For example, treated participants are 0.2 of a standard deviation less likely to self-isolate if they would exhibit symptoms of illness tomorrow than participants in the control group.
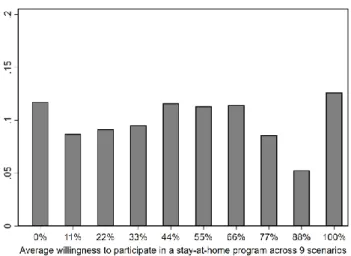
Vaccine information also reduces people’s willingness to participate in a stay-at-home program (Stays stay-at-home), which we measured in a choice experiment containing nine different scenarios (see section Materials and Methods for details and Fig. S2 for a histogram of the willingness to participate). Vaccine information reduces the likelihood of staying at home by 0.12 of a standard deviation, which corresponds
6
to a 4-percentage point lower likelihood to participate in any stay-at-home program (p<0.05, see Tab. S10 for the results using probit regressions instead of linear regressions and including scenario-specific controls, as well as Tab. S11 for the results from linear regressions with the non-standardized outcome). Taken together, all our measures indicate that providing information on the availability and efficacy of vaccines has detrimental effects on health behaviors that are key for slowing the spread of the virus.
Tab. 1 shows the corresponding regression results using the health behavior index and willingness to participate in a stay-at-home program as the dependent variables (for the regression results for each single item shown in Fig. 1, see Tab. S3-S7). The treatment effect estimates for the impact of vaccine information on both outcome variables are all statistically significant and sizable across specifications with or without socio-demographic controls.
7
Fig. 1. The treatment effect by intended health behavior. The grey dots give the estimated difference on the outcome
variables in standard deviations when comparing people who receive the vaccine information after describing future health behavior (Control) to people who receive vaccine information before describing future health behavior (Treatment). The health behavior index captures an average of the following standardized health variables. The first seven non-boldfaced measures are responses to the following questions: “Looking ahead, to what extent do the following statements describe your behavior in response to the outbreak of the coronavirus (COVID-19)?” Avoids contact “I will try to avoid social contacts in person (for example, I will attend fewer social gatherings)”; Keeps informed “I will inform myself about how the spread of the corona virus can be prevented”; Keeps distance “I will keep at least two meters distance from other people”; Avoids travel “I will refrain from private domestic trips outside my home municipality (e.g., to holiday homes and acquaintances)”; Coughs in elbow “I will cough and sneeze into my elbow or a tissue instead of the hand”; Not touching face “I will touch my face less often than usual”; and Washes hands “I will wash my hands more often than usual when not at home”. The three remaining measures are responses to the following questions: “If you exhibited mild symptoms of illness (e.g., coughing) tomorrow, how much do the following statements apply to your behavior in the next two weeks?” Self isolates “I will self-quarantine”; Informs contacts “I will immediately inform people who had contact with me”; and Wears mask “I will wear a mask, or something else to cover my mouth (e.g., a scarf), if I have to leave home”. (Answers on 7-point scale ranging from from 1= "Does not apply at all" to 7= "Applies very much"). Stays home refers to the probability of people voluntarily participating in a stay-at-home program across 9 scenarios (ranging from people taking part no matter what the conditions of the stay-at-home program are, to never taking part) which is standardized to be comparable to the other measures (seesection Materials and Methods for details).
As preregistered, the coefficient estimates are based controlling for gender, 6 dummies indicating age categories, adult income, a dummy indicating unemployment, a dummy indicating children, a dummy indicating single households, a dummy indicating a university degree, and dummies indicating whether people live in a big city/regular city/small city. We present the full set of results for each single item with and without controls in Tab. S3-S7. Fig. S6 shows that the results are equivalent when we drop individuals who filled out the survey in less than 5 minutes.
8
Tab. 1. Treatment effect on the main outcome variables
Dependent variables: Health behavior index Stays home
(1) (2) (3) (4) (5) (6)
Vaccine Information -0.19*** -0.19*** -0.18*** -0.12** -0.11** -0.12**
(0.04) (0.03) (0.03) (0.05) (0.05) (0.05)
Observations 1,617 1,617 1,617 1,617 1,617 1,617
R-squared 0.02 0.16 0.17 0.00 0.02 0.02
Gender Yes Yes Yes Yes
Age Categories Yes Yes Yes Yes
Controls Yes Yes
Note: The table shows the treatment effect estimate for people receiving vaccine information on health behaviors using linear regressions. Higher values in “Health behavior index” indicate better intended health behaviors to stop the spread of the virus. Stays at home indicates a higher willingness to stay at home for the different scenarios in the choice experiment. Age categories include 6 indicators for age categories. Controls include adult income, a dummy indicating unemployment, a dummy indicating children, a dummy indicating single households, a dummy indicating a university degree, and dummies indicating whether people live in a big city/regular city/small city. Heteroscedasticity robust standard errors are shown in parentheses. *** p<0.01, ** p<0.05, * p<0.1
2.2 Vaccine Optimism: People Think the Pandemic Will be Over Sooner When They Receive Vaccine Information
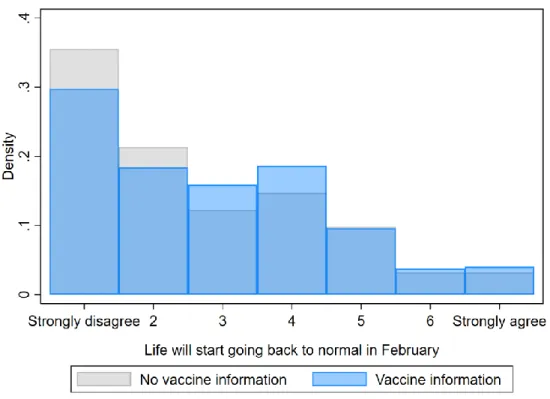
One reason for the change in behavior could be that when people learn about the COVID-19 vaccines, they become more optimistic and feel more upbeat about the pandemic ending soon. To understand how vaccine information affects people’s beliefs, we consider two survey items. The first item measures people’s beliefs about whether life will begin starting to look like normal in two months (February 2021), and the second elicits beliefs about the remaining duration of the pandemic in months (see Fig. S3 for histograms of the items). By comparing answers for participants in the Control group who answered the questions before vs. after receiving the vaccine information, we can estimate the causal effect of vaccine information on their beliefs about the duration of the pandemic and when life will return to normal (for further results see Tab. S8 and S9). Fig. 2 shows the responses for participants who received the information on vaccines in blue and for participants who did not receive the information in grey.
9
When participants receive vaccine information before estimating the length of the pandemic, they think that the pandemic will be over sooner. Receiving vaccine information increases the likelihood that participants think life will start going back to normal in February by 0.15 of a standard deviation (p<0.05) (see Tab. S8). Examining the expected duration in months, we see a qualitatively similar albeit statistically insignificant shift: People with vaccine information tend to think the pandemic will be over sooner (Fig. S5 and Tab. S9). Treatment effect estimates from regressions confirm the visual impression for both variables.
The evidence suggests that people become more optimistic when learning about upcoming vaccines. Moreover, explorative analyses suggest that the optimistic beliefs about the duration of the pandemic correlate with bad health behaviors in the raw data (p<0.05). Taken together, these findings suggest that vaccine news cause optimism about the end of the pandemic, which in turn leads to more risky behaviors.
10
Fig. 2.The figure shows the raw distribution of expectations about when life will start going back to normal across treatment groups. The light grey bars show the density for people who do not receive vaccine information before the question about the duration of the pandemic, whereas the light blue bars show the density for people who receive information before the question about the duration of the pandemic. People respond to the following statement: “In February 2021 life will start to look like it did in February 2020, before the outbreak of the pandemic.” To which they could answer on a 7-point scale from “Strongly disagree” to “Strongly agree”. Regression results confirm the visual impression: The treatment increases optimism about an early end of the pandemic by 0.15 of a standard deviation (p<0.05) (Tab. S8).
3 Discussion
As the global spread of COVID-19 accelerates, encouraging news about the availability and effectiveness of COVID-19 vaccines fill the headlines. Here, we show that such good news lead to a reduction in social distancing and a lower willingness to stay at home. The likely reason is optimism: The participants that we
11
inform about vaccines think that the duration of the pandemic will be shorter. The results are at odds with the behavior that would be expected from forward-looking individuals (Eichenbaum et al., 2020; Makris and Toxvaerd, 2020): In contrast to the first wave, more careful behavior now will not just delay infection of oneself or others but may prevent infection entirely because vaccines will soon be available. Yet, the evidence shows that people behave less rather than more carefully when they expect a vaccine to become available. Our results, therefore, establish a novel behavioral phenomenon, a vaccine optimism effect: The anticipation of a vaccine induces less careful pandemic behavior.
What is the underlying reason for such vaccine optimism effect? A particularly plausible explanation is that good news lead to good mood. Indeed, most news related to COVID-19 are bad news (Sacerdote et al., 2020), so good news can provide a sharp contrast and induce optimism. Consistent with what we find, such optimism could lead to lower worries (Conner and Norman, 2005; Helweg-Larsen and Shepperd, 2001), lower risk perceptions, and less careful behavior (Haushofer and Fehr, 2014; Lerner et al., 2015; Cohn et al., 2015; Meier, 2019). Another plausible explanation is that information about the potential end of the pandemic makes the normal (and desired) every-day life more salient. As has been shown in other contexts (Mischel et al., 1989), such saliency could make people more impatient, worsening their intended social distancing behavior.
The academic implications of our findings are closely tied to their policy implications. Models of disease spread that are used for evaluating policy scenarios may be enriched by incorporating the degree of vaccine optimism in the population. Such incorporation has at least two direct policy consequences. First, the extent and tone of vaccine information, which is partly controlled by the government, could be adjusted. That is, governments could communicate more cautiously about the timing and efficacy of the vaccine program. Second, considering vaccine anticipation has implications for policy interventions. Many governments around
12
the world have closed down public life at the peaks of the outbreak with different restrictions. The restrictions are likely to be the most successful in preventing the spread of the disease, but their effectiveness and their economic costs hinge on the compliance of citizens (Eichenbaum et al., 2020; Farboodi et al., 2020; Garibaldi et al., 2020). Our results indicate that the effectiveness of any given policy may be lower when people anticipate a vaccine. As vaccination programs start to roll out, our results highlight that existing policies may be less effective in stopping the spread of the virus and stricter policies may be required.
4 Materials and Methods
This section contains information about the study design, sample, and statistical analysis. The study was preregistered at the OSF registry (https://osf.io/6wsg7/).
4.1 Data Collection and Sample
We invited a representative sample of the Swedish population (in terms of age, gender, and counties) to participate in the survey experiment. The invitations were sent out by the company Enkätfabriken on December 10-13, 2020.
We obtained 1,617 responses. Descriptive statistics of the sample are presented in Tab. S1. In comparison with the Swedish population, our sample is representative with respect to gender, age composition, and geographic location of households (see Tab. S13).
4.2 Survey and experimental design
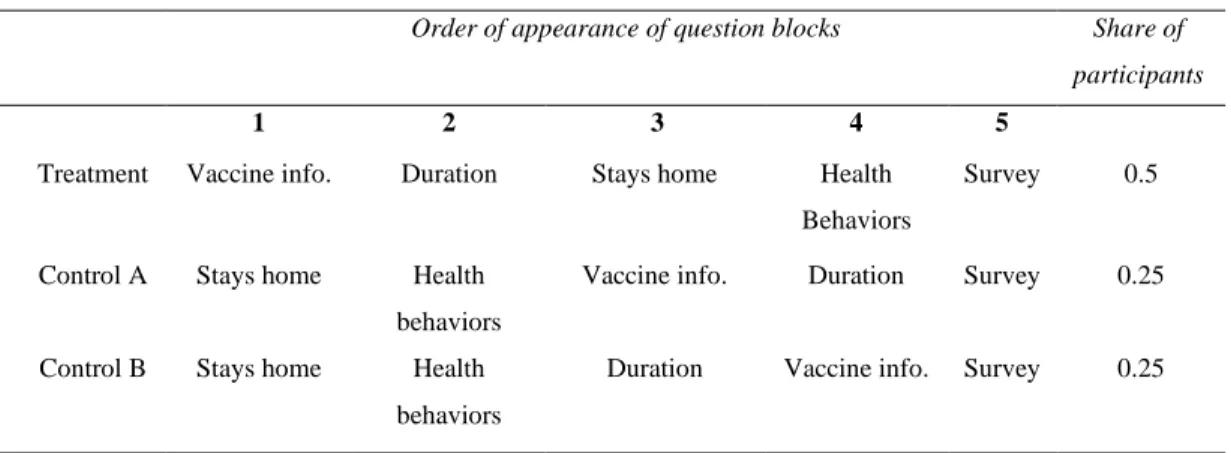
The survey has five parts: Vaccine information (Vaccine info.); Pandemic duration questions (Duration); Choice experiment capturing the willingness to participate in stay-at-home programs (Stays home); Health behaviors; Additional survey questions (Survey). The experiment has three treatment arms that differ only
13
in the order in which the different parts of the survey were presented to the participants. Tab. 2 shows the sequence of question blocks used across the three treatments and the share of participants randomized into each treatment.
Tab. 2. Treatment arms overview
Order of appearance of question blocks Share of participants
1 2 3 4 5
Treatment Vaccine info. Duration Stays home Health Behaviors
Survey 0.5
Control A Stays home Health behaviors
Vaccine info. Duration Survey 0.25
Control B Stays home Health behaviors
Duration Vaccine info. Survey 0.25
Note: The order of questions about the stay-at-home program and health behaviors is randomized
in all treatments.
The main treatment variation comes from the placement of vaccine information with respect to the health behaviors and stay-at-home questions. In the analysis, we compare participants’ responses on health behaviors and willingness to participate in stay-at-home programs between participants who received vaccine information before (Treatment) vs. after responding to the questions on health behaviors (Control A and B). There are no differences in covariates between participants in the treatment and control group, see Tab. S2.
In all three treatments, the order of health behaviors and stays home questionnaire blocks are randomized. Information about the specific parts follows below, and Section 2 of the Supplementary Information contains the exact wording of all questions and information provided in the survey. In the following, we describe each block of the experiment.
14
In this part, we inform subjects about the recent news concerning the efficacy of the vaccine, that vaccination already started in the UK, and the likely timeline of vaccine roll-out in Sweden. After receiving the vaccine information, participants answer questions intended to make sure they had read the information.
4.2.2 Duration: Pandemic duration questions
We ask two questions on how participants assess the duration of the pandemic. The first question asks whether they agree (on a 7-point scale) to the following statement: “In February 2021, life will to a large extent be back to how it was in
February 2020, before the outbreak of the pandemic.” The second question asks: “In how many months do you think the restrictions imposed by the coronavirus will be removed? That is, when do you think life returns to normal in Sweden?” (with
possible answers ranging from 1 to 24 months). We ask these questions to investigate if the vaccine information affects participants’ beliefs and optimism about the duration of the pandemic.
4.2.3 Stays Home: Choice Experiment Capturing the Willingness to Participate in Stay-at-home Programs
We measure participants’ willingness to stay at home using a discrete choice experiment. We ask participants whether they would voluntarily participate in a self-isolation program in which the government would ask them to stay at home for a number of weeks. Nine different scenarios are presented in which we vary the length of the stay-at-home policy, the number of non-working hours they would be allowed to leave their homes, and a potential compensation for participating in the program. The design of the choice experiment is similar to the one used in Andersson et al. (2020).
The primary outcome variable from this part is the average probability of a participant’s (binary) decision to participate (or not) across the nine different proposed stay-at-home programs. We take the average probability and then
15
standardize it, to make it comparable to the health behavior measures. We show results using the non-standardized version and probit regressions in Tab. S10 and S11.
4.2.4 Health Behaviors
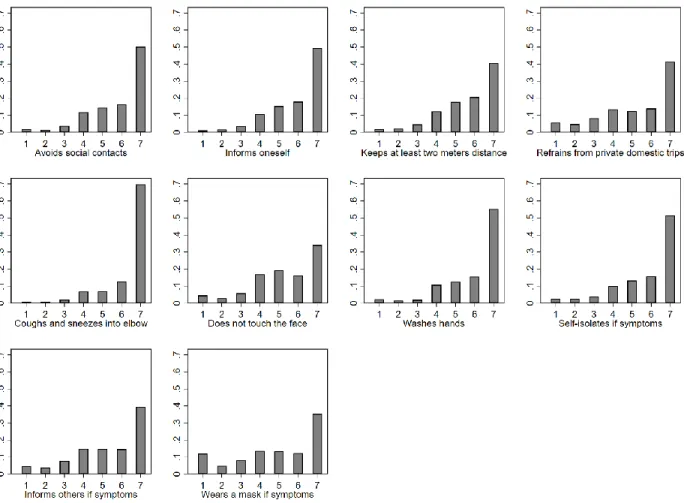
In the health behaviors part, we collect information on ten different behaviors that are important for reducing the spread of COVID-19. They are divided into two sets of questions.
In the first set of questions, we ask participants to look ahead and state to what degree (on a scale from 1 to 7) they will follow seven social distancing and health behaviors: i) avoid social contact; ii) inform myself about how the spread of the coronavirus can be prevented; iii) keep at least two meters distance from other people; iv) refrain from domestic travels; v) cough and sneeze into the elbow or a tissue; vi) touch my face less often, and vii) wash hands more often than usual when not at home.
In the second set of three questions, we ask participants to consider a situation in which they exhibit mild symptoms of illness (e.g., coughing) tomorrow. The participants are then asked to state to what degree (on a scale from 1 to 7) they would in the next two weeks: i) self-quarantine; ii) immediately inform people with whom they had contact with; iii) wear a mask or something else to cover their mouth (e.g., a scarf) if they had to leave home.
We standardize each single item for the analysis and average across all single items to build a health behavior index. We show the results using each single item in Tables S3-S7 and using the principal component of health behaviors in Tab. S12. 4.2.5 Survey: Additional Survey Questions
The last part of the survey contains three additional blocks of questions. One block is related to COVID-19, containing questions about participants’ beliefs, worries, and views on the Swedish response to the pandemic. Another block
16
collects information about socioeconomic status, such as age, education, gender, and housing. The final block measures risk, time, and social preferences using the well-established questions from Falk et al. (2018) and political values.
4.3 Statistical Analysis
Following our preregistration protocol, we study a summary measure of health behavior and participation in a stay-at-home program as the main outcomes. In both cases, we regress the outcome variable on a treatment dummy capturing whether vaccine information was given before or after the measurement of health behaviors and willingness to participate in a stay-at-home program.
We start by presenting parsimonious models without covariates. Following our preregistration protocol, the main model includes the following covariates: a gender dummy, age dummies (39–39 years, 40–49 years, 50–59 years, 60–69 years, ≥70 years), Income per adult, Employed, University studies, One adult in the household, No kids in the household, Big city (>300,000 inhabitants), City (<300,000 and >50,000 inhabitants), Small city (<50,000 inhabitants). Across all regressions we estimate heteroscedasticity robust standard errors.
In line with our preregistration, we also investigate if the vaccine information affects the beliefs about the duration of the pandemic. In this analysis, we use the two measures of pandemic duration as outcome variables and a treatment indicator for receiving vaccine information before answering the questions about duration (as preregistered, we focus on the comparison between Control A and Control B, but the results are consistent when we use the full sample, see Tab. S8 and S9). The treatment dummy thus captures the causal effect of vaccination information on the participants’ beliefs about the duration of the pandemic. The regressions include the same set of covariates as outlined in the main regressions above.
17 5 References
Ajzenman, N., Cavalcanti, T., & Da Mata, D. (2020). More than words: Leaders’ speech and risky behavior during a pandemic. Available at SSRN 3582908.
Andersson, O., Wengström, E., Carlsson, F., Campos-Mercade, P., & Schneider, F. (2020). The Individual Welfare Costs of Stay at Home Policies. Available at SSRN 3641781.
Armona, L., Fuster, A., & Zafar, B. (2019). Home price expectations and behaviour: Evidence from a randomized information experiment. The Review of Economic Studies, 86(4), 1371-1410.
Bavel, Jay J. Van, Katherine Baicker, Paulo S. Boggio, Valerio Capraro, Aleksandra Ci-chocka, Mina Cikara, Molly J. Crockett, Alia J. Crum, Karen M. Douglas, James N.Druckman, John Drury, Oeindrila Dube, Naomi Ellemers, Eli J. Finkel, James H. Fowler,Michele Gelfand, Shihui Han, S. Alexander Haslam, Jolanda Jetten, Shinobu Kitayama,Dean Mobbs, Lucy E. Napper, Dominic J. Packer, Gordon Pennycook, Ellen Peters,Richard E. Petty, David G. Rand, Stephen D. Reicher, Simone Schnall, Azim Shariff,Linda J. Skitka, Sandra Susan Smith, Cass R. Sunstein, Nassim Tabri, Joshua A. Tucker,Sander van der Linden, Paul van Lange, Kim A. Weeden, Michael J. A. Wohl, Jamil Zaki,Sean R. Zion, and Robb Willer. (2020). “Using social and behavioural science to supportCOVID-19 pandemic response.” Nature Human Behaviour, 4(5): 460–471.
Betsch, Cornelia, Frank Renkewitz, Tilmann Betsch, Corina Ulshöfer. 2010. The influence of vaccine-critical websites on perceiving vaccination risks. Journal of Health Psychology, 15(3): 446-55.
Betsch, Cornelia. (2020). How behavioural science data helps mitigate the COVID-19 crisis. Nature Human Behaviour, 4(5), 438-438.
Betsch, Cornelia, Robert Böhm, Lars Korn, and Cindy Holtmann. (2017). On the benefits of explaining herd immunity in vaccine advocacy. Nature Human Behaviour, 1(3): 1–6
Betsch, C., Korn, L., Sprengholz, P., Felgendreff, L., Eitze, S., Schmid, P., & Böhm, R. (2020). Social and behavioral consequences of mask policies during the COVID-19 pandemic. Proceedings of the National Academy of Sciences, 117, 21851-21853.
18
Brewer, Noel T., Gretchen B. Chapman, Alexander J. Rothman, Julie Leask, and Allison Kempe. 2017. Increasing vaccination: Putting psychological science into action. Psychological Science in the Public Interest, 18(3): 149–207.
Bursztyn, L., Rao, A., Roth, C., & Yanagizawa-Drott, D. (2020). Misinformation during a pandemic. University of Chicago, Becker Friedman Institute for Economics Working Paper, (2020-44).
Campos-Mercade, P., Meier, A., Schneider, F., & Wengström, E. (2020). Prosociality predicts health behaviors during the COVID-19 pandemic. University of Zurich, Department of Economics, Working Paper, (346).
Cappelen, A. W., Falch, R., Sørensen, E. Ø., & Tungodden, B. (2020). Solidarity and fairness in times of crisis. NHH Dept. of Economics Discussion Paper, (06).
Charoenwong Ben, Alan Kwan, and Vesa Pursiainen. (2020). Social connections with COVID-19–affected areas increase compliance with mobility restrictions. Science Advances 6(47): eabc3054.
ChoiceMetrics (2018). Ngene 1.2 User manual & Reference guide. Sydney, Australia: ChoiceMetrics.
Clinton J., J. Cohen, J. Lapinski. (2020). Partisan pandemic: How partisanship and public health concerns affect individuals’ social mobility during COVID-19. Science Advances: eabd7204.
Cohn, A., Engelmann, J., Fehr, E., & Maréchal, M. A. (2015). Evidence for countercyclical risk aversion: An experiment with financial professionals. American Economic Review, 105(2), 860-85.
Conner, M., & Norman, P. (2005). Predicting health behaviour. McGraw-Hill Education (UK).
Coronavirus Disease (COVID-19) Weekly Epidemiological Update and Weekly Operational Update (World Health Organization, (2020); https://www.who.int/emergencies/diseases/novel-coronavirus-2019/situation-reports.
Eichenbaum, M. S., Rebelo, S., & Trabandt, M. (2020). The macroeconomics of epidemics (No. w26882). National Bureau of Economic Research.
19
Farboodi, M., Jarosch, G., & Shimer, R. (2020). Internal and external effects of social distancing in a pandemic (No. w27059). National Bureau of Economic Research.
Fetzer, T., Hensel, L., Hermle, J., & Roth, C. (2020). Coronavirus perceptions and economic anxiety. Review of Economics and Statistics, 1-36.
de Figueiredo, A., Simas, C., Karafillakis, E., Paterson, P., & Larson, H. J. (2020). Mapping global trends in vaccine confidence and investigating barriers to vaccine uptake: a large-scale retrospective temporal modelling study. The Lancet, 396(10255), 898-908.
Gaebler, C., & Nussenzweig, M. C. (2020). All eyes on a hurdle race for a SARS-CoV-2 vaccine. Nature 586, 501-502.
Galasso, Vincenzo, Vincent Pons, Paola Profeta, Michael Becher, Sylvain Brouard, Martial Foucault. (2020). Gender differences in COVID-19 attitudes and behavior: Panel evidence from eight countries. Proceedings of the National Academy of Sciences, 117(44): 27285-27291.
Galizzi, Matteo M., and Daniel Wiesen. (2018). Behavioral experiments in health economics. InOxford Research Encyclopedia of Economics and Finance. Ed.: Jonathan H. Hamilton, Avinash Dixit, Sebastian Edwards and Kenneth Judd
Garibaldi, P., Moen, E. R., & Pissarides, C. A. (2020). Modelling contacts and transitions in the SIR epidemics model. Covid Economics Vetted and Real-Time Papers, CEPR.
Gollwitzer, Anton, Cameron Martel, William J. Brady, Philip Pärnamets, Isaac G. Freedman, Eric D. Knowles & Jay J. Van Bavel. 2020. Partisan differences in physical distancing are linked to health outcomes during the COVID-19 pandemic. Nature Human Behaviour, 4:1186–1197.
Guglielmo Briscese, Nicola Lacetera, Mario Macis and Mirco Tonin. 2020. “Expectations, reference points, and compliance with COVID-19 social distancing measures.” NBER WP No. 26916.
Haaland, I., & Roth, C. (2020). Labor market concerns and support for immigration. Journal of Public Economics, 191, 104256.
Harris, K. M., Maurer, J., & Kellermann, A. L. (2010). Influenza Vaccine — Safe, Effective, and Mistrusted. New England Journal of Medicine, 363(23), 2183–2185.
20
Haushofer, Johannes and Ernst Fehr. (2014). On the psychology of poverty. Science, 344(6186), 862-867.
Helweg-Larsen, M., & Shepperd, J. A. (2001). Do moderators of the optimistic bias affect personal or target risk estimates? A review of the literature. Personality and social psychology review, 5(1), 74-95.
Korn, L., Böhm, R., Meier, N. W., & Betsch, C. (2020). Vaccination as a social contract. Proceedings of the National Academy of Sciences of the United States of America, 117(26), 14890– 14899.
Krammer, F. (2020). SARS-CoV-2 vaccines in development. Nature, 586(7830), 516-527.
Lau, Krystal, Miraldo, Marisa, Galizzi, Matteo M. and Hauck, Katharina (2019) Social norms and free-riding in influenza vaccine decisions in the UK: an online experiment. The Lancet, 394 (S65).
Lerner, J. S., Li, Y., Valdesolo, P., & Kassam, K. S. (2015). Emotion and decision making. Annual review of psychology, 66.
Makris, M., & Toxvaerd, F. (2020). Great Expectations: Social Distancing in Anticipation of Pharmaceutical Innovations (No. 2097). Faculty of Economics, University of Cambridge.
Maurer, J. (2009). Who has a clue to preventing the flu? Unravelling supply and demand effects on the take-up of influenza vaccinations. Journal of Health Economics, 28(3), 704–717.
Maurer, J., Harris, K. M., & Lurie, N. (2009). Reducing missed opportunities to vaccinate adults against influenza: What is realistic? In Archives of Internal Medicine 169(17), 1633–1634).
Meier, A. N. (2019). Emotions, risk attitudes, and patience (No. 1041). SOEPpapers on Multidisciplinary Panel Data Research.
Milkman, K. L., Beshears, J., Choi, J. J., Laibson, D., & Madrian, B. C. (2011). Using implementation intentions prompts to enhance influenza vaccination rates. Proceedings of the National Academy of Sciences of the United States of America, 108(26), 10415–10420.
21
Mischel, W., Shoda, Y., & Rodriguez, M. I. (1989). Delay of gratification in children. Science, 244(4907), 933-938.
Müller, S., & Rau, H. A. (2020). Economic preferences and compliance in the social stress test of the COVID-19 crisis. Journal of Public Economics, 104322.
Roth, C., & Wohlfart, J. (2020). How do expectations about the macroeconomy affect personal expectations and behavior? Review of Economics and Statistics, 102(4), 731-748.
Sacerdote, B., Sehgal, R., & Cook, M. (2020). Why Is All COVID-19 News Bad News? (No. 28110). National Bureau of Economic Research, Inc.
Schilbach, Frank. (2019). Alcohol and self-control: A field experiment in India. American Economic Review, 109(4): 1290–1322.
Thunström, Linda, Madison Ashworth, Jason F. Shogren, Stephen Newbold, and David Finnoff. (2020). Testing for COVID-19: Willful ignorance or selfless behavior? Behavioral Public Policy, forthcoming
Tonin, Mirco. 2017. A Survey Experiment on Information, Inattention and Online Privacy. Journal of Economic Behavior & Organization, 140: 1-17.
Simonov, A., Sacher, S. K., Dubé, J. P. H., & Biswas, S. (2020). The persuasive effect of fox news: non-compliance with social distancing during the covid-19 pandemic (No. w27237). National Bureau of Economic Research.
1
Supplementary Information for:
Anticipation of COVID-19 Vaccines
Reduces Social Distancing
*Ola Andersson Pol Campos-Mercade Armando N. Meier Erik Wengström
This PDF file contains:
1. Additional Tables and Figures
2. Complete information about the survey experiment, including instructions and screenshots
*Andersson: Uppsala University and the Research Institute of Industrial Economics, Sweden. e-mail: ola.andersson@nek.uu.se. Campos-Mercade: University of Copenhagen, Denmark. e-mail: pcm@econ.ku.dk. Meier: University of Lausanne and University of Basel, Switzerland. e-mail: armando.meier@gmail.com. Wengström: Lund University, Sweden and Hanken School of Economics, Finland. e-mail: erik.wengstrom@nek.lu.se. Declarations of interest: none. We are thankful for financial support from Riksbankens Jubileumsfond and Handelsbankens forskningsstiftelse.
2 1 Additional Tables and Figures
1.1 Summary statistics and distribution of health behaviors Tab. S1. Summary statistics table of all control variables
Variable N mean sd min max
Female 1,617 0.510 0.500 0 1
University degree 1,617 0.365 0.482 0 1
Single household 1,617 0.326 0.469 0 1
Income in 1,000 SEK per adult 1,617 21.40 12.84 1 95
No children at home 1,617 0.700 0.458 0 1 Big city 1,617 0.327 0.469 0 1 City 1,617 0.237 0.426 0 1 Small city 1,617 0.154 0.361 0 1 Work 1,617 0.515 0.500 0 1 Age categories: 18-29 1,617 0.145 0.353 0 1 30-39 1,617 0.200 0.400 0 1 40-49 1,617 0.169 0.375 0 1 50-59 1,617 0.181 0.385 0 1 60-69 1,617 0.140 0.347 0 1 70+ 1,617 0.164 0.370 0 1
3
Fig. S1. Histograms of all health behaviors. For each item, we ask participants to what degree the described intended
4
Fig. S2. Histograms of the likelihood to participate in a stay-at-home program across 9
scenarios. The average is calculated by taking the average across 9 binary decisions to participate or not for each participant. So 33% means that a participant was willing to participate in 3 out of nine proposed programs.
Fig. S3. Histograms of pandemic duration. Life back to normal in February refers to the
question about whether life may start to ressemble life before the pandemic again in February to which participants could respond on a 1 to 7 scale ranging from 1 = strongly disagree to 7 = strongly agree.
5
1.2 Health behaviors correlate with COVID-19 exposure
Fig. S4. Correlation of participant assessed likelihood of COVID-19 exposure (on a
10-point scale from 0% likely to 100% likely) with the health behavior index (better health behaviors). A 1 standard deviation improvement in health behaviors relates to 7 percentage point reducation in the likelihood of having had COVID-19 (p<0.01).
6
1.3 Balance checks
Tab. S2. Balance check with all control variables that are included in the most extensive specification.
Variable: Treatment Difference
Female -0.038 (0.025) Age categories: 18-29 0.007 (0.018) 30-39 -0.009 (0.020) 40-49 -0.009 (0.019) 50-59 0.006 (0.019) 60-69 -0.002 (0.017) 70+ 0.007 (0.018)
Income in 1000 SEK per adult 0.744
(0.639) Work -0.028 (0.025) No children at home -0.023 (0.023) Single household 0.011 (0.023) University degree 0.028 (0.024) Big city 0.031 (0.023) City -0.032 (0.021) Small city 0.012 (0.018)
Note: Treatment Difference indicates the coefficient estimate from a regression of each respective variable shown on the left on an indicator variable capturing the treatment. The table shows that there were no substantial differences across treatment and control group in the experiment. Heteroscedasticity robust standard errors in parentheses.
7
1.4 Regression results for each health behavior item Tab. S3. Avoids contact and keeps informed.
(1) (2) (3) (4) (5) (6) Dependent variables: Avoids contact Avoids contact Avoids contact Keeps informed Keeps informed Keeps informed Vaccine Information -0.27*** -0.26*** -0.26*** -0.21*** -0.20*** -0.20*** (0.05) (0.05) (0.05) (0.05) (0.05) (0.05) Observations 1,617 1,617 1,617 1,617 1,617 1,617 R-squared 0.02 0.16 0.17 0.01 0.15 0.16
Gender Yes Yes Yes Yes
Age categories
Yes Yes Yes Yes
Controls Yes Yes
Note: The table shows the treatment effect estimate for people receiving vaccine information on health behaviors using linear regressions. Age categories include 6 indicators for age categories. Controls include adult income, a dummy indicating unemployment, a dummy indicating children, a dummy indicating single households, a dummy indicating a university degree, and dummies indicating whether people live in a big city/regular city/small city. Heteroscedasticity robust standard errors are shown in parentheses. *** p<0.01, ** p<0.05, * p<0.1
Tab. S4. Avoids contact and keeps informed.
(1) (2) (3) (4) (5) (6) Dependent variables: Keeps distance Keeps distance Keeps distance Avoids travel Avoids travel Avoids travel Vaccine Information -0.22*** -0.21*** -0.21*** -0.22*** -0.21*** -0.20*** (0.05) (0.05) (0.05) (0.05) (0.05) (0.05) Observations 1,617 1,617 1,617 1,617 1,617 1,617 R-squared 0.01 0.12 0.13 0.01 0.06 0.07
Gender Yes Yes Yes Yes
Age categories Yes Yes Yes Yes
Controls Yes Yes
Note: The table shows the treatment effect estimate for people receiving vaccine information on health behaviors using linear regressions. Age categories include 6 indicators for age categories. Controls include adult income, a dummy indicating unemployment, a dummy indicating children, a dummy indicating single households, a dummy indicating a university degree, and dummies indicating whether people live in a big city/regular city/small city. Heteroscedasticity robust standard errors are shown in parentheses. *** p<0.01, ** p<0.05, * p<0.1
8
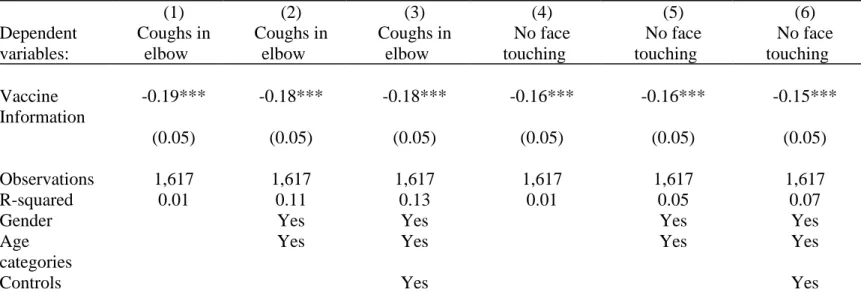
Tab. S5. Coughs in elbow and no face touching.
(1) (2) (3) (4) (5) (6) Dependent variables: Coughs in elbow Coughs in elbow Coughs in elbow No face touching No face touching No face touching Vaccine Information -0.19*** -0.18*** -0.18*** -0.16*** -0.16*** -0.15*** (0.05) (0.05) (0.05) (0.05) (0.05) (0.05) Observations 1,617 1,617 1,617 1,617 1,617 1,617 R-squared 0.01 0.11 0.13 0.01 0.05 0.07
Gender Yes Yes Yes Yes
Age categories
Yes Yes Yes Yes
Controls Yes Yes
Note: The table shows the treatment effect estimate for people receiving vaccine information on health behaviors using linear regressions. Age categories include 6 indicators for age categories. Controls include adult income, a dummy indicating unemployment, a dummy indicating children, a dummy indicating single households, a dummy indicating a university degree, and dummies indicating whether people live in a big city/regular city/small city. Heteroscedasticity robust standard errors are shown in parentheses. *** p<0.01, ** p<0.05, * p<0.1
Tab. S6. Washes hands and self-isolates.
(1) (2) (3) (4) (5) (6) Dependent variables: Washes hands Washes hands Washes hands Self-isolates Self-isolates Self-isolates Vaccine Information -0.17*** -0.16*** -0.15*** -0.20*** -0.20*** -0.20*** (0.05) (0.05) (0.05) (0.05) (0.05) (0.05) Observations 1,617 1,617 1,617 1,617 1,617 1,617 R-squared 0.01 0.09 0.11 0.01 0.08 0.09
Gender Yes Yes Yes Yes
Age categories
Yes Yes Yes Yes
Controls Yes Yes
Note: The table shows the treatment effect estimate for people receiving vaccine information on health behaviors using linear regressions. Age categories include 6 indicators for age categories. Controls include adult income, a dummy indicating unemployment, a dummy indicating children, a dummy indicating single households, a dummy indicating a university degree, and dummies indicating whether people live in a big city/regular city/small city. Heteroscedasticity robust standard errors are shown in parentheses. *** p<0.01, ** p<0.05, * p<0.1
9
Tab. S7. Informs contacts and wears mask.
(1) (2) (3) (4) (5) (6)
Dependent variables:
Informs contacts Informs contacts Informs contacts Wears mask Wears mask Wears mask Vaccine Information -0.17*** -0.16*** -0.16*** -0.14*** -0.13*** -0.13*** (0.05) (0.05) (0.05) (0.05) (0.05) (0.05) Observations 1,617 1,617 1,617 1,617 1,617 1,617 R-squared 0.01 0.06 0.06 0.00 0.03 0.04
Gender Yes Yes Yes Yes
Age categories
Yes Yes Yes Yes
Controls Yes Yes
Note: The table shows the treatment effect estimate for people receiving vaccine information on health behaviors using linear regressions. Age categories include 6 indicators for age categories. Controls include adult income, a dummy indicating unemployment, a dummy indicating children, a dummy indicating single households, a dummy indicating a university degree, and dummies indicating whether people live in a big city/regular city/small city. Heteroscedasticity robust standard errors are shown in parentheses.
10
1.5 Impact on beliefs about the duration of the pandemic
Fig. S5. The figure shows the raw distribution of expectations about the remaining duration of
the pandemic in months across treatment groups comparing participants in Control A vs. Control B as preregistered (N=805). The light grey bars show the density for people who do not receive vaccine information before the question about the duration of the pandemic, whereas the light blue bars show the density for people who receive information before the question about the duration of the pandemic.
11
Tab. S8. Impact on perceived duration oft the pandemic: Life starts getting back to normal in February (standardized).
(1) (2) (3) (4) (5) (6) Dependent variable: Pand. over Feb. Pand. over Feb. Pand. over Feb. Pand. over Feb. Pand. over Feb. Pand. over Feb. Vaccine Information 0.14* 0.14** 0.15** 0.10* 0.10* 0.10* (0.07) (0.07) (0.07) (0.06) (0.06) (0.05) Observations 805 805 805 1,617 1,617 1,617 R-squared 0.00 0.06 0.09 0.00 0.07 0.09
Gender Yes Yes Yes Yes
Age Categories
Yes Yes Yes Yes
Controls Yes Yes
Note: The table shows the treatment effect estimate for people receiving vaccine information on the perceived duration of the pandemic (standardized). Columns (1) to (3) only include the comparison between treatment 2a and treatment 2b as preregistered and therefore have a lower number of observations. Age categories include 6 indicators for age categories. Controls include adult income, a dummy indicating unemployment, a dummy indicating children, a dummy indicating single households, a dummy indicating a university degree, and dummies indicating whether people live in a big city/regular city/small city. Heteroscedasticity robust standard errors are shown in parentheses. *** p<0.01, ** p<0.05, * p<0.1
12
Tab. S9. Impact on perceived duration oft the pandemic: Remaining duration of the pandemic in months
(standardized). (1) (2) (3) (4) (5) (6) Dependent variable: Months left Months left Months left Months left Months left Months left Vaccine Information -0.06 -0.05 -0.07 -0.09 -0.08 -0.09 (0.07) (0.07) (0.07) (0.06) (0.06) (0.06) Observations 805 805 805 1,617 1,617 1,617 R-squared 0.00 0.02 0.06 0.00 0.01 0.04
Gender Yes Yes Yes Yes
Age Categories Yes Yes Yes Yes
Controls Yes Yes
Note: The table shows the treatment effect estimate for people receiving vaccine information on the perceived duration of the pandemic (standardized). Columns (1) to (3) only include the comparison between treatment 2a and treatment 2b as preregistered and therefore have a lower number of observations. Age categories include 6 indicators for age categories. Controls include adult income, a dummy indicating unemployment, a dummy indicating children, a dummy indicating single households, a dummy indicating a university degree, and dummies indicating whether people live in a big city/regular city/small city. Heteroscedasticity robust standard errors are shown in parentheses. *** p<0.01, ** p<0.05, * p<0.1
13
1.6 Additional results based on preregistration plan
Tab. S10. Probit regression of the willingness to stay-at-home (yes or no) on treatment using the
data across scenarios (one decision per scenario), controlling for scenario characteristics and clustering of standard errors on the participant level.
(1) (2) (3)
Dependent variable: Stay home Stay home Stay home
Vaccine Information -0.10** -0.10** -0.10**
(0.04) (0.04) (0.04)
Observations 14,553 14,553 14,553
Individuals 1,617 1,617 1,617
Scenario Fixed Effects Yes Yes Yes
Gender Yes Yes
Age categories Yes Yes
Controls Yes
Note: The table shows the treatment effect estimate for people receiving vaccine information on the likelihood of participating in a specific stay-at-home program scenario using probit regression. Throughout and as pre-specified, we control for scenario characteristics by including one indicator variable for each scenario (scenario fixed effects). Age categories include 6 indicators for age categories. Controls include adult income, a dummy indicating unemployment, a dummy indicating children, a dummy indicating single households, a dummy indicating a university degree, and dummies indicating whether people live in a big city/regular city/small city. Cluster robust standard errors clustered at the individual level are shown in parentheses. *** p<0.01, ** p<0.05, * p<0.1
14
Tab. S11. Linear regression of the willingness to stay-at-home on treatment using linear
regression using the average likelihood to participate across scenarios as the outcome.
(1) (2) (3)
Dependent variable: Stay home Stay home Stay home
Vaccine Information -0.04** -0.04** -0.04**
(0.02) (0.02) (0.02)
Observations 1,617 1,617 1,617
Individuals 0.00 0.02 0.02
Gender Yes Yes
Age categories Yes Yes
Controls Yes
Note: The table shows the treatment effect estimate for people receiving vaccine information on the average likelihood for a participant to participate in a stay-at-home across scenarios. Age categories include 6 indicators for age categories. Controls include adult income, a dummy indicating unemployment, a dummy indicating children, a dummy indicating single households, a dummy indicating a university degree, and dummies indicating whether people live in a big city/regular city/small city. Cluster robust standard errors clustered at the individual level are shown in parentheses. *** p<0.01, ** p<0.05, * p<0.1
Tab. S12. Prinicipal component of health behaviors as the dependent variable.
(1) (2) (3)
Dependent variable:
Health Behaviors PC Health Behaviors PC Health Behaviors PC
Vaccine Information -0.27*** -0.26*** -0.25*** (0.05) (0.05) (0.05) Observations 1,617 1,617 1,617 R-squared 0.02 0.16 0.17
Gender Yes Yes
Age FE Yes Yes
Controls Yes
Note: The table shows the treatment effect estimate for people receiving vaccine information on health behaviors using linear regressions and the principal component as the dependent variable. All health items have similar factor loadings for the principal component and are all positive. Age categories include 6 indicators for age categories. Controls include adult income, a dummy indicating unemployment, a dummy indicating children, a dummy indicating single households, a dummy indicating a university degree, and dummies indicating whether people live in a big city/regular city/small city. Heteroscedasticity robust standard errors are shown in parentheses. *** p<0.01, ** p<0.05, * p<0.1
15
1.7 Dropping participants that need less than 5 minutes
Fig. S6. The treatment effect by intended health behavior dropping participants who finished the
survey in less than 5 minutes. The grey dots give the estimated difference on the outcome variables in standard deviations when comparing people who receive the vaccine information after describing future health behavior (Treatment 2) to people who receive vaccine information before describing future health behavior (Treatment 1). As pre-registered, the coefficient estimates are based controlling for gender, 6 dummies indicating age categories, adult income, a dummy indicating unemployment, a dummy indicating children, a dummy indicating single households, a dummy indicating a university degree, and dummies indicating whether people live in a big city/regular city/small city. p<0.01, ** p<0.05, * p<0.1
16
2.8 Sample characteristics vs. Swedish population Tab. S13. Sample characteristics and the Swedish population
Variables: Sample mean Sweden Mean Age categories: 18–25 years 0.09 0.12 26–35 years 0.18 0.18 36-45 years 0.17 0.16 46-55 years 0.20 0.17 56-65 years 0.13 0.14
66 years and older 0.23 0.24
Female 0.51 0.50
Region Stockholm 0.22 0.23
Region Östra Mellansverige 0.17 0.17
Region Smaland med öarna 0.09 0.08
Region Sydsverige 0.15 0.15
Region Västsverige 0.19 0.20
Region Norra Mellansverige 0.08 0.08
Region Mellersta Norrland 0.04 0.04
Region Övre Norrland 0.05 0.05
Note: The table shows summary statistics compared to the whole Swedish population based on 2020 data.
17 2 Complete survey
Below follows the complete set of question blocks. The order of the different parts follows the structure presented in Table S1. The questions are translated from Swedish.
2.1.1 Vaccine information
During the latest weeks, positive information about several vaccines against Covid-19 has emerged.
Studies show that several of these has over 90 % effectiveness, which is much better compared to the vaccines against the seasonal flu.
Vaccination against Covid-19 has already started in Great Britain among other countries. Sweden has together with EU signed agreements with several of these vaccine suppliers and preliminary information suggest that the first vaccine will be approved for use within EU late December. The likelihood is therefore high that vaccinations will commence in Sweden around the turn of the year.
The government has informed that the vaccination will be free of charge. We now ask you to answer a couple of questions about the Covid-19 vaccines. Are the following statements on the coming vaccines against Covid-19 true? The vaccines give better protection than the regular seasonal-flu vaccine. [Possible answers: Correct/incorrect]
The first vaccines are expected to be approved in late December [Possible answers: Correct/incorrect]
[Participants could only move on after answering the above two questions correctly.] To what extent do the following statements describe you?
I have closely followed the news about the rapid vaccine development
[Possible answers: 7-point scale from "Does not apply at all" to "Applies very much"] Over the last months my hopes concerning the effectiveness of a COVID-19 vaccine become more optimistic
18
I think it is more likely today than two months ago that a vaccine will help us returning to a more normal way of living in the early 2021
[Possible answers: 7-point scale from "Does not apply at all" to "Applies very much"] 2.1.2 Pandemic durations questions
In February 2021 life will start to look like it did in February 2020, before the outbreak of the pandemic.
[Possible answers: 7-point scale from "Strongly disagree" to "Strongly agree"] In how many months do you think the restrictions imposed by the coronavirus will be removed? That is, when do you think life returns to normal in Sweden? (in months) [Possible answers: 1,2,…,24 months +]
2.1.3 Health Behaviors
Now we will ask you about your behavior regarding the ongoing outbreak of the coronavirus (COVID-19).
Looking ahead, to what extent do the following statements describe your behavior in response to the outbreak of the coronavirus (COVID-19)?
• I will try to avoid social contacts in person (for example, I attend fewer social gatherings)
• I will inform myself about how the spread of the corona virus can be prevented
• I will keep at least two meters distance from other people
• I will refrain from private domestic trips outside my home municipality (e.g., to holiday homes and acquaintances)
• I will cough and sneeze into my elbow or a tissue instead of the hand
• I will touch my face less often than usual
• I will wash my hands more often than usual when not at home
[Note: Participants answered on a 7-point scale ranging from from 1= "Does not apply at all" to 7= "Applies very much"]
If you exhibited mild symptoms of illness (e.g., coughing) tomorrow, how much do the following statements apply to your behavior in the next two weeks?
• I will self-quarantine
• I will immediately inform people who had contact with me
• I will wear a mask, or something else to cover my mouth (e.g., a scarf), if I have to leave home
[Note: Participants answered on a 7-point scale ranging from from 1= "Does not apply at all" to 7= "Applies very much"]
19 2.1.4 Choice Experiment
What would you do?
Imagine that in an attempt to reduce the number of people infected by the corona virus (COVID-19) in Sweden, the government is introducing a program with the possibility for households to go on voluntary self-quarantine. For the program to be effective, at least 30 percent of households in Sweden must participate, which includes your age group and where you live. Adults who participate in the program would still be able to work (either from home or in the workplace), but they would have to stay in their home during their free time and only go out for a limited time each day.
We consider a situation where shops, restaurants, gyms, parks and cinemas would be open and only large events are closed.
If you voluntarily participates in the program you would need to do so throughout the duration of the program. When the maturity has expired, you are free to go back to your usual routines.
Exactly how such a program would look like depends on a number of aspects. For this reason, we will ask about your household's willingness to participate in such a program under different circumstances. More precisely, we will examine the following aspects: 1) Length of quarantine (the number of weeks that one needs to stay at home). We consider three different levels:
o 2 weeks
o 4 weeks
o 6 weeks
2) Hours outside the home (number of hours per week that each person in the household (adult and child) is allowed to be outside the home except for work). This would be controlled and violations of the rules would result in fines for those in the household who violate the rules. We consider three different levels:
o 2 hours a week
o 8 hours a week
o 14 hours a week
3) Compensation The authorities are aware that it is costly for people to participate and may therefore pay compensation. We examine six different levels of remuneration per adult in the household per week (after tax):
o SEK 0 per adult (no compensation)
o SEK 500 per week per adult
o SEK 1000 per week per adult
20
o SEK 2000 per week per adult
o SEK 2500 per week per adult
Let us show you an example of how we will ask you questions (you cannot mark any answer in this example).
If the program looked like below, what would your household do?
Quarantine length 4 weeks
Hours outside the home 8 hours a week
Compensation (after tax) SEK 1000 per week per adult ☐ I would want my household to participate
☐ I would not want my household to attend
We would like to know what you would like your household to do in these different situations. Note that you make a choice for the entire household so that participation will affect all members of the household. We will ask you to make nine such choices. It is important that you try to see each question as a stand-alone question.
Note that there is no right or wrong answer. We are interested in what different people think and what choices they make. Even we ourselves who are conducting this study feel different about participating in such a program.
Below are the nine different versions of the program that we ask you to consider. Please consider your choices carefully and feel free to go up and down the page and change your choices until you are satisfied.
Remember that shops, restaurants, gyms, parks and cinemas would be open
regardless of whether you are in the program or not. Only major events are closed.
[All the choices come here but we only include one for sake of space. Please refer to the paper for the full set of parameter configurations]
If the program looked like below, what would your household do?
Quarantine length X weeks
Hours outside the home Y hours a week
Compensation (after tax) SEK Z per week per adult ☐ I would want my household to participate
21 2.1.5 Additional Survey Questions
During the last 7 days, how often did you leave your home to: • Buy things other than food and medicine (e.g. clothes)
• Do physical activities with other people (e.g. gym, football, tennis, golf, group workouts)?
• hang out with friends and relatives who do not live in the same household? [Possible answers: "never", "1-2 times/week” "3-4 times/week” "5-6 times/week” "7-8 times/week” "more than 8 times/week"]
Think now about a normal week one year ago. During this week, how often did you leave your home to:
• Buy things other than food and medicine (e.g. clothes)
• Do physical activities with other people (e.g. gym, football, tennis, golf, group workouts)?
• hang out with friends and relatives who do not live in the same household? [Possible answers: "never", "1-2 times/week” "3-4 times/week” "5-6 times/week” "7-8 times/week” "more than 8 times/week"]
What year were you born? (select year)
Do you identify yourself as a woman or a man?
[Possible answers: woman, man, neither man nor woman] What describes you best?
[Possible answers: single, living apart, couple, married, other] What is your main occupation?
[Possible answers: work, unemployed, student, retired, other] What education do you have (fill out the highest you have)?
[Possible answers: elementary, highschool, professional training, ongoing university studies, university studies, research studies]
22
[Possible answers: Humanities, pedagogics, business economics and law, social sciences (not including economics), medicine, health sciences and social work, natural sciences and math, technical education]
Does your job allow you to work from home?
[Possible answers: yes to a large extent, yes to some extent, no, I have no job] Does your partner's job allow him/her to work from home?
[Possible answers: yes to a large extent, yes to some extent, no, She/he has no job] How many children live in your household?
[Possible answers: no children, 1 child, 2 children, 3 children, 4 children, 5 or more children]
How many adults (over 18 years old) live in your household (including yourself)? [Possible answers: 1 adult, 2 adults, 3 adults, 4 adults, 5 or more adults] How much is your households total income per month after taxes including public benefits? Include also your student loan if you are a student. Please answer even if you're not sure.
[Possible answers: 0-10000kr, 10001-20000kr, 20001-30000kr, 30001-40000kr, 40001-50000kr, 50001-60000kr, 60001-70000kr, 70001-80000kr , 80001-90000kr, more than 90001 kr]
Where do you live?
[Possible answers: Stockholm, Gothenburg, Malmö, large city (more than 50000 inhabitants), middle city (between 20000 and 50000 inhabitants), small city (less than 20000 inhabitants)]
What type of home do you have?
[Possible answers: House, terraced house, flat] How large is your home in square meters?
[Possible answers: 0-40, 41-60, 61-80, 81-120, 120-200, more than 200] Do you have a garden?