Keeping the Initiative Through Disruptions
Developing a Business Continuity Model for Gambro Global OperationsAuthors:
Axel Hyllienmark, Faculty of Engineering, Lund University Emil Nilsson, Faculty of Engineering, Lund University
Supervisors:
Lina Karlsson, Global Operations, Gambro
i
Acknowledgements
This report is the final part of our Master in Industrial Engineering and Manage-ment. Through the project we have deepened our theoretical knowledge, got to know Gambro from the inside and learnt more about ourselves, a very rewarding experience. We would like to thank our supervisor at Gambro, Lina Karlsson, who have supported us in all possible ways throughout the project. We would also like to thank all other employees throughout Gambro’s global organisation who have helped us with interviews, visits and material. Also, the fun and welcoming people in Operational Excellence and Supplier Development with whom we have shared office with, made the introduction to Gambro easy and relaxed.
Furthermore we would like to thank Peter Berling, our supervisor at LTH who has helped us with theoretical questions and feedback on our work. Our peer reviewers, Sara Öhrström, Hjalmar Sventelius, Philip Sandwall and Oscar Ågren, has given us valuable and constructive feedback on the report.
Last but not least, a special thanks to the case organisations’ representatives, Håkan Nilsson at Alfa Laval, Jan Grönvall at Tetra Pak and Andreas Norrman at LTH, your input has given our work and report an extra dimension.
Lund, 18th of June 2013
iii
Abstract
Title: Keeping the Initiative through disruptions – Developing a Business Continuity
Model for Gambro
Authors: Axel Hyllienmark, Industrial Engineering and Management, Faculty of
Engineering, Lund University and Emil Nilsson, Industrial Engineering and Management, Faculty of Engineering, Lund University
Supervisors: PhD Lina Karlsson, Director Project Office Global Operations,
Gam-bro and PhD Peter Berling, Assistant Professor, Department of Industrial Man-agement and Logistics, Production ManMan-agement, Faculty of Engineering, Lund University
Background: Historically, the risk management activities in Gambro have been
fo-cused to ensure safety for patients and users of the company’s products where Regulatory and legal demands have driven the development. Lately, the need for a similar approach to assess and manage business risks has risen. When an earthquake hit the company’s facilities in northern Italy in 2012, the company did not have a predetermined plan for how to solve the crisis. Through good management and a dedicated workforce, production was quickly recovered and no patient harm occurred. After the experience the company realised the po-tential benefits of proactive assessment and management of risks for business interruptions.
Purpose: The purpose of this thesis is to develop a model for assessment of risks
that affects Gambro’s ability to deliver their products, i.e. operational dis-ruption risks. The model should capture different types and levels of risks and be applicable and easy to use throughout the company. The harmonised model should enable Gambro to identify and mitigate risks in a structured and analytical manner.
Method: A constructive research approach is used where a practical solution to
the proposed problem is suggested. Academic literature, benchmarking, and Gambro’s current organisation is the basis for the development of a framework and governance for business risk management.
Conclusions: A model for assessing disruption risks was developed. The model is
divided into two general areas: the organisation and the procedure. An organ-isation with three different levels with different responsibilities of the process was developed. The three step procedure consists of the methodologies and tools required for identification of critical activities and resources, analyse and quantification of risks in terms of likelihood and business interruption value, and evaluate possible the risk responses.
Keywords: Risk Management, Business Continuity Planning, Business Continuity
Contents
Contents v
List of Figures vii
List of Tables ix
Definitions xi
1 Introduction 1
1.1 Context of the Project . . . 1
1.2 Risk Terminology . . . 2
2 Background to the Project 7 2.1 Gambro . . . 7 2.2 Medolla Earthquake . . . 10 3 Methodology 13 3.1 Approach . . . 13 3.2 Procedure . . . 15 3.3 Literature Review . . . 17 4 Theoretical Framework 19 4.1 Supply Chain Risk Management . . . 19
4.2 Organisational Culture . . . 24
4.3 Managerial Risk Processes . . . 27
4.4 Methods for Risk Identification and Analysis . . . 37
5 Risk management in practice 47 5.1 Cases . . . 47
5.2 Product risks . . . 54
vi CONTENTS
5.3 Gambro’s Approach to Business Risks . . . 56
6 Model 63 6.1 Sources of Model . . . 63
6.2 Organisation . . . 64
6.3 Procedure . . . 67
7 Test of Model 81 7.1 Business Impact Analysis . . . 81
7.2 Risk Assessment . . . 82
7.3 Business Continuity Strategy and Mitigation . . . 86
7.4 Difficulties During the Test . . . 86
8 Conclusion 87 8.1 Model Summary . . . 87
8.2 Discussion of the Model Test . . . 90
8.3 Next Step . . . 92
Bibliography 97 A Guidelines for Risk Analysis 101 A.1 Checklist for evaluation of cause likelihood . . . 101
A.2 Checklist for evaluation of business interruption value . . . 103
List of Figures
1.1 Components of the term risk . . . 2
1.2 The chapters of this report . . . 6
2.1 An excerpt of Gambro’s products, from left to right: Artis (Moni-tor), Polyflux (Dialyser) and Artiset (Bloodlines) . . . 8
2.2 Dialysis process . . . 10
3.1 The constructive approach suggested by Kasanen and Lukka (1993) 14 4.1 Procurement alignment (Sheffi, 2003, p. 215) . . . 22
4.2 Cost of preventive actions versus the business interruption value (Norrman and Jansson, 2004) . . . 31
4.3 A risk assessment matrix, adapted from Department of Defense -Standard Practice (2012, p. 12) . . . 39
4.4 The standardised symbols of fault tree analysis . . . 41
4.5 A bicycle example of fault tree analysis . . . 42
5.1 The product risk work in the different product life cycle phases . . 55
6.1 The sources of the proposed model . . . 63
6.2 Proposed governance model for Gambro . . . 65
6.3 Overview of the model proposed . . . 68
6.4 Completed business impact analysis . . . 73
6.5 The components of the business recovery time and their relation . 74 6.6 Business interruption value in a supply chain perspective . . . 76
6.7 Completed risk analysis template part 1 . . . 78
6.8 Completed risk analysis template part 2 . . . 78
6.9 Completed risk assessment template . . . 78
6.10 Matrix that provides an overview of the highest risks . . . 79
viii List of Figures
7.1 The business impact analysis from the test of the bloodlines pro-duction in Medolla, Italy . . . 82
List of Tables
1.1 Examples of risks in different corporate functions . . . 3
1.2 Risk categorisation, adapted from Manuj and Mentzer (2008) . . . 4
4.1 Plan Do Check Act cycle in a risk management perspective (Inter-national Standard Organisation, 2012) . . . 26
4.2 Example of FMEA table . . . 38
6.1 Appropriate material for identification of critical activities and re-sources . . . 70
6.2 Typical categories of disruption . . . 71
6.3 Proposed likelihood ratings (years between occurrences) . . . 75
6.4 Proposed severity ratings (in million euro) . . . 77
7.1 An example of the Business Interruption Value calculation for the Monitor production . . . 84
7.2 An example of the Business Interruption Value calculation for the Bloodline production. In the calculation a total production per week for the process is estimated as 25 units . . . 85
Definitions
In this report, a number of important words and expressions are used. To support the reader a list of definitions is presented below. The reader is encouraged to go back to this list when necessary in order to fully understand the context.
Buffer Time The time from the incident until Gambro’s business starts to be affected. The time could be dependent of safety stock, backup systems etc.
Business Recovery Time The time from the end of the buffer time to the end of the downtime. During this time the business process will be interrupted and no output delivered.
Business Interruption Value (BIV) The gross margin of the process’ fi-nal output multiplied by the Business Recovery Time plus extra costs such as idle capacity labour and equipment, inventory carrying, repair costs etc. The value should also include loss of goodwill if possible.
Business Continuity Capability of the organization to continue delivery of products or services at acceptable predefined levels following disruptive incident.
Business Continuity Management The development of strategies, plans and actions which provide protection for those activities or business processes which, if they were to be interrupted, might otherwise bring about a serious damage to the enterprise.
Business Continuity Plan Documented procedures that guide organiza-tions to respond, recover, resume, and restore to a pre-defined level of operation following disruption.
xii DEFINITIONS
Business Continuity Strategy Business Continuity Strategy is about us-ing the findus-ings in BIA and Risk Assessment to determine appropriate actions to resume activities within agreed timeframes.
Business Impact Analysis Process of analyzing activities and the effect that a disruption might have upon the company.
Business Recovery Time The time during which no output can be ex-pected from the process in question. This time consists of two com-ponents, the total down time minus the buffer time.
Continuity Project Team The Continuity Project Team is determined by the Process Continuity Management Team in order to suit the particular project. The team may include internal and/or external subject matter experts.
Deductive Risk Identification An undesired scenario is imagined and pos-sible causes are found and investigated (“what can cause this undesired scenario”)
Detectability An estimate of the ability to identify a cause of failure before the harm actually occurs.
Impact The expected magnitude of a risk’s impact. In the proposed model, Business Interruption Value is used as a measurement.
Inductive Risk Identification All sub-steps of e.g. a process is gone through and possible failure modes in each one are found and investigated (“what can be the effect of this event occurring”)
Likelihood A term for measuring how expected an event is. Used inter-changeably with probability and occurrence
Occurrence A term for measuring how expected an event is. Used inter-changeably with probability and likelihood
Probability A term for measuring how expected an event is. Used inter-changeably with occurrence and likelihood
Process Continuity Management Team The Process Continuity Manage-ment Team includes, but is not limited to, Global Process Continuity Manager, Local Operations Site, Local Supply, Site IT, Site Facility. The team may include internal and/or external subject matter experts
xiii
Recovery Time Objective The Recovery Time Objective is the time that is estimated can pass before Gambro’s ability to deliver to nearest cus-tomer will be affected, and consequently negative business impact will occur.
Risk Management The making of decisions regarding risks and their subse-quent implementation, and flows from risk estimation and risk evaluation (Society, 1992, p. 3)
Risk Mitigation The pro-active activities to deal with risks that are meant. Risk Priority Number The Risk Priority Number is used in order to pri-oritize between risks. It is found by calculating the geometrical repre-sentation of the risks position in the risk matrix. This is done with the formulap
(L2+ S2).
Severity The expected magnitude of a risk’s impact. In the proposed model, Business Interruption Value is used as a measurement.
Chapter 1
Introduction
1.1
Context of the Project
Businesses have been managing risks ever since the market economy started to take shape hundreds of years ago. Balancing risk taking with preventive actions is a large part of what it means to drive a business. However, as the business environment grows more complex and supply chains are spanning over more companies and longer geographical distances, the need for proper risk management is as important as ever. This report proposes a model for evaluating and managing this complex environment in which companies must succeed in order to sustain a long term viable business.
Gambro, a leading medical device company, is one company for which risks is a daily part of the business and requires constant monitoring. As a producer of medical equipment, lives are dependent on Gambro being fully functional in both the delivery capability and in the quality of the products. Histori-cally, the focus of the risk management has lain in securing patient safety by assessing and examining the products and its quality. Chemical production processes and strict requirements for precision in the products’ operability have made this an important task for Gambro. Legal requirements and su-pervision from authorities has also driven the development. Lately, there has also been an increased awareness of the risk of delivery capability and other business risks. As is often the case, a specific event raised the question and challenged the view of the current practices. In Gambro’s case, an earthquake in northern Italy in 2012 left one major plant unusable and put strain on the company’s global organisation to deliver the necessary products to ensure pa-tient safety. While all treatments could be pursued through and after the crisis the event had a financial impact on the company and highlighted the need for
2 CHAPTER 1. INTRODUCTION
comprehensive and harmonised procedures for identifying and assessing the risk for such disruptions. (Karlsson, 2013a)
1.2
Risk Terminology
The term risk is used in many circumstances and most people do not reflect upon the formal definition, but generally the word means that future events proceed in an unexpected way and cause disturbance to what is the intended target. In daily life, the word can have a number of different meanings (Matt-son, 2000, p. 33)
• A threat or danger (“There is a risk of flooding”).
• A probability (“Driving without seatbelt increases the risk of injury”).
• A combination of consequences’ likelihood and severity.
• A measurement of variability (“Insurance decreases the risk”).
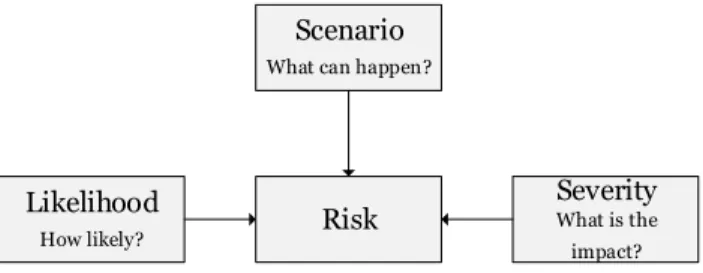
More formalised, the triplet of risk scenario (what can happen), likelihood of occurrence (how often will it happen) and severity of consequence (what are the impacts) will always be present and constitutes the word risk in its full sense. Risk Likelihood How likely? Severity What is the impact? Scenario
What can happen?
Figure 1.1: Components of the term risk
Other definitions of the word has also been proposed by numerous scholars, for instance Harland, Brenchley, and Walker (Harland et al., 2003) proposes the definition “[risk is] a chance of danger, damage, loss injury or any other undesired consequences”, The Royal Society (Society, 1992) goes one step fur-ther and define risk as “. . . the chance, in quantitative terms, of a defined
1.2. RISK TERMINOLOGY 3
Corporate function Scope of risk management
Senior management Competitors, political risks, legal risks Procurement Suppliers’ financial situation, quality Health and Safety Occupational hazards, dangerous materials Operations Machine operability, quality of products Research and Development Product safety, quality of products Logistics Transportation issues, perishable stocks
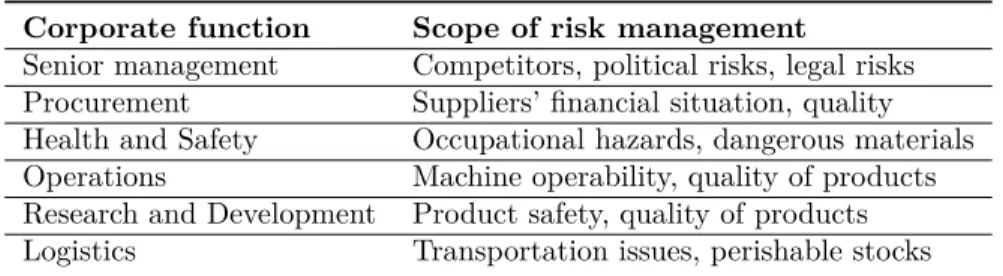
Table 1.1: Examples of risks in different corporate functions
hazard occurring. It therefore combines a probabilistic measure of the occur-rence of the primary event(s) with a measure of the consequences of that/those event(s)”.
In this report, risk is looked upon as the interplay between the likelihood of an event and the severity of its impact. Both categories are accompanied with quantitative measures, as in the definition given by The Royal Society. The risk scenarios are those that can affect Gambro’s ability to deliver and thus poses a business risk to the company.
As mentioned, risk management is present in many parts of a company at different levels. The work can be ongoing or done in project form. Examples of functions and their scope of analysis are given in table 1.1
Scope of analysis and delimiters
Supply chain risk has received increasing attention the last decade. The view on the supply chain as an integrated organisation with a common goal together with increased requirements on logistical performance with Just-In-Time de-liveries and other Lean principles have driven this development (Waters, 2011, p. 10)
Manuj & Mentzer defines eight sub categories of supply chain risks in their paper “Global Supply Chain Risk Management”. Several of the categories are overlapping and risks sometimes fall into more than one category. (Manuj and Mentzer, 2008)
4 CHAPTER 1. INTRODUCTION
No Type of risk Examples
1 Supply Risks Disruption of supply, inventory, schedules, and nology access; price escalation; quality issues; tech-nology uncertainty; product complexity; frequency of material design changes
2 Operational Risks
Breakdown of operations; inadequate manufacturing or processing capability; high levels of process vari-ations; changes in technology; changes in operating exposure
3 Demand Risks New product introductions; variations in demand (fads, seasonality, and new product introductions by competitors); chaos in the system (the Bullwhip Ef-fect on demand distortion and amplification) 4 Security Risks Information systems security; infrastructure
secu-rity; freight breaches from terrorism, vandalism, crime, and sabotage
5 Macro Risks Economic shifts in wage rates, interest rates, ex-change rates, and prices
6 Policy Risks Actions of national governments like quota restric-tions or sancrestric-tions
7 Competitive Risks
Lack of history about competitor activities and moves
8 Resource Risks Unanticipated resource requirements
Table 1.2: Risk categorisation, adapted from Manuj and Mentzer (2008)
As the risk for Gambro’s delivery capability is the main target of this report, not all risk categories apply. Risk category 2, 4, 6 and 8 (operational, security, policy and resource risks) are possible to cover to their full extent by the proposed model. Risk category 1 (supply risks) is being analysed quite roughly on a supplier/component level. Managing the risk of suppliers is already one of the tasks for Gambro’s purchasing function, and the major identified risks should be included in the same model as other risks for the sake of managerial overview. However, different suppliers’ internal processes are not looked into limiting the analysis upstream to the entry of components at Gambro’s facilities. Downstream, the analysis is limited to the exit of finished products from Gambro’s manufacturing unit’s stock. Further transportation towards the customer is not considered in this report. Risk category 3, 5 and 7 (demand, macro and competitive risks) are not considered in this report as they do not directly affect Gambro’s ability to deliver finished products.
1.2. RISK TERMINOLOGY 5
Goal
The goal of the thesis is to develop a risk analysis model that Gambro can use for the assessment and analysis of risks for Gambro of not being able to deliver their products. The model should be based on existing theoretical literature as well as the existing practices within the company today. The model should be easy to understand for the stakeholders, but also theoretically correct and relevant. In addition the model should be quality assured by the authors together with the intended future users and by fellow students not active in the project. The goals are thus twofold:
1. Develop a theoretically correct model for risk analysis with Gambro’s operations. The model should be relevant to the industry and structured to use for all intended stakeholders.
2. The model should be tested by performing a complete risk analysis on one or several of Gambro’s manufacturing units. Strong and weak points should be evaluated in order to prepare for implementation of the model throughout Gambro.
Outcome
The analysis will result in a model for assessing risks within Gambro Global Operations. Theoretical and practical background will lay the foundation for the model and will be motivated in an academic style report. The model will be presented in the form of a manual or working document which can be used unassisted by appropriate stakeholders. In addition the manual will be tested on one or more of the production sites and an evaluation of the results will be made.
Disposition
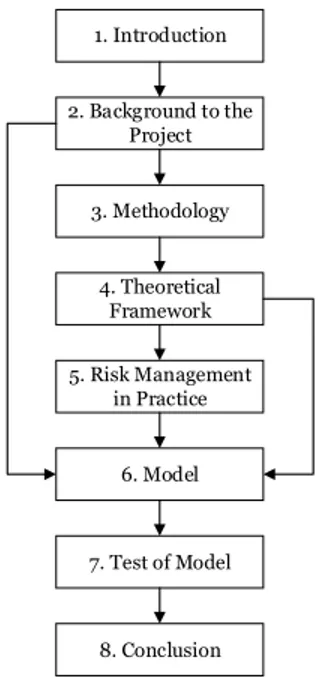
The report is divided as described in figure 1.2. Chapter 2 gives a background to the thesis, introducing Gambro and explaining the events that highlighted the need for risk management and initiated this thesis. Chapter 3 explains the methodology used in this project. Chapter 4 summarises relevant academic literature, which can be seen as a basis for the model proposed. Chapter 5 shows how risk management is used in practice, both within Gambro and in other companies. In chapter 6 the developed model is proposed, using chapter 2, 4 and 5 as a basis. An test implementation of the model in Medolla, Italy
6 CHAPTER 1. INTRODUCTION 1. Introduction 2. Background to the Project 3. Methodology 4. Theoretical Framework 5. Risk Management in Practice 6. Model 7. Test of Model 8. Conclusion
Figure 1.2: The chapters of this report
is described in chapter 7 and the report is summarised in chapter 8 with discussions of the end result,
Chapter 2
Background to the Project
In this chapter, the case company Gambro is introduced. In particular, their business area is described together with a historical background to this project, the earthquake in northern Italy in 2012.
2.1
Gambro
History
Gambro was founded in 1964 on the basis of the invention of one of the world’s first artificial kidneys, which had been developed by Professor Nils Alwall since the mid 1940’s. At a social event he met industrialist Holger Crafoord who was then active in the packaging industry, but felt compelled to develop and market the new and potentially life saving technology. In 1967 the company’s first product was launched and since then Gambro has been one of the world leading companies in its sector. (Gårdlund, 1989, p. 207)
Business areas
Gambro is a global leader in kidney and liver dialysis, Myeloma Kidney Ther-apy and other extracorporeal therapies for chronic and acute patients. The product range includes different types of complete systems for hemodialysis, complete systems for multiple blood purification therapies and systems for water purification in hospital environments. A large part of the sales is made up of disposable products and consumable chemical substances for one time use. (Gambro, 2013)
The company has approximately 7500 employees and 13 manufacturing sites in 9 countries. The manufacturing units operate in 4 different areas.
8 CHAPTER 2. BACKGROUND TO THE PROJECT
The Monitor products are monitor equipment for dialysis and other machines such as water purification systems. The Dialyzer business area produces the disposable filter used for blood and fluid purification. The Solution business area makes the chemical substances used in the different purification processes and their packaging. The Bloodline business area produces catheters, cassettes and other products for vascular access. The machines are standardised in their basic setup but can be modified with different types of filters, catheters and needles to suit the exact need of individual customers. An excerpt of Gambro’s products is displayed in figure 2.1 (Gambro, 2013)
Figure 2.1: An excerpt of Gambro’s products, from left to right: Artis (Mon-itor), Polyflux (Dialyser) and Artiset (Bloodlines)
Global organisation
The corporate headquarters is located in Lund, Sweden in connection to man-ufacturing units in the business areas Machines and Solutions. The main production sites and their locations are:
• Monitors – Lund, Sweden – Crevalcore, Italy • Solutions – Lund, Sweden – Sondalo, Italy – Daytona, USA
2.1. GAMBRO 9
– Yongin, South Korea • Dialyzers
– Hechingen, Germany – Opelika, USA – Meyzieu, France • Bloodlines
– Poggio Rusco, Italy – Prerov, Czech Republic – Tijuana, Mexico
– Shanghai, China
Besides those main factories there is also a small unit for liver therapies in Rostock, Germany. The plants in Crevalcore and Poggio Rusco are tempo-rary arrangements after the earthquakes in Medolla, May 2012. A reinstated facility in Medolla is under development and will take over their function. Research and development is performed in the Lund HQ as well as at the different sites. Altogether, Gambro’s products are offered in more than 100 countries. (Karlsson, 2013b)
Dialysis – Gambro’s main business
In the case of kidney failure, there are three main types of treatment possible, namely:
• Kidney transplantation
• Paritoneal dialysis
• Hemodialysis
A kidney transplantation means that a new kidney from an organ donator is placed into the patient. Paritoneal dialysis is a treatment form where the lining of the belly is used to filter the blood inside the patient’s body. The only treatment that Gambro is currently involved in is Hemodialysis, where a ma-chine is used to filter and clean the blood outside of the patients body.(National Kidney and Urologic Deseases Information Clearinghouse, 2010)
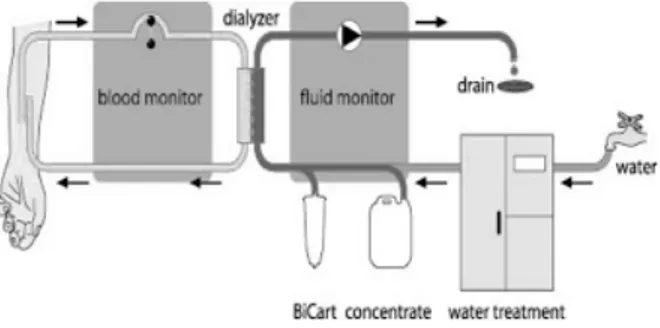
In hemodialysis, blood is first pumped out of the body through a catheter and into the dialyser which is connected to the machine. The arterial blood
10 CHAPTER 2. BACKGROUND TO THE PROJECT
pressure and the inflow pressure is monitored at all times. In the dialyser, the blood is filtered through semi-permeable materials and purified with chemical substances. The clean blood can then be pumped back into the body in a controlled manner. The entire process is schematically illustrated in figure 2.2.
Figure 2.2: Dialysis process
Gambro’s solutions are packaged in highly sterile bags or cylinder shaped containers. The demands on the products and packaging require production processes in very sterile environment and exact specifications on all ingoing materials.
2.2
Medolla Earthquake
In May 2012 an event occurred that changed Gambro’s view on risks. In Medolla, north of Italy there were two consecutive earthquakes with respec-tive aftershocks. In Medolla, Gambro had a large monitor and bloodlines production site. The earthquakes were measuring up to 5.8 on the Richter scale, and left personal injuries, with 27 people dead and over 14,000 people without homes, as well as substantial monetary and physical damages (Pov-oledo, 2013a). Furthermore, the earthquake had major impacts on the Italian economy affecting an area that contributes to over 1 percent of Italy’s gross margin product, among them the Gambro plant. (Povoledo, 2013b)
For Gambro, the earthquake resulted in two destroyed production lines, disrupting all deliveries and prohibiting access to finished goods. Clearly, the event also had a large impact on all employees and their personal lives. The top priority for Gambro was the continuity of patient care and ensuring that the customers had everything they needed to treat their patients. As a response, a steering committee with senior management members and experts
2.2. MEDOLLA EARTHQUAKE 11
from all functional areas was formed to manage the recovery. The following measures were taken immediately: (Gambro, 2013)
• Production of spare parts started in a new plant in Crevalcore, Italy and the Artis and Phoenix monitor production was resumed within 3 months.
• A new automated warehouse in Varese, Italy was instated.
• A new temporary plant in Poggio Rusco, Italy was started to restore the bloodlines production.
• New offices were opened in Modena, Italy, where R&D and other support functions were reinstated.
• Gambro was looking into various options to assure that the customers had access to the products they needed to treat their patients, in coopo-ration the regulatory authorities.
• There were thorough investigations of the status of the customers’ stocks, inventory and weekly consumption in order to prioritise deliveries.
• Employees and extra resources were working double shifts in order to ensure deliveries according to plan.
These cautions together with a global effort, e.g. increased production of Artis cassettes in Tijuana, Mexico, made sure that appropriate deliveries were completed and consequently that the patients safety were ensured. (Karlsson, 2013a)
The catastrophe highlighted the importance of appropriate evaluation of risks and preparation of adequate responses. On beforehand, the risk of an earthquake was seen as very low and the area struck was not even listed as a vulnerable region by the Italian Geophysics Institute. (Povoledo, 2013a)
Chapter 3
Methodology
In this chapter, the research approach is described and motivated and the projects main steps are outlined. A description of the literature studies con-ducted in the beginning of the project is also included.
3.1
Approach
In order to describe and validate the choices a researcher makes, it is important to have a clear and well defined methodology to support the research process. The approach should fit both the intended question of the research, as well as the different stakeholders of the project.
The aim of the project, as described in the chapter 1, is to, with a practi-cal mindset harmonize and develop the assessment procedures for disruption risks within the organisation. The background material will be made up by academic literature on the subject, as well as qualitative, empirical data from interviews and existing documentation both from within and outside of the company. The research can also be considered to be normative, thus giving a result and conclusion based on gathered information.
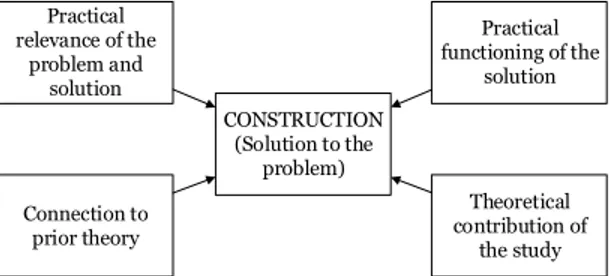
One method that could be used for projects of this practical nature is the constructive research approach, as proposed by Kasanen and Lukka (1993)
The approach is built around a procedure for producing new and innovative constructs to real-world problems, and by that make a contribution to the theoretical field in which it is applied. In addition, the solution should have a clear connection to existing theory in the field and, of course have a practical functionality. The construct can take shape in many forms, such as diagrams, models, organisational structures, plans and commercial products.
14 CHAPTER 3. METHODOLOGY
According to Kasanen and Lukka (1993), the constructive approach should fulfil six requirements based on its core features:
• Focus on real world problems felt relevant to be solved in practice.
• Produce an innovative construction meant to solve the initial real-world problem.
• Include an attempt for implementing the developed construction and thereby a test for its practical applicability.
• Imply a very close involvement and co-operation between the researcher and practitioners in a team-like manner, in which experimental learning in expected to take place.
• Explicitly link to prior theoretical knowledge.
• Pay particular attention to reflecting the empirical findings back to the-ory.
The approach is based in the belief that thorough analysis of what works (and what does not) can make significant contribution to theory. The model has many resemblances to common practice of consultancy projects. However it has a stronger foundation in theory prior to the solution making phase and also includes a reflection of the theoretical contributions in the end phase of the project. Practical relevance of the problem and solution Connection to prior theory Practical functioning of the solution Theoretical contribution of the study CONSTRUCTION (Solution to the problem)
Figure 3.1: The constructive approach suggested by Kasanen and Lukka (1993)
3.2. PROCEDURE 15
3.2
Procedure
The approach is divided into seven distinct steps, each presented below with additional comments on the theoretical background and the execution in this specific project. The following steps are adapted from Kasanen and Lukka (1993):
Step 1. Find a practically relevant problem, which also has potential for theoretical contribution
Comment: The first step is clearly one of the most important in any research project, as it will define a large part of the following work. The topic should ideally both be of practical relevance and not sufficiently analysed in existing academic literature.
Execution: This step has mainly been addressed by the target firm and the academic institution prior to the start of the project by defining the prob-lem scope (Gambro) and accepting it as applicable as a master thesis sub-ject (LTH). The special legal requirements present in the pharmaceutical and medical device sector is another aspect that makes the research novel and the solution unique to the certain case.
Step 2. Examine the potential for long-term research co-operation with the target organisation
Comment: As the problem is of practical nature it is of importance that co-operation between the external researchers and the target firm is functional and does not inhibit the project process.
Execution: By working from office spaces at the company in direct prox-imity to relevant personnel, support and aid from the top management as well as having access to the organisation’s intranet, the level of commitment is considered to be well sufficient. Direct contact at least weekly with Lina Karlsson, the project supervisor, also plays a major role in keeping the connec-tion tight between the project activities and the ultimate research objective. She is also likely to undertake a managerial role of the continued use of the proposed model and will thus act as a future practitioner.
Step 3. Obtain deep understanding of the topic area both practically and theoretically
Comment: This step contains of applying the common methods of information search such as analysis of existing literature, analysis of company internal
16 CHAPTER 3. METHODOLOGY
documents, interviews and observations. Deeper knowledge of the subject from a theoretical point of view should be obtained, primarily by studying existing literature. The researchers should also in this step get a thorough understanding of the circumstances of the particular case setting.
Execution: A literature search is done by scanning article databases for relevant scientific articles. Books and book chapters are also consulted in the theoretical search. This process is further discussed under the Literature review section. In order to understand the case at the company all plant managers are asked to provide any documents previously prepared within the area of risk management and contingency planning. Interviews are also conducted with key personnel at various departments in Lund in order to understand how the processes are currently set up and which concerns that have to be addressed. A benchmarking through interviews with two case companies and the author of one case article is also conducted. The interview objects are chosen due to their expertise and knowledge, together with the project supervisor.
Step 4. Innovate a solution idea and develop a problem solving construction, which also has potential for theoretical contribution Comment: This phase is, for obvious reasons, critical to the ultimate success of the project. Because of the innovative nature of the step, there is little theoretical advice given in the literature but an iterative process with input from both the researchers and the practitioners intended to use the model is usually needed.
Execution: A standard model for risk management, suitable for all in-tended company units is developed based on the previous steps. The model both includes a background of how and why it is designed in a certain way, and instructional documentation for use in the risk assessment processes.
Step 5. Implement the solution and test how it works
Comment: This phase makes the constructive approach differ from many other analytical approaches in that the theoretical design is actually implemented and tested in real life to confirm its applicability. A true belief in the model, both by the researchers and the company practitioners, is a prerequisite for a successful implementation and valid results.
Execution: The model is after the initial development tested and validated in the reconstruction project of the monitor and bloodlines production facility in Medolla, Italy. The test is conducted with the project manager of the
3.3. LITERATURE REVIEW 17
reconstruction as a highly active participant together with managers from the different business areas.
Step 6. Ponder the scope of applicability of the solution
Comment: Once implemented, the researcher should take a step back from the empirical work and evaluate the outcome of the project together with the case organisation. The applicability and critical success factors should be discussed if the outcome is regarded as a success and the possible contributing factors could be analysed if the project has failed in any way.
Execution: As the project goal is to develop a procedure which could be used throughout the company it is very important to document the steps necessary to take for a successful implementation. The test of the model is also used as a base for finding improvement points and success factors before a wider roll-out is started.
Step 7. Identify and analyse the theoretical contribution
Comment: As in the previous step, in the very end of the project, the re-searchers should distance themselves from the previous work and analyse it from an objective point of view. Typically, two main types of potential contri-butions can be found in projects conducted with a constructive approach. The first potential contribution is the novel construction itself as theory is applied to an unknown area. The second possible contribution is the processes and structures that have emerged in the case. Positive relationships between those features and the outcome should be considered and documented if contribution to theory.
Execution: The primary objective of the project is to address the issues raised by the company and to develop a model that works in that particular setting. However, the theoretical knowledge that may be obtained during the different phases is documented, both for the benefit of the organisation and possibly of other project report readers as well.
3.3
Literature Review
When conducting the literature review within the frame of this report a num-ber of different academic areas have been investigated. LibHub, Lund Uni-versity’s search engine has primarily been used to find articles from academic journals. Risk analysis, risk management, supply chain risk management and
18 CHAPTER 3. METHODOLOGY
hazard identification are examples of the key words that have been used. Of-ten times, the reference list of one article has led to findings of other sources. Printed material such as books and article collections have been found us-ing the search engine at the internet based bookstore Amazon.com. Also used, but to a lesser extent, have been the commercial internet search engine Google, primarily to find white papers prepared by consultancy firms such as Accenture, BCG and IBM.
Chapter 4
Theoretical Framework
In this chapter, relevant academic literature is summarised. This is one of three types of input which has been used in this report, the others being practical use of risk analysis and Gambro’s organisational structure.
The theory is furthermore composed by three different levels, resulting in equally many sections in this chapter.
The chapter first discusses risk management in a supply chain perspec-tive, under the name Supply Chain Risk Management. The main focus lies in flexibility, visibility and redundancy, whose importance are highlighted and clarified through case descriptions. In the following section, managerial as-pects are discussed, focusing on the two well established managerial processes within the area: Risk Management and Business Continuity Management. Their similarities and differences are studied as well as what their main ap-plication areas are. In the last section of the chapter four commonly used methods for Risk Identification and Evaluation are presented. The models can be used in both the Risk Management and Business Continuity Manage-ment frameworks.
4.1
Supply Chain Risk Management
Risk management in the supply chain has relatively recently emerged as a recognised field of research in the academic world. The purpose of the re-search has been to develop methods for understanding and managing risk that appears in an organisation’s entire supply chain. (Khan and Zsidisin, 2012, p. 9)
As company’s supply chains have become more and more global at the same time as Lean strategies have pushed down inventory levels, the risk level
20 CHAPTER 4. THEORETICAL FRAMEWORK
in supply of raw material and components have in general become higher. There is also evidence that imply that the social, political and economic de-velopments over the last decade have increased the likelihood of disruptions in complex supply chains. (Khan and Zsidisin, 2012, p. 9)
The development in purchasing strategies is another aspect that has put supply chain risk management higher on the agenda. Especially single sourcing of strategic components and materials is an obvious source of risk which can have severe impact on the buying company’s result if a disruption occurs.
Most of the literature in this field is based upon cases of successful or failed attempts of managing supply chain risk of different kinds. Some relevant examples of those cases are briefly presented in order to provide a background to readers and also inspire Gambro to critically analyse its supply chain.
Ericsson’s disrupted supply of radio frequency chips
On March 18th 2000, thunderstorms over New Mexico caused electrical power fluctuations throughout the state. At a small Philips production facility, the disturbances caused some cooling fans to stop and a small fire broke out in one of the facility’s clean rooms. The fire was put out even before the fire depart-ment arrived 10 minutes later. Philips notified its two customers, Nokia and Ericsson, about the fire and warned that the incident might cause problems in the deliveries of radio-frequency chips for which the production process in the clean room was vital. Promises were also made that the production would soon be re-established and that there was no need for worry. Nevertheless, af-ter 6 months the production was still at only 50 % and new equipment would take even more time to produce and install. For Ericsson, the impact was huge. The Philips plant was the only supplier of the chip needed for one of its most important consumer products. Consequently they would not be able to answer to the strong demand during the short market window which char-acterises the mobile phone industry. Later, the business interruption costs calculated to approximately $ 200M were covered by insurance companies. The insurance payment was one of the biggest in 2001, exceeded only by the 9/11 attacks. (Norrman and Jansson, 2004)
Even though the chip was equally important to Nokia, they avoided the financial impact to a much larger extent due to superior management of the in-cident. The difference was in the response to the information given by Philips on the day of the fire. Nokia immediately started searching for alternative suppliers and secured availability of the vital component. Ericsson, on the other hand, waited for additional information from Philips without contact-ing other companies. Once the magnitude of the problem was realised, Nokia
4.1. SUPPLY CHAIN RISK MANAGEMENT 21
had already tied up the global supply of chips and Ericsson was very limited in its possible strategies. (Norrman and Jansson, 2004)
The case illustrates how much impact a seemingly small incident at an up-stream supplier can have when the downup-stream customer becomes too heavily reliant. It also exemplifies the need for adequate action on information once it is available. No one can foresee and avoid all events, but it is of strategic im-portance to have plans ready for execution when a potentially harmful event occurs.
Visibility
On way of reducing certain risk levels is to increase the so called supply chain visibility. Typically, this means that information sharing is increased and partners let one another in on their flow of data and information. Typical types of information can be stock levels, demands, seasonality, new product launches, unexpected events, lost sales etc. Traditionally, correct delivery size, time and quality have been enough and little information was needed to be passed on. However, having a functioning information flow between partners can be vital when disturbances occur. If information about risks is not passed on, the downstream partners will not be able to act adequately to respond and the supply chain performance is susceptible to risk that otherwise could have been avoided.
In the case of Ericsson and Nokia, Philips did share information about the fire as soon as it happened. Even though the information was not accurate in terms of when operations would be back to normal, there is no evidence that Philips was untruthful in their estimations. The problem was rather that Ericsson did not have the correct structures in place for acting on the information. This turns us onto the next strategy for avoiding supply chain risk. (Sheffi, 2003, p. 10)
Flexibility
Flexibility is one of many buzz words in supply chain management which can be difficult to grasp and translate into concrete actions. When speaking of sourcing, the term can relate to a number of different techniques and strategies in the supplier management. In general it can be describes as an aligned strategy in how many suppliers a company has for a specific component and how the relationship with the supplier(s) is managed. (Sheffi, 2003, p. 215)
For single sourcing strategies a deeper relationship is clearly necessary than if many suppliers are used for the same component or material. For strategic
22 CHAPTER 4. THEORETICAL FRAMEWORK
and engineered components deeper relationship is also of importance to shape prosperous and long term commitments. Simply put, the interface between number of suppliers and the relationship strategy can be explained with figure 4.1 (Sheffi, 2003, p. 215) OK Waste of money Risk OK D ee p Sha llo w Su p p lie r re la ti on s Single Several Number of suppliers
Figure 4.1: Procurement alignment (Sheffi, 2003, p. 215)
The theory and strategies behind those ideas can be described into much more detail than what is possible in the scope of this project; instead one illustrative business case is presented to clarify the concepts and benefits of flexibility.
On the morning of February 1, 1997, Toyota’s sole source of P-valves (a small component used in the break system) Aisin Seiki Co. saw their factory go up in flames following some sparks from a broken drill. The P-valves cost around $ 8-14 per piece but all of Toyotas models were dependent upon them. Toyota was at the time expecting a surge in demand on the Japanease market and was already running 115 % of normal production rate. Being a just-in-time manufacturer, Toyota only had a few days stock of the P-valves in stock and on the road towards their factory. On February 4th, 20 out of 30 production lines had to be shut down due to the lack of P-valves, and it would still be months until Aisin would be back to normal production levels. (Sheffi, 2003, p. 211)
But the response was already in action. The afternoon of the 1st, Toyota and Aisin had gathered potential P-valve manufacturers in a conference room where engineers divided blue prints and valve making assignments. The sup-pliers were found among Toyota’s and Aisin’s regular supplier base as well as some independent companies found in the companies’ extended manufactur-ing network. A total of 65 suppliers replied to the request and started makmanufactur-ing
4.1. SUPPLY CHAIN RISK MANAGEMENT 23
replacements, among them the huge automotive parts manufacturer Denso. Since the P-valves required high precision tapered holes and surfaces, Aisin continued to act as quality controllants, in the supply chain of the P-valves. (Sheffi, 2003, p. 211)
The initial effort did not include financial or legal negotiations; the sup-pliers trusted Toyota and simply went to work as quickly as possible. The car giant’s market position and long history probably acted as clear motivators for the suppliers to perform on their top.
On February 7th, all Toyota plants had started with a single shift and on the 10th, 9 days after the fire, the production volume was at 13-14 000 out of the planned 15 500 cars per day. (Sheffi, 2003, p. 215)
The case illustrates what can be achieved in terms of flexibility when a there is a deep relationship between the supplier and the customer as well as other companies close in geography and business. Nokia demonstrated the same type of capabilities as Toyota when finding alternate suppliers of the radio frequency chips, but in their case the need for supplier collaboration was not as strong, as the component had less need for specific engineering skills than Toyota’s P-valves.
Redundancy
At the same time as lean strategies, just-in-time deliveries and continuous improvement programs often times aims at lowering stock levels and removing unused resources, there has also been a tendency towards building redundancy where it is needed. Most of the time, this redundancy is unused and only acts as a cost driver, companies see it as a necessary evil because the potential cost of a disruption is so high.
The parcel carrier FedEx delivers millions of packages in the US. Many of those packages are transported by plane, especially when the value is high and the transportation time needs to be minimised. The cost for a customer of an undelivered package can potentially be very high. If FedEx has to ground planes and the packages cannot be moved to another carrier, the company is very vulnerable of loosing business due to dissatisfied customers. To reduce the risk of this happening, FedEx each night dispatches two planes, one from each coast of the US, completely empty. The planes fly to Memphis and then returns, again empty. The logic behind this is that if a plane with very important goods is grounded, one of the empty ones can be rerouted and take care of the delivery. Several other planes are also sent half-empty every day for the same reason. (Sheffi, 2003, p. 176)
24 CHAPTER 4. THEORETICAL FRAMEWORK
Other companies use different methods for building resilience. Boston Sci-entific manufactures advanced medical devices and drug coated stents used from keeping arteries open on heart surgery patients. The regulation around the devices is comprehensive and apart from FDA approval, each batch of product must be completely traceable and accompanied with a 40 page doc-ument to ensure the quality. After assessing their risk environment, the com-pany realised that in the case of a disruption for whatever reason the time to get new lines in place and approved would be extensive. Such an event could potentially endanger the future of the entire company. To mitigate the risk, the company has built redundant production lines for some of their products, got them FDA approves and trained personnel in operating them. While this extra capacity is not inexpensive, the company decided it to be worth protecting itself the risk. (Sheffi, 2003, p. 175)
Other companies has spare IT capacity ready to take over important infor-mation systems in case of accidents. Such a solution came in use for Deutsche Bank when the September 11 attack in New York lay much of its facilities in ruin. Data flows were moved to servers in Ireland and the company could continue it operations. (Sheffi, 2003, p. 177)
The point of those cases is that when a disaster hits, redundant capacity might be the only way to deal effectively with the consequences. If the redun-dant capacity is controlled, well managed and not used as a measure against weak processes, it can be strategically correct to take the extra cost as a sort of insurance instead of accepting the risk. Companies have to assess where their greatest vulnerabilities lies and invest accordingly. Extra IT capacity is for instance generally not extremely expensive and may provide a necessary alternative if the normal routes of information are disrupted.
4.2
Organisational Culture
The previous section discussed the requirements for an effective supply chain risk management policy and some of its complexities. In the same way as TQM (Total Quality Management) needs to be implemented in the organisa-tion in order to work, risk awareness needs to be a part of the company culture (Christopher and Peck, 2004, p. 50). As earlier mentioned, there are a lot of motivators for moving up risk management on the agenda, concerning every-one and not only a risk management team. But as with every case of culture change, there are some critical success factors that divide the successful ones from the less successful. Three of the most essential follow below:
4.2. ORGANISATIONAL CULTURE 25
Support from top management
One key success factor for effective risk management practices is sufficient support from the top management. Similar to TQM, risk management has required the top management to set the context within the company and pass their views down to the rest of the organisation. With that in mind together with the development of risk management, the assessments of risks are getting increasingly important for companies, and take up more and more of the top management’s time. (Waters, 2011, p. 80) (Christopher and Peck, 2004, p. 50)
Waters states that risk management is of such holistic nature, that it needs to be initiated and followed up by the top management. It is not only suggested that it is the best solution, but also that it is a requirement in order to be successful. Furthermore he summarises a list of requirements that the board of directors should at the very least do: (Waters, 2011, p. 80)
• Define the organisation’s attitude towards risk, its philosophy and the strategic direction of risk management
• Create an appropriate environment for risk management, with necessary systems and resources
• Publish risk management policies defining attitudes, approaches and responsibilities
• Know about significant risks that the organisation faces
• Understand the potential consequences of these risks for stakeholders
• Ensure that appropriate processes are in place for identifying, analysing and dealing with risks, and that these work effectively
• Communicate with stakeholders to ensure that everyone is aware of their responsibilities for risk management
• Know how the organisation will manage a crisis • Assess the performance of risk management
Furthermore, the annual Global Risk Management Study 2011 done by the consultancy firm Accenture, suggests establishing a dedicated corporate-level risk executive with complete oversight and visibility across the business as a critical success factor that distinguish top risk performers from lower. (Accenture, 2011)
26 CHAPTER 4. THEORETICAL FRAMEWORK
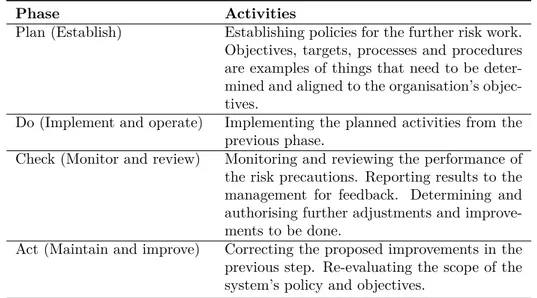
Phase Activities
Plan (Establish) Establishing policies for the further risk work. Objectives, targets, processes and procedures are examples of things that need to be deter-mined and aligned to the organisation’s objec-tives.
Do (Implement and operate) Implementing the planned activities from the previous phase.
Check (Monitor and review) Monitoring and reviewing the performance of the risk precautions. Reporting results to the management for feedback. Determining and authorising further adjustments and improve-ments to be done.
Act (Maintain and improve) Correcting the proposed improvements in the previous step. Re-evaluating the scope of the system’s policy and objectives.
Table 4.1: Plan Do Check Act cycle in a risk management perspective (Inter-national Standard Organisation, 2012)
Cross-Functional Governance
Another point that most literature agrees on is the importance of cross-functional risk management teams. Waters (2011) and Christopher and Peck (2004) all argue that a cross-functional team needs to be implemented in or-der to get a complete overview and monitor the functions of the company in a good manner. The Accenture study (Accenture, 2011) goes beyond that and states that organisational silos are actually preventing organisations to mitigate risks in an effective manner.
Continuous Process
Literature of Risk Management and Business Continuity Management sug-gests that the risk management process needs to be continuous and changed to fit the prevailing conditions in order to be effective and efficient. It can in other words never be seen as finished. (Waters, 2011, p. 97) (International Standard Organisation, 2009, 2013)
This is ensured by clear responsibilities and a cyclical process. ISO stan-dards as well as Waters suggest implementing a well recognised cyclical ap-proach called the PDCA-cycle (Plan Do Check Act). The cycle, described in 4.1, is adapted from ISO 22301:
4.3. MANAGERIAL RISK PROCESSES 27
4.3
Managerial Risk Processes
In research, there are two well-recognised high-level processes that stand out within the area of risk, namely Risk Management and Business Continuity Management. The different processes’ activities are quite similar and overlap to a high degree. Their respective definitions are widely debated. Some prac-titioners argue that BCM is a part of RM while others argue the opposite. A third group even argue that they are completely distinct processes.(Chadist, 2012, p. 23). However, the consensus seem to be that Risk Management is focusing on the risks that are known and can be mitigated in some proactive way, whereas BCM is primarily focusing on reducing the risk consequences, regardless of the cause (that might be unknown beforehand). (Waters, 2011, p. 233)
Risk Management has been addressed by the International Standards Or-ganisation (ISO) in their extensive document ISO 31000, first published in 2009. Business Continuity Management has even more recently gotten sim-ilar attention with the guiding document ISO 22301 published in 2012 and the more detailed version on the same subject ISO 22313 published in 2013. Below follows a description of the ISO’s two approaches, also supported by other academic sources.
Risk Management
The Royal Society defines Risk Management as “the making of decisions re-garding risks and their subsequent implementation, and flows from risk esti-mation and risk evaluation” (Society, 1992, p. 3). The Risk Management process is about understanding risks within an organisation, and minimising their impact by either reducing their likelihood or severity.
ISO 31000 includes the following steps in Risk Management (International Standard Organisation, 2009):
• Establishing the context • Risk Assessment
– Risk Identification – Risk Analysis – Risk Evaluation • Risk Treatment
28 CHAPTER 4. THEORETICAL FRAMEWORK
Step 1 - Establishing the context
The initial step of a Risk Management process is about determining how the rest of the steps are to be done. Furthermore it involves defining goals, responsibilities, methodologies, measurements and limitations of the process. One important activity is defining risk criterions, e.g. severity and likelihood ratings, which must reflect the organisation’s values, objectives and resources.
Step 2 - Risk Assessment
Risk assessment are the activities that systematically identify, analyse and evaluatee the risk consequences and causes for disrupting the organisation’s prioritised activities or resources. Simpler put, it is about finding risk causes, evaluate them in terms of likelihood and severity, and propose a suggestion of how to possibly face them.
Step 2a - Risk Identification
There is an abundance of risk identification methods, usually developed with different industries and production processes in mind. As risks can appear in an endless variety and no deterministic information of the likelihood and severity exists beforehand, there is no perfect identification method that fits all situations. Working in a structured manner will support and stimulate the identification, and reduce the chance of missing critical risks to the organisa-tion (Waters, 2011, p. 122). In contrast, if the identificaorganisa-tion is left to informal arrangements, there is a high chance that they are found on a too high or low level, either trying to find the most trivial risks, or missing important risks that could have severe consequences. It is not always clear what level of detail that should be, literature naturally suggests that it differs from organisation to organisation, and the level should be adapted to the complexity and po-tential consequences of the organisation and its activities. In the end it comes down to management judgement (Waters, 2011, p. 105) .
One way to stimulate the identification phase is to sort risks into different categories and then assess the different categories with some type of tool. One example of such a categorisation, done by Manuj and Mentzer, was described in the introduction of this report (Manuj and Mentzer, 2008). Some typical risk identification and evaluation tools are Failure Mode and Effect Analysis (FMEA), Fault Tree Analysis and Hazard and Operability Studies, which will be further elaborated on later in this chapter. The tools are furthermore typ-ically divided into two main categories; deductive and inductive approaches. With deductive thinking an undesired scenario is imagined and possible causes
4.3. MANAGERIAL RISK PROCESSES 29
are found and investigated (“what can cause this undesired scenario”). With inductive thinking, all sub-steps of a process is gone through and possible failure modes in each one are found and investigated (“what can be the effect of this event occurring”).
When trying to identify risks of larger magnitude, an unstructured brain-storming approach may be more effective than specific frameworks. However, using tools such as a map of the site, process maps and component lists can help the brainstorming. (Kelly, 2013)
Step 2b - Risk Analysis
In order to prioritise the risk responses, if they are to be reduced in some way or deemed acceptable, an evaluation needs to be done. As mentioned before, the term risk consists of likelihood and severity, apart from a description of what is happening. As a consequence, this step consists of assigning risks from the risk identification with quantitative measurements in terms of likelihood and severity.
Step 2c - Risk Evaluation
This step is a quite natural consecutive step where the risk analysis’ outcomes are evaluated. The evaluation is primarily focusing whether the risks are accepted or any action should be implemented, depending on the level of acceptability that was set in the first process step (establishing the context). In addition the evaluation involves setting priorities of the risks, determin-ing what risks are more important to treat than others.
Step 3 - Risk Mitigation or Risk Treatment
By the term risk mitigation it is the pro-active activities to deal with risks that are meant. There are of course many approaches for dealing with risks, if not endlessly many. However some basic principles can be generally be seen and elements from accept, share, transfer, reduce and avoid risks will most certainty be included. (Norrman and Jansson, 2004)
• Risk acceptance could for instance mean neglecting risks consequences that are very small.
• Risk sharing could be contracts that are shaped to let more than one stakeholder bear the consequences if the risk was to happen.
30 CHAPTER 4. THEORETICAL FRAMEWORK
• Risk transferring is letting another organisation take over the whole risk. Insurance is an example of this strategy.
• Risk reductions are the strategies that reduce risks, either in terms of occurrence or severity. An example of an occurrence reduction would be using a fireproof material decreasing the likelihood of a fire. An example of reduction of severity is implementing sprinklers to decrease the fire’s impact.
• Risk avoidance are the strategies that eliminate the risk source com-pletely. For instance if there is some process connected to a risk which could be eliminated or changed to an alternative one, the risk would be avoided.
There is no systematic way to determine what response to prefer since the environment differs greatly between organisations and from situation to situ-ation. However it quite naturally involves balancing benefits with drawbacks, where factors to consider are financial costs, time of implementation and the result of mitigation strategy in terms of organisational goals. Risk sharing and transfer may in fact not be mitigating the risk from a supply chain per-spective. The focal company may nevertheless decrease their potential risk impact by those strategies. It can therefore be an effective incentive to make supply chain partners implement actual risk treatments themselves.
Norrman and Jansson (2004) exemplify this decision in their article about Ericsson’s pro-active work, as seen in figure 4.2. Ericsson quite simply compare cost of a preventive action to the business value that also is measured in financial terms.
Step 4 - Monitoring and review
As discussed, the Risk Management Process needs a feedback loop in order to be relevant for an organisation. The aim is to ensure that the procedures and strategies are maintained continually. This can involve periodic and ad hoc reviews, with different benefits. Although the reviews should be done continually, they are particular important when introducing new products, processes, equipment, facilities, sites, suppliers, trading partners or any other significant change. (Waters, 2011, p. 229)
Business Continuity Management
All significant risks are not known, even if identifying them is the aim of a Risk Management system. Many times, organisations are hit by risks which
4.3. MANAGERIAL RISK PROCESSES 31
Protection
C
os
t
Figure 4.2: Cost of preventive actions versus the business interruption value (Norrman and Jansson, 2004)
were inherently unknown prior to the event. This problem is the main idea behind Business Continuity Management, which is not based on an analysis of identified risks. Instead BCM looks for ways of dealing with disruptions regardless of how they occur. For instance an organisation might consider the failure of an IT-server and what to do to get operations going, regardless of how the server failed. The term Business Continuity Management is defined, by the distinguished researchers Hiles and Barnes, as:
"The development of strategies, plans and actions which provide protection or alternative modes of operation for those activities or business processes which, if they were to be interrupted, might otherwise bring about a seriously damaging or potentially fatal loss to the enterprise" (Hiles, 2010)
Business Continuity Management involves the following activities (Inter-national Standard Organisation, 2012):
• Business Impact Analysis
– Identify Critical Activities and Resources
32 CHAPTER 4. THEORETICAL FRAMEWORK
• Risk Assessment
– Identify risk of disruption. – Systematically analyse risk
– Identify what risks that require treatments and what kind of treat-ment
• Business Continuity Strategy
– Establish Business Continuity Plans for stabilising, continuing, re-suming and recovering the prioritised activities
– Mitigating and responding to and managing impacts • Protection and Mitigation
– Reduce likelihood of disruptions – Reduce the severity of disruptions • Exercise and Monitoring
– Review & Update – Incident handling – Training
The different activities in a Business Continuity Management system will be elaborated on below. Some of the activities are almost identical to those in the Risk Management process, and will not be discussed in detail.
Step 1 - Business Impact Analysis
As one of the main ideas with BCM is focusing on the critical activities and resources opposed to all, the Business Impact Analysis (BIA) should be seen as the foundation on which a comprehensive BCM is based on. By focused efforts, the further assessments are considering the activities and resources the business really depends on and is disregarding the others. This will let the organisation focus on what is important and will give a better end result (Khan and Zsidisin, 2012, p. 192). The critical activities and resources are defined as those that cannot be re-established or recovered in an easy manner. Each activity or resource is also assigned a related recovery time objective (RTO), meaning how long the organisation can accept the activity or resource to be unavailable without suffering significant loss.