© 2019 Svensson & Bergström. This is an Open Access article distributed under the terms of the Creative Commons Attribution-NonCommercial 4.0 International License (http://creativecommons.org/licenses/by-nc/4.0), permitting all non-commercial use, distribution, and reproduction in any medium, provided the original work is properly cited.
ISBN: 978-91-88898-41-8
PATTERNS OF PERFORMANCE VARIABILITY:
A MESO-LEVEL UNDERSTANDING OF
PSYCHIATRIC DISCHARGE
Jakob Svensson
1Johan Bergström
11
) Lund University, Division for Risk Management and Societal Safety, Sweden
AbstractIncident reports, as well as surveys, indicate that there is a risk of healthcare injuries when psychiatric patients are discharged from the hospital, with continued treatment as an outpatient. In this study, we are ultimately interested in the resilience of psychiatric care in this risky discharge, i.e. how the system adapts to cope with the risks. We understand that there are margins of maneuver in everyday psychiatric work, with several strategies potentially leading to acceptable performance and we seek to map the performance variability of such strategies. The aim of this study is to visualize retrospective discharge and compare findings of variability within the Stockholm Center of Dependency Disorder different wards. To understand what is "normal" from an organizational point of view, the study will analyze patterns from clinic visits where patients had been discharged with a follow-up visit between 2009 and 2018. This is a retrospective longitudinal correlation study with a strategic selection. Data consist of 71 125 anonymous quantified patients, who have been hospitalized and who, at the time with discharge, have been booked to a revisit as an outpatient. Results are compared between 81 different wards in Stockholm County. Results show that a significant amount (42%) of the patients do not visit the outward as planned by health care, but instead seek help from the emergency ward. Further, a variance in cancellation of the follow-up visit appear as an outcome for the data. Retrospective analysis of quantified data seems to be a valuable tool for widening the understanding of performance variability and could help healthcare management understand where resources should be prioritized. The results also show how patients themselves have, and use, adaptive capacities in order to navigate the system, and that this has consequences at higher system levels.
Keywords: Performance variability, Psychiatric discharge, Resilience, Retrospective analysis,
1. INTRODUCTION
In safety research, resilience is often defined as a capacity to adapt to risky and complex environments [1]. To understand resilience is to understand performance variability and pressure [2], [3]. This means that there are degrees of freedom in the strategies used to achieve acceptable outcomes of work. In this paper, a method to capture such strategies, or patterns, in psychiatric health care is presented. The method aims at visualizing a system’s (a psychiatric clinic) way of absorbing and adapting to pressure; i.e. its resilience. In Swedish health care, incident reporting is a common starting point for patient safety strategies, but it only captures a small fraction of occurred events [4]. However, an organization with low reporting rates are more likely to suffer from fatal accidents, and vice versa [5]. A large number of incident reports are often interpreted as something positive but the amount of data can also foster an illusion of a healthy patient safety culture as the organization has numbers to lean against [6]. Incident reporting is not likely a productive way to understand
organizational performance and visualize where capacity stressors occur. Often the response to an adverse event in health care is to try to standardize processes, eliminate contributory factors and improve barriers, [7]; i.e. limit performance variability. The pressure for increased efficiency in modern healthcare has resulted in more control systems and less flexibility in daily work [8]. The idea that this would lead to a safe system seems to be based on the impression that our systems are already safe but needs to be protected against irrational, unreliable and erratic people who deviate from the procedures and routines of (safe) work [9]. In this study we focused on system resilience connected to a specific risk of healthcare
injuries when patients are discharged from the hospital, with continued treatment as an
outpatient. This risk is highlighted by the Stockholm Center of Dependency Disorder incident reports as well as in surveys1 conducted by Stockholm Health Care Services, where the staff is asked about what they consider to be the most significant patient safety risk in psychiatry. In resilient health care research, a micro-level approach and qualitative research design are frequently used. However, to study resilience as a complex adaptive system [10] suggest data collection on meso and macro level to increase the understanding of organizational context dependency, and strengthen the understanding of resilient health care. Furthermore, from a complexity perspective; considering dimensions of time and space becomes highly important for the configuration of work [11], and studying resilience at a meso-level trough new
methodological tools can benefit the understanding of organizational strain through time and space [12]. Consequently, the aim of this study is to visualize retrospective discharge and compare findings of variability within the Stockholm Center of Dependency Disorder’s different wards. To understand what is "normal" from an organizational point of view, the study has analyzed patterns from clinic visits in different locations throughout the Stockholm County and where patients had been discharged and received a follow-up visit between 2009 and 2018.
2. STUDY METHODOLOGY
The analysis was made possible by using a model of time-lapse of patient visits. The stakeholders can thereby in a matter of seconds get an estimate of how performance
variability (within a well-functioning clinic) looks across 93 units. Some units share the same address and some has changed name during the years. Today Stockholm Center of
2.1. Context
Stockholm Center for Dependency Disorders is part of the specialized psychiatry in
Stockholm County. The clinic is organized within Stockholm County Councils and provides outpatient and inpatient health care, as well as emergency care for patients with addiction problems. The studied clinic is the largest psychiatric clinic in Stockholm, with no financial deficit in the last five years. The main patient groups are people with a dependence on
alcohol, illegal drugs or pharmaceuticals. The clinic is located in 81 different locations across the county. The lead author is employed within the studied clinic which has favored the ability to extract statistics. The capability of extracting patterns from patient visits was made possible through the authors’ preunderstanding of the organization, and the employees’ perception of how patient suffer from avoidable harm.
2.2. Description of research design
The study was conducted as a retrospective longitudinal correlation study with a strategic selection. The research design originated from the idea that quantitative data was lacking when studying resilient health care [10]. New sources were needed to support decision makers and to understand performance variability at a meso-level. The data consist of anonymous quantified patients who have been hospitalized within the Stockholm Center for Dependency Disorders and who, at the time of discharge, have received a follow-up visit as an outpatient. The analysis involves visualizing the day-to-day discharge process and its variability. The focus for the developed method has been to support the quality improvement of system performance measurement.
2.3. Data extraction
To understand performance variability, the study used quantitative data to visualize patterns over time. Data was obtained by designing a data extraction code that meets the requirements of the study. The code was developed in the autumn of 2018 by analyzing IRS-reports and the result from SLSO’s surveys of patient safety culture. The code was written by IT technician at SLSO Psychiatric division. The code was then used in the existing patient file system and a master copy of quantities could be transferred to Excel. The selection contained 19 857 patient distributed on 71 126 patient visits. Every patient has been discharged from inpatient care and received a return visit (follow-up) as an outpatient. Only those who were resident in Stockholm were included and only bookings within the Stockholm center of Dependency disorders were included. Discharges that were followed by re-hospitalization or readmissions without a follow-up in between were excluded. Similarly, the discharges that did not have had a subsequent follow-up in outpatient care were excluded.
Figure 1: Shows the selection process with inclusion and exclusion criteria.
Microsoft SQL Server Management Studio (SSMS) was used for extraction of the data. The program organizes a large amount of data in a hierarchical system. By using this system, data extraction through a specific code can generate data linkage that helps visualizes patterns over time.
2.4. Data analysis method
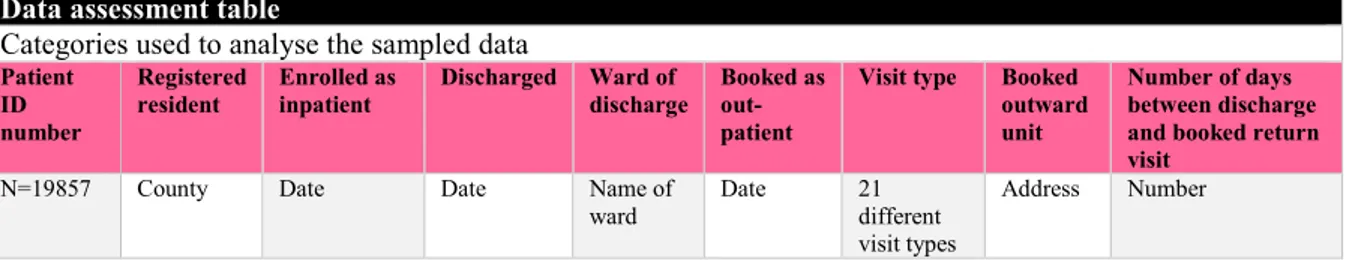
The aim of the analysis was to illustrate system variability and to synthesize tendencies. In phase one every patient was given a unique number starting with 1, 2, 3…, etc. up to a total of 19 857. By listing the patient numbers we could sort out how many times a specific patient (number) had received a follow-up visit as an out-patient. Each number was listed in
individual lines with data under each category (see Figure 2). The name of the ward was used as a control instrument for the data. If abnormalities arose we could locate from which ward the discharge took place and further investigate the deviance. No deviances occurred from the data sample, and later on, the result did not take into account witch ward was responsible for the discharge.
Data assessment table
Categories used to analyse the sampled data
Patient ID number
Registered
resident Enrolled as inpatient Discharged Ward of discharge Booked as out-patient
Visit type Booked outward unit
Number of days between discharge and booked return visit
N=19857 County Date Date Name of
ward Date 21 different visit types
Address Number
Figure 2: Shows the categories for the data assessment table which consisted of 71 126 lines in Excel
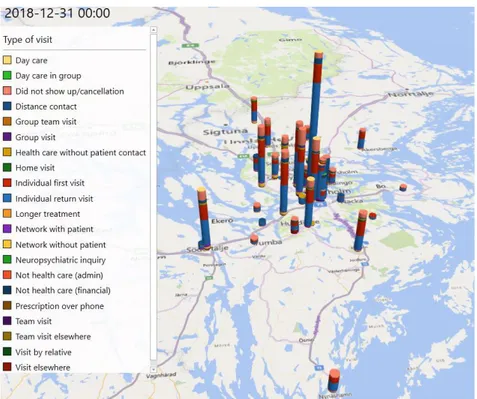
In the second phase, the address of the booked outward unit was listed on a map and visualized through a space-time continuum by each patient visit types (see Figure 3). The study did not evaluate the quality of care, nor assess the outcome of a received treatment. The purpose of the visualization was to get a deeper understanding of inconstancies within the follow-up care. Further, the visualization helps to understand where the organizational stressors occur.
• Resident in Stockholm • Inpatient within
the clinic between 2009-2018 • Booked as a
follow-up and out-patient within the clinic Inclusion • Re-hospitalisation without a reserved booking • Re-admissions • Out-patient visits
outside the clinic
Exclusion 19857 patientsDistributed on 71126 patient visits Selection
3. INITIAL FINDINGS
The simulation and 3D map visualizes the patients’ paths through psychiatric healthcare. Figure 3 below illustrate outward units within the Stockholm Center for Dependency Disorder distributed across Stockholm County. In a simulation, the bars grow over time and you can zoom-in and pinpoint each individual ward unit and find out statistics on different patient visits. The different colors represent different types of visit. The model illustrates how normal health care outward transfer occurs. The median of the number of days for the patient, from inpatient care to a visit as an outpatient was six days. At first glance, the wards seem to have a similar distribution of visit-types across the county, however, the simulation shows a
discrepancy in most of the visit types. Canceled visits fluctuate in different outward units whereas the availability for specific health care most likely affects the patient motivation to show up. This is most likely because some units, for example, are specialized in drug-assisted treatment with methadone, which favors follow-up treatment for heroin dependency. A particularly interesting pattern which became visible in the analysis was when a certain patient visited the emergency ward instead of the pre-booked outward visit; i.e. when the patient had a reserved time for the outward visit but within the timeframe between inpatient care and the outpatient visit (median six days) patients revisit the emergency ward instead of the outpatient visit. This pattern was seen in 42 percent of the pre-booked outward visits. Further, by analyzing the statistics, a patient with multiple visits could be identified. 85 patients have visited the emergency ward 50 times or more under the ten year time period, 15 patients more than 100 times and two has done this more than 200 times.
Figure 3: Show patient visits accumulated under a 10 year period. Visits to the clinics emergency ward have been excluded in this image.
4. DISCUSSION
The findings of this study are preliminary and raise several questions which will be addressed in our future research. Most strikingly, the visualization shows that a large portion (42%) of all patients that received a follow-up visit, does not complete this transition, but instead they revisit the emergency ward, and do not receive the planned care treatment (at least not at the planned time and place). The patients who visit the emergency ward instead of their planned outpatient visit, do this on average within 20 days (calculated from median value). This tells us that there is both temporal (in terms of when a patient is booked for an outward visit as well as when the patient actually seeks care) and functional (in terms of what kind of care the patient seeks; the emergency ward or the outward) performance variability in the process of revisiting the health care system. The system allows for such performance variability by offering a margin of maneuver [13] and the patients use their adaptive capacities [14]. The variability in the patient visits shows the ordinary patient flow and illustrates the interplay between the micro (patient) and meso (clinic) level of the system. Further, the analysis indicates a patient demand that can be anticipated through the model and
stakeholders/managers could use compensatory strategies [15] to provide appropriate resources to meet this performance variability.
[16] argues that the capacity to treat patients might be shattered if patients visit the emergency ward at a rate that is higher than the rate by which they can be treated and discharged.
According to The National Board of Health and Welfares management system for systematic quality work [17], incident reports should be accumulated to enable the healthcare provider to see patterns or trends that indicate weaknesses in healthcare quality. As we discussed in the introduction the incident reporting system does not allow for trustworthy patterns that reflect everyday performance. The model in this paper is based on statistics from patient visits and have not been rendered in its presentation.
The ability to anticipate challenges and be proactive could be characterized as an expression of resilience [18], however, the typical means to do so might foster a different system performance. The care provider has a legal obligation to develop methods for follow-up and analyzing quality and safety within the management system [17]. Chapter 3 in The Swedish Patient Safety Act [19] states that the healthcare provider must plan, manage and control the activities in such a way to maintain the requirement for good healthcare, and that the
healthcare provider takes the necessary measures to prevent patients from healthcare injuries. This typically promotes a bureaucratization of patient safety with increased levels of
regulation, control systems and routines [6]; i.e. a reduction in performance variability. The results show a gap between psychiatric care as done and as imagined, and highlight questions of whether the idea of pre-booked follow-up visits in the outward is the right way to organize care for the patient with dependency disorder. The emergency ward needs a margin of maneuver [13] and adaptive capacities within the unit to avoid performance breakdown [8]. By anticipating the follow-up within the emergency ward, could we give better treatment? Or, if we anticipate a follow-up within the emergency ward, in conjunction with discharge, how does that impact the health care planning? Within normal performance (patient) variability,
The model visualizes separate ward units and their proportion of patient visits. There is indeed a risk that it might be used normatively, i.e. to identify "bad" units within the clinic. However, the data does not suggest why some ward units have more canceled visits than others, or why some units have fewer visits in total. The result does not contain contextual factors, such as patient status or the units precondition to handle patient visits. Instead, the study provides a methodology to generate meso-level patterns from micro-level interactions.
The findings of patients with multi-visits during the ten-year time period opens up for new challenges for the management within the clinic. How can these patients be reached by more profound care? Relapse of addiction outlines a normal course of the dependency disorder. Patients recurrently seeking healthcare are not an abnormal process. However, a patient with several visits to the emergency ward, could possibly have a larger risk for health
complications. Future research will compare the mortality rate to the number of visits and self-rated health perception at admission and discharge from Stockholm center for
dependency disorder, perceived by patients with alcohol dependency disorder.
5. CONCLUDING REMARKS
Retrospective analysis of quantified data seems to be a valuable tool for widening the understanding of performance variability by generating a meso-level aggregation of a vast amount of micro-level interactions. In this study 71 126 patient visits by 19 857 patients were aggregated in a simulation showing the patterns by which patients interact with the
psychiatric care following discharge. Our initial findings suggest that the system creates a space of temporal as well as functional variability and that the patients themselves use their adaptive capacities to navigate this space. Future research is needed in order to draw
normative conclusions in terms of the ‘good’ (such as the patients getting to seek follow-up care swiftly) and ‘bad’ (such as the emergency ward going solid) consequences of this performance variability.
REFERENCES
[1] Bergström, J., van Winsen, R., & Henriqson, E. (2015). On the rationale of resilience in the domain of safety: A literature review. Reliability Engineering & System Safety, 141, 131-141. https://doi.org/10.1016/j.ress.2015.03.008
[2] Braithwaite, J., Wears, R. L., & Hollnagel, E. (2015). Resilient health care: turning patient safety on its head. International Journal for Quality in Health Care, 27(5), 418- 420. https://doi.org/10.1093/intqhc/mzv063
[3] Patterson, E. S., Cook, R. I., Woods, D. D., & Render, M. L. (2006). Gaps and resilience. In M. S. Bogner (Ed.), Human Error in Medicine (second edition). Hillsdale, NJ:
Lawrence Erlbaum Associates.
[4] Schildmeijer, K., Unbeck, M., Muren, O., Perk, J., Harenstam, K. P., & Nilsson, L. (2013). Retrospective record review in proactive patient safety work - identification of noharm incidents. Bmc Health Services Research, 13. 282
https://doi.org/10.1186/1472-6963-13-282
[5] Saloniemi, A., & Oksanen, H. (1998). Accidents and fatal accidents - some paradoxes. Safety Science, 29(1), 59-66. https://doi.org/10.1016/S0925-7535(98)00016-2
[6] Dekker, S. W. A. (2014). The bureaucratization of safety. Safety Science, 70, 348- 357. https://doi.org/10.1016/j.ssci.2014.07.015
[7] Pedersen, K. Z. (2016). Standardisation or resilience? The paradox of stability and change in patient safety. Sociol Health Illn, 38(7), 1180-1193.
https://doi.org/10.1111/1467-9566.12449
[8] Cook, R., & Rasmussen, J. (2005). "Going solid'': a model of system dynamics and consequences for patient safety. Quality & Safety in Health Care, 14(2), 130- 134.doi:10.1136/qshc.2003.009530
[9] Wrigstad, J., Bergström, J., & Gustafson, P. (2017). One event, three investigations: The reproduction of a safety norm. Safety Science, 96, 75-3.
https://doi.org/10.1016/j.ssci.2017.03.009
[10] Berg, S. H., Akerjordet, K., Ekstedt, M., & Aase, K. (2018). Methodological strategies in resilient health care studies: An integrative review. Safety Science, 110, 300- 312.
https://doi.org/10.1016/j.ssci.2018.08.025
[11] Dekker, S., Bergstrom, J., Amer-Wahlin, I., & Cilliers, P. (2013). Complicated, complex, and compliant: best practice in obstetrics. Cognition Technology & Work, 15(2), 189- 195. https://doi.org/10.1007/s10111-011-0211-6
[12] Bergström, J., & Dekker, S. W. A. (2014). Bridging the Macro and the Micro by Considering the Meso: Reflections on the Fractal Nature of Resilience. Ecology and Society, 19(4). https://doi.org/10.5751/Es-06956-190422
[13] Stephens, R. J., Woods, D. D., & Patterson, E. S. (2015). Patient Boarding in the Emergency Department as a Sympton of Complexity-induced Risks. In R. L. Wears, E. Hollnagel, & J. Braithwaite (Eds.), Resilient Health Care The Resilience of Everyday Clinical Work (Vol. 2, pp. 129-143): Ashgate.
[14] Schubert, C. C., Wears, R. L., Holden, R. J., & Hunte, G. S. (2015). Patients as a Source of Resilience. In R. L. Wears, E. Hollnagel, & J. Braithwaite (Eds.), Resilient Health Care The Resilience of Everyday Clinical Work (Vol. 2, pp. 207-223). Farnham: Ashgate Publishing Limited.
[17] The National Board of Health and Welfares management system for systematic quality work (SOSFS 2011:9). https://www.socialstyrelsen.se/publikationer2011/2011-6-38. Accessed 4 February 2019.
[18] Ekstedt, M., & Cook, R. (2015). The Stockholm Blizzard of 2012. In R. L. Wears, E. Hollnagel, & J. Braithwaite (Eds.), Resilient Health Care The Resilience of Everyday Clinical Work (Vol. 2, pp. 59-73). Dorchester: Ashgate.
[19] The Swedish Patient Safety Act (SFS 2010:659).
https://www.riksdagen.se/sv/dokumentlagar/dokument/svensk-forfattningssamling/patientsakerhetslag-2010659_sfs-2010- 659. Accessed 4 February 2019.
[20] Schauer, C., Everett, A., Del Vecchio, P., & Anderson, L. (2007). Promoting the value and practice of shared decision-making in mental health care. Psychiatric Rehabilitation Journal, 31(1), 54-61. https://doi.org/10.2975/31.1.2007.54.61