Applicability of quantitative techniques
in studies of colonialism: Towards
addressing questions of subjectivity
Ambe Njoh
Introduction
As an area of scholarly inquiry, studies on colonialism possess more than historical value. They provide a sound basis for understanding contemporary dynamics and pre-dicting the future trajectories of development initiatives in erstwhile colonized polities. However, the time-tested methods and techniques for undertaking work of this genre are not contained within the toolkit of traditional history scholars. Rather, they consti-tute part of the apparatus of the emerging subfield of quantitative history. This latter “involves the use of numeric data—or other evidence that can be counted—as a primary source for analysis and interpretation” (History Matters, online para. 1). While quanti-tative methods and techniques have actually been employed in practice (see e.g., Njoh 2012; Fox 2013), no effort has been made to provide some guidelines as to when and how to use them. Consequently, there is a glaring gap in knowledge of the utility and applicability of these very useful methods and techniques in historical studies. My main objective in this article is to contribute to efforts addressed to closing this lacuna.
I proceed in the following order. Initially, I provide some background information on the history of quantitative history. Then, I advance a case for the use of quantitative tech-niques and analysis in colonial and post-colonial studies. Next, I highlight some of the major barriers to quantitative research in these studies. Following this, I draw on some of my own works to illustrate the strengths of employing quantitative methods and com-mensurate techniques to analyze historical data. I end the article with some concluding remarks.
Quantitative versus qualitative approaches to research
It is often tempting to consider the use versus non-use of numbers as the distinction between quantitative and qualitative research. Yet, the mere appearance of numbers—as say, dates, population size, geographic area, and quantifiable demographic features—in a study does not necessarily make it quantitative. What distinguishes a quantitative stu-dy from its qualitative alternative is the manner in which its numerical attributes or data are presented and/or manipulated. For instance, a study that presents casualty statistics on natural disasters for a certain period qualifies as qualitative. It becomes quantitative once it attempts to show how and why the statistics differ from one period to another.
Thus, what makes a study quantitative is not simply the simple use of numeric data. Rather, it is the manner in which the data are manipulated that makes it quantitative or not. Numeric data come in many forms, shapes and sizes. These may be data that were originally collected in quantitative form, such as the size of the population, families, houses, building plots, and streets in a certain city for a specific period. They may also be data that were initially in nominal or ordinal form. The techniques that can be sum-moned for such research range from those calling for no more than rudimentary profic-iency in mathematics, to those requiring sophisticated mathematical skills.
However, it is necessary to mention that the quantitative-qualitative distinction is am-biguous on two fronts, the measurement and the ontological (cf. Howe 1988). In the former instance, data are qualitative if they fit a categorical measurement scale, and are quantitative if they fit an ordinal, interval or ratio scale. In the latter instance, data are qualitative if they incorporate values, beliefs, and intentions—in other words, if they are ‘intentionalist’. Conversely, the data are quantitative if they are ‘non-intentionalist’.
Quantitative history: background
The use of quantitative techniques in historical studies is not entirely new. The Annales School in France is noted for its efforts to promote such studies during the pre-World War I era. Prior to that, in 1893, an American, Frederick Jackson Turner, had underta-ken a rigorous analysis of the U.S. population census of 1890 under the caption, ‘The Significance of the Frontier in American History.” However, the application of modern techniques of quantitative data analysis only emerged subsequent to the growth of so-cial and statistical sciences in the first half of the twentieth century. In fact, most of the development in this regard occurred in the 1950s when the capacity for computer-aided tabulation and numerical record keeping and data analysis were diffused to institutions of higher learning. Earlier on in the 19th century, historical analysts such as Leopold von Ranke (1795-1886) had implored historians to adopt meticulous strategies that can guarantee some level of objectivity in their work (Iggers & Powell 1990). However, I would be remiss if I failed to mention von Ranke’s insistence on the need for historians to present their findings in a manner accessible and decipherable by the lay audience. The high-point of this development dates back to the 1960s with the advent of main-frame computers. Thus, the decade of the 1950s is often taken to mark the emergence of quantitative history—that is, the application of quantitative skills and commensurate techniques to the study of historical phenomena. It became popular in the 1960s as a function of incessant calls for the development of a ‘social sciences. Particularly no-teworthy in this regard were the calls from economic and political historians to make historicism more ‘scientific’.
The need for quantitative analysis in colonial research
The need to be informed consumers of the information is perhaps the most compelling case for combatting the mathematical deficiency prevalent among students of history.
Hudson (2000) makes this point more succinctly when he advanced the following ar-gument. To meaningfully study society from both historical and contemporary perspec-tives requires, at a minimum, taking charge of quantitative data.
To command it rather than be the slave of a seeming authority of numbers emerging from documents or the writings of a small body of numerically inclined researchers (Hudson, 2000: xxvii).
Another compelling case for advocating quantitative analysis in colonial research is the need to make such analysis ‘more scientific’. Here, it is necessary to note that his-torical research predated scientific research, and that “historians have always counted things” (Humphreys 1997: 318). This means that quantitative historiography is not new. In fact, the use of quantitative techniques has been ongoing for some time in historical demography, human health and disease history, economic history and political history. While quantitative and qualitative historiography are fundamentally different from an epistemological perspective, they are complementary frameworks for conceptualizing the nature of historical reality. Consider the case of efforts to understand electoral be- haviour. Here, the need for both quantitative and qualitative research cannot be oversta-ted. While quantitative analysis can help aggregate voters by their demographic, eco-nomic and other characteristics, qualitative research is necessary to promote under- standing of the contextual effects that do not lend themselves to quantification (Dun-leavy 1990; Kavangh 1991; Devine 1994). The most notable strength of quantitative tech-niques resides in their tendency to be rational, logical, planned and systematic – all qualities that are expected to lead to more credible research results. To the extent that this is true, I advance the following as the six leading reasons for promoting their incor-poration in colonial and post-colonial research.
Objectivity, believability, and trustworthiness. The all-too-familiar dictum that ‘num-bers speak for themselves’ is not without merit. The judicious use of num‘num-bers and com-mensurate analytical techniques in any study bolsters its trustworthiness and portrays the researcher as dispassionate and objective. In the interest of fairness, it is necessary to draw attention to some criticisms that have been leveled against quantitative historicism. Works employing quantitative techniques are often criticized for inflating and oversimp-lifying their findings (Humphreys 1997). However, these criticisms are patently unfair when directed at quantitative historicism in general as opposed to the improper applica-tion of quantitative techniques.
Efficiency and effectiveness. Advances in computer-aided analysis make it possible for more to be done with less. In this connection, data on a historical phenomenon of interest over several years can be analyzed simultaneously. In fact, modern software and other tools for quantitative data analysis have facilitated the research process. This has resulted in the significant reduction of the time lag between data gathering and the release of research results.
Hypothesis testing, hence, linking colonial and post-colonial studies. Quantitative methodology and commensurate techniques are ideally suitable for testing logical
hy-potheses. This is what the eminent Austrian/British philosopher, Karl Popper (1902– 1994) notably branded the test of falsifiability. This test ensures the rejection of all alternative explanations of any given phenomenon in favour of only the most plausible one. For instance, hypothesis-testing can help us identify which factors in a country’s colonial history account for its contemporary development status. To the extent that a study succeeds in doing this, it achieves the important goal of explaining a country’s current development profile as a function of its colonial experience.
Serving as a self-correcting system of ‘checks and balances’. Quantitative research lends itself to verification and falsificationism as mentioned earlier. The critical theorist, C. Wright Mills (1959) drew attention to this when he emphasized in The Sociological Imagination the need to conduct multiple empirical studies on any given phenomenon. The consistency of such studies is more easily assured with the use of quantitative data and concomitant techniques than otherwise.
Positioning historical studies to benefit from the real and potential benefits of mo-dern technology. The adoption of quantitative data and related analytical techniques in historical studies affords the researcher the opportunity to gainfully utilize computer-generated, stored and retrieved data as well as modern information systems such as the Geographic Information System (GIS). Additionally, there is a wealth of historical data such as census figures and demographic information on births, deaths, marriages, commerce and trade that historians can electronically analyze to understand past social, political and economic trends.
Barriers to quantitative historical research
I would be remiss if I concluded this presentation without acknowledging some of the problems inherent in conducting quantitative historical research. I hasten to note five of the most nagging of these problems as follows:
1. The need for proficiency in quantitative analysis. Quantitative analytical ability, a skill set not typically required of historians, is necessary to conduct research in quantitative history. Certainly, the need for quantitative skills for historians has been recognized. Commensurate with this has been a gradual growth in works de-dicated to arming history students with such skills (see e.g., Hudson 2000). How-ever, the use of quantitative techniques is a considerable distance away from be-coming commonplace in historiographical studies.
2. Lack of electronic historical data. Most historical data are in text form. Conse-quently, researchers interested in employing quantitative analysis in historical studies have the unenviable task of converting such text-based data into matrix format. This task can be cumbersome and invariably time-consuming. Yet, the be-nefits of undertaking quantitative historical research are worth the sacrifice.
3. Depleted quality of data. Significant amounts of quantitative historical data tend to be stored on media that are inaccessible and unanalyzable by modern computer
software. One example includes the punch cards on which US Census Bureau data were stored from 1890 t0 1960 (Anderson 2007).
4. Data rigidity. This refers to the inflexible nature of data on historical phenomena. This is a larger evidentiary issue that historians are invariably confronted with as they must rely on records of events from the past.
5. Uncertain universe. The nature of historical data, which by definition comprise information or evidence from the past, makes it difficult to ascertain the size of the population of interest. For instance, a building register of a certain town for a specific year in history is not necessarily a veritable record of all buildings in that town for that year. This is because some of the buildings in that town for the year in question might have been destroyed just as the register was being prepared.
Quantitative colonial research in practice
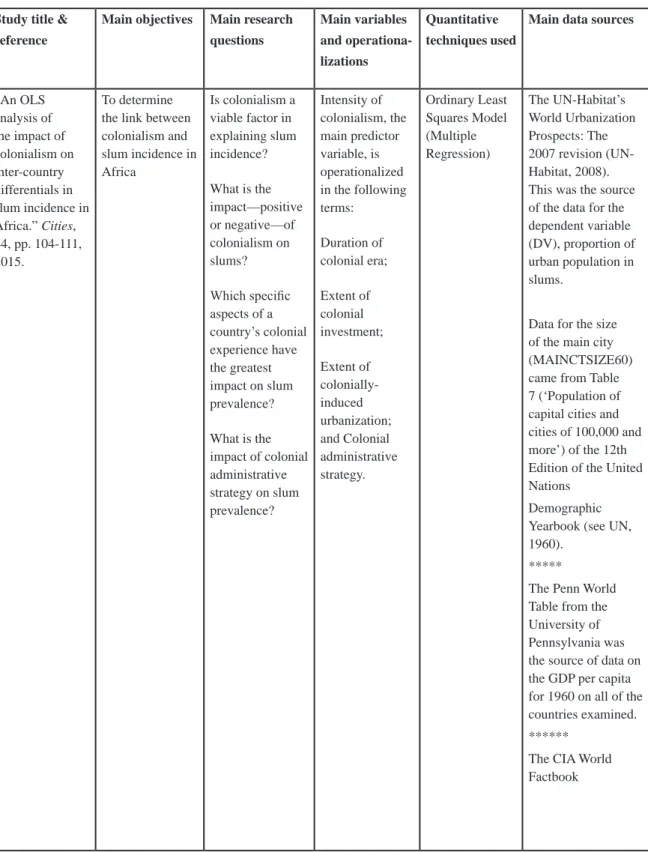
To illustrate the use of quantitative analytical tools in colonial and post-colonial re-search, I briefly discuss two of my own recently published works on the subject. The first of these was published in the journal, Cities, under the caption, “An OLS analysis of the impact of colonialism on inter-country differentials in slum incidence in Africa.” (Cities, 44, pp. 104-111, 2015). As its title suggests, it is a classic example of studies linking colonial to post-colonial phenomena. The second study, under the title, “Colo-nization and sanitation in urban Africa: A logistics analysis of the availability of central sewerage systems as a function of colonialism,” appears in Habitat International (38, pp. 207-213, 2013). Table 1 – see next spread – summarizes major tenets of both works.
Concluding remarks
Quantitative techniques are gaining increasing popularity as tools for conducting histo-rical research. However, researchers in colonial and post-colonial studies are yet to take advantage of the versatility of these tools. Yet, as I have shown in this presentation, the tools and commensurate analytical techniques show enormous promise for such studies. It is my fervent hope that more colonial and post-colonial researchers will consider em-ploying these techniques in their work. As a final word, permit me to strongly make the following recommendation. Historians who may be mathematically deficient or simply have an aversion for numerical work should consider teaming up and working with quantitatively-oriented researchers in history or allied fields. Proceeding in this direc-tion promises yield many positive returns that can only be possible through interdisci-plinary collaboration.
Table 1: Sample empirical research in quantitative history
Study title & reference
Main objectives Main research questions Main variables and operationa-lizations Quantitative techniques used
Main data sources
“An OLS analysis of the impact of colonialism on inter-country differentials in slum incidence in Africa.” Cities, 44, pp. 104-111, 2015. To determine the link between colonialism and slum incidence in Africa Is colonialism a viable factor in explaining slum incidence? What is the impact—positive or negative—of colonialism on slums? Which specific aspects of a country’s colonial experience have the greatest impact on slum prevalence? What is the impact of colonial administrative strategy on slum prevalence? Intensity of colonialism, the main predictor variable, is operationalized in the following terms: Duration of colonial era; Extent of colonial investment; Extent of colonially-induced urbanization; and Colonial administrative strategy. Ordinary Least Squares Model (Multiple Regression) The UN-Habitat’s World Urbanization Prospects: The 2007 revision (UN-Habitat, 2008). This was the source of the data for the dependent variable (DV), proportion of urban population in slums.
Data for the size of the main city (MAINCTSIZE60) came from Table 7 (‘Population of capital cities and cities of 100,000 and more’) of the 12th Edition of the United Nations
Demographic Yearbook (see UN, 1960).
*****
The Penn World Table from the University of Pennsylvania was the source of data on the GDP per capita for 1960 on all of the countries examined. ******
The CIA World Factbook
Table 1 (Cont’d)
Study title & reference
Main objectives Main research questions Main variables and operationali-zations Quantitative techniques used Main data sources “Colonization and sanitation in urban Africa: A logistics analysis of the availability of central sewerage systems as a function of colonialism.” Habitat International (38, pp. 207-213, 2013) To identify the factors explaining colonial government decisions to develop central sewerage systems in urban Africa.
Why did colonial govern-ments develop central sewage systems in some colonial towns but not others? ***** What factors influenced sanitation decision in the colonies? The DV is CENSWG (central sewerage system). It is a dichotomous variable, which took on the value ‘1’ if a city was equipped with a central sewerage system in 1960, and ‘0’ if not. ******
The IVs included: 1) the number of years that a country spent as a European colony (YRSCOL); 2) the government share of real GDP per capita in 1960 (GDP60); and 3) the nationality of the colonial power (COLID). All but COLID are continuous variables. COLID is a dummy variable, which assumed the value ‘1’ if the colonial power was Britain, and ‘0’ otherwise. Logistics regression and commensurate statistics. 3 main sources, including the following: 1) the Penn World Tables; 2) the US Central Intelligence Agency (CIA) World Factbook; and 3) the World Health Organization (WHO)/ the United Nations Children’s Fund (UNICEF), Joint Measurement Programme (JMP).
References
Anderson, M. (2007), “Quantitative History.” Pp. 246 -63 In Outhwaite,W. & Turner, S. (eds.). The Sage Handbook of Social Science Methodology. London: Sage Publica-tions.
Devine, F. (1994), Learning More about Mass Political Behaviour; Beyond Dunleavy, in D. Broughton, D. Farrell, D. Denver, and C. Rallings, (eds). British Elections and Parties Yearbook 1994, London: Frank Cass, pp. 215-228.
Dunleavey, P. (1990), Mass Political Behaviour: Is There More to Learn? Political Stu-dies XXXV111: 453-469.
Fox, S. (2013), The political economy of slums: Theory and evidence from Sub-Saharan Africa. Working article series no. 13-146. London School of Economics and Political Science.
History Matters (Online). What is quantitative history? Accessed on December 21, 2015 at: http://historymatters.gmu.edu/mse/numbers/what.html
Howe, K. R. (1988), Against the quantitative-qualitative incompatibility thesis or dogmas die hard. Educational Researcher (November), 10-16.
Hudson, P. (2000), History by Numbers : An Introduction to Quantitative Approaches. London: Arnold.
Humphreys, J.T. (1997), Review of: Quantitative methods for historians: A guide to re-search, data, and statistics by Konrad H. Jarausch & Kenneth A. Hardy. The Bulletin of Historical Research in Music Education, 18(2): 140-148.
Iggers, G.G. & Powell, J.M. (1990), Leopold von Ranke and the shaping of the historical discipline. Syracus, NY: Syracuse Univ. Press.
Kavanagh, D. (1991), “Why Political Science Needs History.” Political Studies, 479-495. Mills, C.W. (1959), The sociological imagination. Oxford, UK: Oxford University Press.