ALCOHOL- AND DRUG-RELATED FATAL ACCIDENTS IN SWEDEN:
WHERE DO THEY OCCUR?
Susanne Gustafsson
Swedish National Road and Transport Research Institute, VTI SE-581 95 LINKÖPING Sweden
Telephone: +46 (0) 13 204132 E-mail: susanne.gustafsson@vti.se
Åsa Forsman
Swedish National Road and Transport Research Institute, VTI SE-581 95 LINKÖPING Sweden
Telephone: +46 (0) 13 204279 E-mail: asa.forsman@vti.se
ABSTRACT
This conference paper presents an accident study investigating where fatal alcohol- and drug-related accidents occur with respect to traffic environment (i.e., urban versus rural), road type, speed limit, annual average daily traffic flow, and road category. The study uses data from in-depth studies of fatal accidents and from the Swedish National Road Database. Accident data from the 2006–2009 period are used.
The results indicate that the proportion of all fatal accidents that are alcohol-related is about the same on urban (21%) and rural roads (23%). However, the proportion of alcohol-related fatal accidents is higher on ordinary roads (i.e., two-lane single carriageways with no central reservation or median barrier; 23%) than on other types of rural state roads (11%). On ordinary roads, alcohol-related fatal accidents are more common on roads with speed limits of 60–70 km/h (35%) than on roads with speed limits of 80–100 km/h (14%) and more common on second- and third-class county roads (32%) than on roads in other categories (less than 20%). The alcohol-related accident risk follows the same pattern, i.e., the accident risk is highest where the proportion of alcohol-related accidents is highest.
It was also found that the distribution of drug-related fatal accidents among various parts of the road network is more similar to the distribution of fatal accidents involving sober drivers than to alcohol-related fatal accidents. The present results can be used by the police in strategic planning of the surveillance.
1 INTRODUCTION
Driving while under the influence of alcohol or drugs is a problem of great concern in Sweden and many other countries. The legal limit for alcohol in Swedish drivers is a blood alcohol concentration (BAC) of 0.2 g/L whereas there is zero tolerance for drugs (except for medicinal drugs by doctor’s prescription). Previous research finds generally good compliance with the legal limit, but the strongly elevated accident risk of intoxicated drivers still makes driving under the influence of alcohol or drugs a serious problem.
An observational study in three counties in Sweden found that approximately 0.24% of the traffic volume comprised vehicles driven by people with blood alcohol over the legal limit (Forsman et al., 2007). The prevalence of driving under the influence of drugs has also been estimated, and Forsman et al. (2011) found that approximately 0.4% of tested drivers were positive for one or more illegal drugs. However, this was a fairly small study and the prevalence of driving under the influence of drugs in Sweden is still largely unknown. In a study of motor vehicle drivers who died in traffic accidents from 2003 to 2007, blood alcohol over the legal limit was identified in approximately 22% of cases, while the corresponding proportion for drugs was approximately 7% (Jones et al., 2009).
The incidence of drunk driving seems to have declined recently. Estimates based on breathalyser tests conducted by police indicate a small decline in recent years, and the proportion of car drivers killed in traffic accidents with a BAC over 0.2 g/L has been decreasing since 2003 (Berg et al., 2012).
To reduce the number of alcohol-related traffic accidents, Sweden permits comprehensive police surveillance of drivers. Random breath testing is allowed and the police conduct approximately 2.5 million breath tests per year. Each police officer is equipped with a breathalyser, and normally every police-initiated meeting with a driver includes an alcohol breath test. The surveillance of drug-intoxicated drivers is still developing and is more complicated due to the lack of screening instruments. In addition, random testing for drugs is not allowed.
Interviews with people that have been driving under the influence of alcohol and drugs in Sweden indicate that the perceived risk of being apprehended by the police is very small (Forward et al., 2007; Forward, 2010). Some differences can, however, be seen between drunk and drug drivers. Drug drivers are in general less worried about getting caught than drunk drivers are. Some of the drunk drivers did also develop strategies to reduce the risk of detection such as keeping to specific areas.
Since the police have an important role in combating drunk- and drug-intoxicated driving, understanding the characteristics of alcohol- and drug-related accidents is important in order to implement effective enforcement. This paper examines where the accidents occur.
Several previous studies have compared the occurrence of alcohol-related accidents in urban and rural areas. For example, Borgialli et al. (2000) found that alcohol was involved in 4.4% of the motor vehicle crashes in rural counties and in 3.5% of the crashes in non-rural counties in Michigan. The difference is statistically significant, although it is fairly small. Subramanian (2003) studied drivers involved in fatal crashes in the United States and found that alcohol involvement was marginally more likely among drivers in crashes in rural areas than in urban areas. No studies are found that compare accident occurrence and risk on different road types within rural or urban areas.
The aim of this study was to investigate where fatal alcohol- and drug-related accidents occur with respect to traffic environment (i.e., urban versus rural), road type, speed limit, annual average daily traffic flow (AADT), and road category.
2 MATERIALS AND METHODS
This paper is based on in-depth studies of fatal accidents from 2006 to 2009. In-depth studies are carried out by the Swedish Transport Administration to obtain as complete a picture as possible of the course of events before, during, and after accidents. Police records, the results of post mortem examinations, and inspections of the accident sites and involved vehicles
comprise the basis of these in-depth studies. All people killed in road traffic accidents in Sweden should undergo post mortem examination, though in practice, approximately 90% are examined. These examinations are carried out at the National Board of Forensic Medicine and, if possible, samples of blood, urine, and sometimes other material are collected and sent to the Department of Forensic Toxicology, which performs a toxicological analysis. The results of toxicological analyses are used to determine possible alcohol or drug use.
To obtain data about the road network, data from the Swedish National Road Database (NVDB) are used. A database withdrawal from 31 July 2008 is used and provides information about, for example, type of road, road owner, and traffic flow.
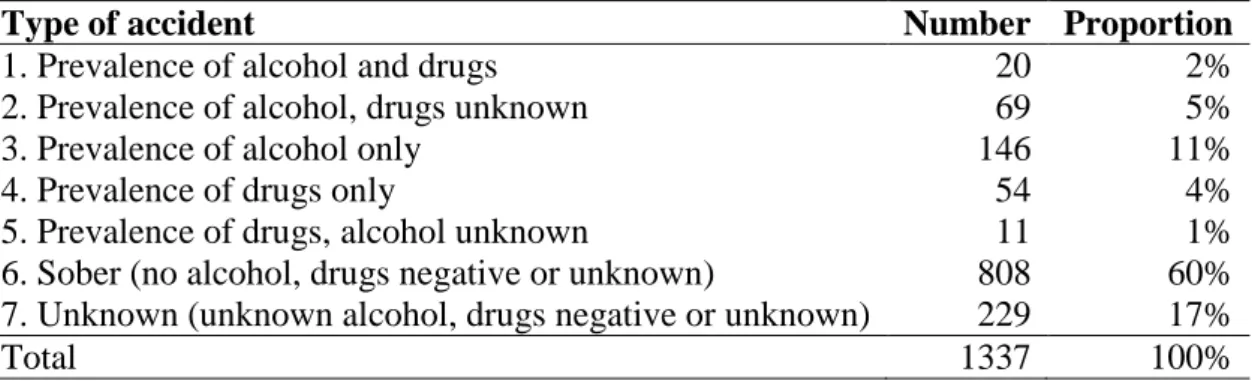
From 2006 to 2009, 1337 fatal road traffic accidents occurred involving at least one motor vehicle. Table 1 presents the prevalence of alcohol and drugs in these accidents. As can be seen, 60% of the accidents are defined as sober accidents. The alcohol- and drug-related accidents are defined as accidents in which alcohol or drugs have been detected in at least one involved motor vehicle driver. A total of 18% of the accidents were alcohol related and 7% were drug related (including 2% that were both alcohol and drug related). In 17% of cases, the prevalence of alcohol and drugs is unknown.
Table 1: Number and proportion of fatal motor vehicle accidents, 2006–2009.
Type of accident Number Proportion
1. Prevalence of alcohol and drugs 20 2%
2. Prevalence of alcohol, drugs unknown 69 5%
3. Prevalence of alcohol only 146 11%
4. Prevalence of drugs only 54 4%
5. Prevalence of drugs, alcohol unknown 11 1%
6. Sober (no alcohol, drugs negative or unknown) 808 60% 7. Unknown (unknown alcohol, drugs negative or unknown) 229 17%
Total 1337 100%
Because of the greater number of alcohol-related accidents, these could be studied in more detail than could the drug-related accidents. To describe the occurrence of alcohol-related accidents in different parts of the road network, three measures are used: the proportion of accidents that are alcohol related, the number of alcohol-related accidents per year, and alcohol-related accident risk. The proportion of accidents that are alcohol related was calculated as the ratio between alcohol-related accidents (types 2 and 3 in Table 1) and alcohol-related plus sober accidents (types 2, 3, and 6 in Table 1). A Fisher’s test is used to test for differences in distribution between alcohol-related accidents and accidents involving sober drivers. The accident risk is calculated as the number of accidents divided by total vehicle mileage. The confidence intervals of the accident risk are based on the assumption that the number of accidents follows a Poisson distribution. The lower and upper limits of the number of accidents are calculated as the exact limits given a Poisson distribution, and are then divided by total vehicle mileage, which is considered a fixed number.
For the above analysis of the occurrence of alcohol-related accidents, the road network is divided in several ways. First, urban and rural roads are compared. The rural roads are then analysed in more detail, the analysis being limited to state roads because of access to more
complete information about, for example, traffic flow. The rural roads are divided into ordinary roads, which we define as two-lane roads with no central reservation or median barrier, and other roads, which include motorways and three-lane roads with alternating passing lanes. The occurrence of alcohol-related accidents is compared between ordinary roads and other roads. Finally, accidents on ordinary roads, which comprise most accidents on rural state roads, are analysed with respect to speed limit, AADT, and road category (i.e., European highways, trunk roads, primary county roads, and second- and third-class county roads).
The analyses described so far examine the occurrence of alcohol-related accidents only with respect to specific parts of the road network. However, other circumstances may also differ between alcohol-related and sober accidents. A logistic regression was used to determine how the relationship between the proportion of accidents that are alcohol related and location is affected when other variables are included in the analysis. The response variable is binary and describes whether or not the accident is alcohol related. The explanatory variables are one of the location variables described above and the following variables:
• Time of day (i.e., morning 0700–1200, afternoon 1200–2200, night 2200–0700) • Weekday/weekend (weekend is defined as the period from noon Friday to noon
Monday)
• Type of accident (i.e., collision between motor vehicles and pedestrians or cyclists, collision between motor vehicles, single-vehicle accidents, and other accidents) • Age of youngest driver (i.e., <25 years, 25–34 years, 35–64 years, >64 years) • Sex of youngest driver (i.e., male/female)
Stepwise logistic regression was used, which means that one variable at a time was included and in every step a test was conducted to determine whether any of the previously entered variables should be excluded. The location variable that is analysed is forced into the model if it is not included by the stepwise procedure.
Finally, we compare the distribution of alcohol-related, drug-related, and sober fatal accidents among various parts of the road network.
3 RESULTS
The results are divided into two parts: the occurrence of alcohol-related fatal accidents and a comparison between alcohol- and drug-related fatal accidents.
3.1 Alcohol-related fatal accidents
The basis of the results presented in this section is 235 alcohol-related fatal accidents and 808 sober fatal accidents. Drug-related accidents are excluded from this analysis.
3.1.1 Traffic environment
The results indicate that, when the whole road network is considered, 23% of the investigated fatal accidents are alcohol related (see Table 2). Moreover, the estimated proportion of alcohol-related fatal accidents is about the same on urban (21%) and rural roads (23%). A Fisher’s test indicated no significant difference between the two road types (P = 0.428).
The number of alcohol-related fatal accidents per year from 2006 to 2009 was highest on rural roads. The reason for this result is the higher volume of traffic on rural roads, while the accident risk is of the same magnitude on urban and rural roads.
No significant differences depending on road class or road owner were found when alcohol-related accidents were examined in more detail on urban roads.
Table 2: Total number of accidents, proportion of accidents that are alcohol related, alcohol-related accidents per year, and accident risk, 2006–2009 (approximate 95% confidence intervals). Traffic environment Total number of accidents Alcohol-related accidents Alcohol-related accidents year–1 Alcohol-related accident risk (CI)
Urban 335 21% 17.5 1.2 (0.9–1.5)
Rural 708 23% 41.3 0.9 (0.8–1.1)
Total 1043 23% 58.8 1.0 (0.9–1.1)
3.1.2 Road type on rural state roads
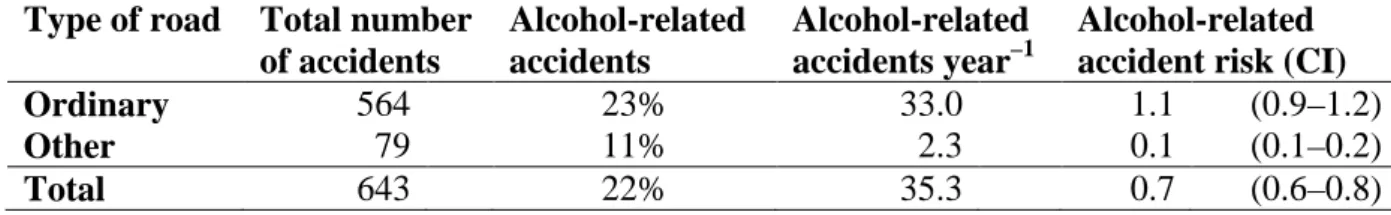
The analysis of road type on rural state roads is based on 643 fatal accidents. The road types are divided into two groups: ordinary roads and other roads. Ordinary roads are two-lane roads with no central reservation or median barrier. Other roads include motorways and three-lane roads with alternating passing three-lanes. The proportion of accidents that are alcohol related is higher on ordinary roads (23%) than on roads of other types (11%) (P = 0.014, Fisher’s test; see Table 3). Moreover, both the number of accidents and alcohol-related accident risk are much higher on ordinary roads.
Since most alcohol-related accidents occur on ordinary roads, the rest of the analysis will focus on this type of road.
Table 3: Total number of accidents, proportion of accidents that are alcohol related, alcohol-related accidents per year, and accident risk, 2006–2009 (approximate 95% confidence intervals).
Type of road Total number of accidents Alcohol-related accidents Alcohol-related accidents year–1 Alcohol-related accident risk (CI)
Ordinary 564 23% 33.0 1.1 (0.9–1.2)
Other 79 11% 2.3 0.1 (0.1–0.2)
Total 643 22% 35.3 0.7 (0.6–0.8)
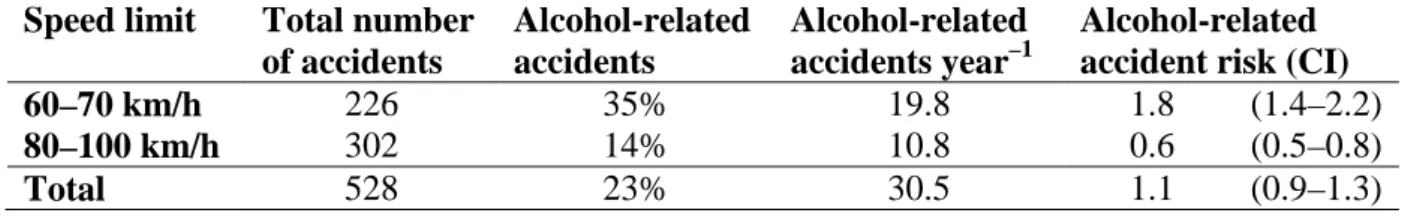
3.1.2 Speed limit on ordinary rural state roads
The vast majority of accidents on ordinary rural state roads occur on roads with speed limits of 60–70 km/h or 80–100 km/h, roads with higher and lower speed limits are therefore excluded from the analysis.
The results indicate a significant difference in the proportion of accidents that are alcohol related between roads with speed limits of 60–70 km/h (35%) and roads with speed limits of 80–100 km/h (14%) (P < 0.001, Fisher’s test; see Table 4).
The number of alcohol-related accidents per year was higher on roads with speed limits of 60–70 km/h (approximately 20) than on roads with speed limits of 80–100 km/h (approximately 11). The same was found regarding the accident risk, which is much higher on roads with speed limits of 60–70 km/h (1.8) than on roads with speed limits of 80–100 km/h (0.6).
Table 4: Total number of accidents, proportion of accidents that are alcohol related, alcohol-related accidents per year, and accident risk, 2006–2009 (approximate 95% confidence intervals).
Speed limit Total number of accidents Alcohol-related accidents Alcohol-related accidents year–1 Alcohol-related accident risk (CI)
60–70 km/h 226 35% 19.8 1.8 (1.4–2.2)
80–100 km/h 302 14% 10.8 0.6 (0.5–0.8)
Total 528 23% 30.5 1.1 (0.9–1.3)
3.1.3 Traffic flow on ordinary rural state roads
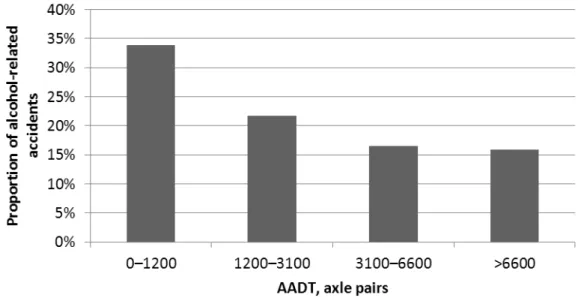
Alcohol-related fatal accidents on ordinary rural state roads were further analysed with respect to AADT. A total of 561 fatal accidents were included in the analysis. The ordinary roads were divided into four classes with different AADTs, and the proportion of accidents that are alcohol related was found to be highest on roads with the lowest traffic flow (0–1200 axle pairs; see Figure 1). A Fisher’s test indicated a significant difference between the class with lowest traffic flow and each of the other classes (P = 0.016, P < 0.001, and P = 0.002).
Figure 1: Proportion of accidents that are alcohol related, 2006–2009, on roads with different annual average daily traffic flows (AADT); the total numbers of accidents are 183, 157, 133, and 88, respectively.
The average number of alcohol-related accidents per year is 15.5 when the AADT is 0– 1200 axle pairs. For the rest of the AADT classes, in ascending order, the average number of alcohol-related accidents is 8.5, 5.5, and 3.5.
The risk of a fatal accident is also highest on roads with an AADT under 1200 axle pairs (see Figure 2).
Figure 2: Accident risk, i.e., the number of alcohol-related accidents per vehicle kilometres (billion axle pair kilometres), 2006–2009.
3.1.4 Road category on ordinary rural state roads
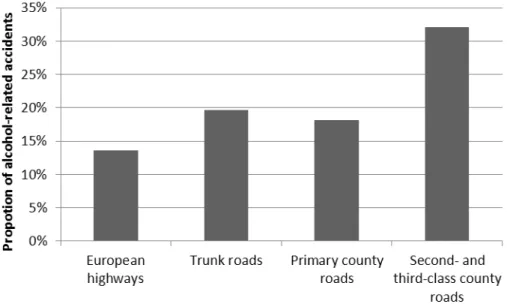
A total of 564 alcohol-related fatal accidents were included in the analysis with respect to different road categories. The results indicate that the proportion of accidents that are alcohol related was highest on second- and third-class county roads (see Figure 3). Nearly a third of the accidents on these types of road were alcohol related. A Fisher’s test indicated a significant difference between the European highways and the second- and third-class county roads (P < 0.001), as well as between trunk roads and second- and third-class county roads (P = 0.016) and between primary county roads and second- and third-class county roads (P = 0.009).
Figure 3: Proportion of accidents that are alcohol related, 2006–2009, on four categories of ordinary rural state roads; the total numbers of accidents are 103, 117, 110, and 234, respectively.
The average number of alcohol-related accidents per year is 18.8 on the second- and third-class county roads. For the rest of the road categories, the average number of alcohol-related accidents is 3.5 on European highways, 5.8 on trunk roads, and 5.0 on primary county roads.
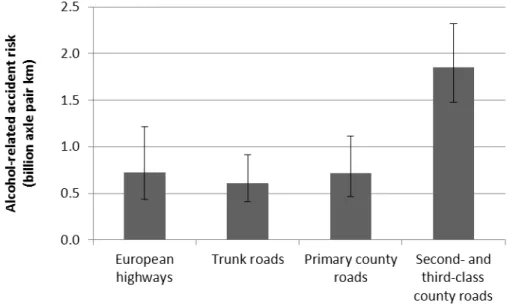
The risk of a fatal accident is highest on second- and third-class county roads (see Figure 4).
Figure 4: Accident risk, i.e., the number of alcohol-related accidents per vehicle kilometre (billion axle pair kilometres), 2006–2009.
3.1.5 Logistic regressions
The above results are based on the analysis of one variable at a time, and other variables that also could affect the probability of an alcohol-related accident are not considered. To analyse whether different traffic environments or different road types are affected if other variables are studied simultaneously, logistic regression was used. For example, the results of a stepwise logistic regression including the variable road type are shown in Table 5. The dependent variable describes whether or not the accident is alcohol related. It can be seen that the probability of an alcohol-related fatal accident was affected by the time of day, whether the accident occurred on a weekday or on the weekend, and type of accident. However, the effect of road type, which was seen in section 3.1.2, still remains when the other variables are considered.
In addition to the variables shown in Table 5, the age and sex of the youngest driver were initially included as possible candidates, but did not meet the criteria for inclusion in the model using the stepwise procedure.
Table 5: Logistic regression results, likelihood ratio test.
Degrees of freedom χ 2 statistic P-value Road type 1 8.48 0.004 Time of day 2 28.20 <0.001 Weekday or weekend 1 11.04 <0.001 Type of accident 3 50.17 <0.001
Regarding traffic environment, speed limit, and road category, the logistic regression results did not change the conclusion from the previous analyses. That is, the results for these variables remained even after other variables were considered.
The probability of alcohol-related fatal accidents with respect to AADT class was not statistically significant in the regression analysis (P = 0.104). Further analysis indicated that the results for AADT class were mostly affected by the fact that different types of accidents are dominant on roads with different traffic flows.
1.1 Alcohol- and drug-related fatal accidents
So far, only alcohol-related accidents have been analysed. A number of drug-related fatal accidents were also included in the dataset, although these were fewer than the alcohol-related fatal accidents. Here, we compare alcohol-related, drug-related, and sober accidents; accidents that are both alcohol and drug related are excluded from the analysis.
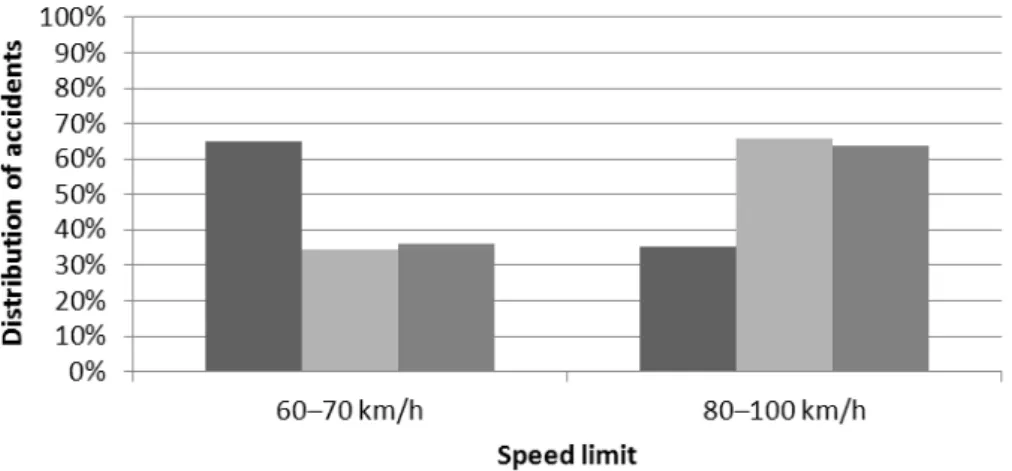
Figure 5 shows the distribution of fatal accidents on ordinary rural state roads with different speed limits. Very few fatal accidents occurred on roads with speed limits of 30–50 km/h and 110–120 km/h, so these are not included in the analysis. Alcohol-related accidents are more frequent on roads with speed limits of 60–70 km/h (65%) than on roads with speed limits of 80–100 km/h (35%). In contrast, drug-related accidents and accidents involving sober drivers are more common on roads with speed limits of 80–100 km/h (approximately 65%) than on roads with speed limits of 60–70 km/h (approximately 35%).
Figure 5: Distribution of fatal accidents on ordinary rural state roads with different speed limits, 2006–2009. These accidents are divided into alcohol-related accidents (n = 114), drug-related accidents (n = 32), and accidents involving sober drivers (n = 406).
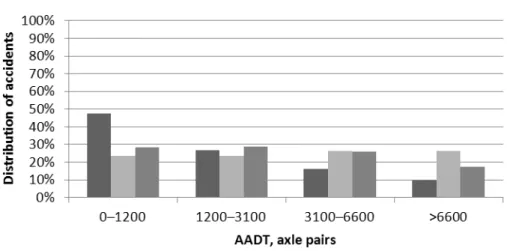
Figure 6 shows the distribution of fatal accidents on ordinary rural state roads of different AADT classes. Drug-related accidents occur to the same extent irrespective of the AADT class. This is in contrast to alcohol-related accidents, where the proportion decreases with greater traffic flow.
Figure 6: Distribution of fatal accidents on ordinary rural state roads with four categories of annual average daily traffic flow (AADT; in axle pairs), 2006–2009. These accidents are divided into alcohol-related accidents (n = 124), drug-related accidents (n = 34), and accidents involving sober drivers (n = 429).
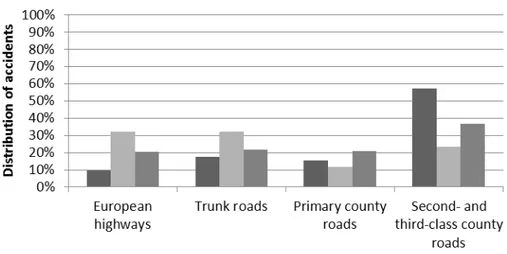
The distribution of fatal accidents among the four categories of ordinary rural state roads is shown in Figure 7. Drug-related accidents occur to more or less the same extent on all categories of roads, though to a lesser extent on primary county roads. This is in contrast to alcohol-related accidents, which, as noted previously, are most common on the second- and third-class county roads.
Figure 7: Distribution of fatal accidents among four categories of ordinary rural state roads, 2006–2009. The accidents are divided into alcohol-related accidents (n = 124), drug-related accidents (n = 34), and accidents involving sober drivers (n = 432).
Results for the variables traffic environment and road type are not presented here, but can be found in Gustafsson and Forsman (2012). In summary, the results of the comparisons indicate that the distribution of drug-related fatal accidents among various parts of the road network is more similar to the distribution of accidents involving sober drivers than to the distribution of alcohol-related accidents.
4 DISCUSSION
The results indicate that the proportion of alcohol-related fatal accidents on rural state roads is higher on ordinary roads (i.e., two-lane roads with no central reservation or median barrier) than on other types (i.e., motorways and three-lane roads with alternating passing lanes). Moreover, the proportion of alcohol-related accidents on ordinary roads is higher on roads with speed limits of 60-70 km/h than on roads with speed limits of 80-100 km/h, higher on low-traffic roads with AADT less than 1200 axle pairs, and higher on second- and third-class county roads than on other road categories. The alcohol-related accident risk follows the same pattern, i.e., the accident risk is highest where the proportion of alcohol-related accidents is highest. These outcomes of the study may not be unexpected but it has not been investigated previously in Sweden.
No statistically significant difference of the proportion of alcohol-related fatal accidents is found when rural and urban roads are compared. This is in line with results from previous studies that show only marginal differences between rural and urban areas (Borgialli et al., 2000; Subramanian, 2003).
This study thus indicates that the risk of being involved in an alcohol-related fatal accident on the rural road network is higher on fairly small roads. What we do not know is whether
risk of being involved in accidents. It may be that drunk drivers choose to drive on these roads in order to avoid the police. Another explanation is that these roads often are narrow and curvy which can make them more difficult to manage in a drunk condition. Both explanations of the cause of higher alcohol-related accident risk are plausible and there may well be a combination of the two. However, regardless of the cause of the accidents, it is important for the police to implement driver surveillance on these smaller roads.
We have also studied whether the various road classes in themself are related to the proportion of alcohol-related accidents or if the relationship may be confounded by other variables. For example, if a specific road type has more night-time traffic than other types of roads this will lead to a higher proportion of alcohol-related accidents since the accident risk for drunk drivers are higher at night. A logistic regression was used to account for additional variables that may influence the proportion of alcohol-related accidents (i.e., time of day, time of week, type of accident, sex and age of youngest driver). The results indicated that road type, speed-limit class, and road category were statistically significant also when other variables were included in the model. In contrast, the test associated with AADT-class was not statistically significant. However, the results from a single test should be carefully interpreted, due to the large number of analyses and tests. The overall impression is that the results change little when other variables than the location variable are included in the model. However, there might be other variables that are unknown to us, which may influence the results.
The comparison between alcohol- and drug-related accidents indicates that the distribution of drug-related fatal accidents among various parts of the road network is more similar to the distribution of fatal accidents involving sober drivers than to alcohol-related fatal accidents. Interviews with drivers that had driven under the influence of drugs indicated that they were not concerned of the risk of getting apprehended for drug driving (Forward, 2010). Thus, they may not choose specific roads in order to avoid police controls. Moreover, some drugs can be detected several days after the intake and the driver may not be aware that he or she still has traces of drugs in the blood.
When planning police surveillance, other aspects than accident risk needs to be considered in order to use police resources effectively. Examples of such aspects are accident density (accidents per road length) and the possibility of coordinating drunk and drug driving surveillance with other traffic controls.
REFERENCES
Berg, Y., Forsman, Å., Ifver, J., Larsson, P., Lindholm, M., Melkersson, M., Strandroth, J. & Vadeby, A. (2012). Analysis of Road Safety Trends 2011, Management by Objectives for
Road Safety Work, Towards the 2020 Interim targets. Publication 2012:150. The Swedish
Transport Administration, Borlänge, Sweden.
Borgialli, D. A., Hill, E., Maio, R. F., Compton, C. P. & Gregor, M. A. (2000). Effects of alcohol on the geographic variation of driver fatalities in motor vehicle crashes. Academic
Emergency Medicine, Vol. 7(1), pp. 7-13.
Forsman, Å., Gustafsson, S. & Varedian, M. (2007). The prevalence of drink driving: a
methodological study in three Swedish counties. VTI rapport 599 (in Swedish with English
Forsman, Å., Kronstrand, R., Ceder, G., Renner, L. & Hjälmdahl, M. Country Report Sweden. In: Houwing, S., Hagenzieker, M., Mathijssen, R., Bernhoft, I. M., Hels, T., Janstrup, K., Van der Linden, T., Legrand, S.A. & Verstraete, A. (2011). Prevalence of
alcohol and other psychoactive substances in drivers in general traffic. Part II: Country reports. [Electronic] DRUID Deliverable 2.2.3. Project No.
TREN-05-FP6TR-S07.61320-518404-DRUID. Available: http://www.druid-project.eu /Deliverables/ [2012-10-24]. Forward, S. E., Linderholm, I. & Forsberg, I. (2007). Drinking and driving. In-depth
interviews with convicted drivers. VTI rapport 553 (in Swedish with English summary).
Swedish National Road and Transport Research Institute, Linköping, Sweden.
Forward, S. E. (2010). Motives behind risky driving- driving under the influence of alcohol
and drugs. [Electronic] DRUID Deliverable 2.2.1. Project No.
TREN-05-FP6TR-S07.61320-518404-DRUID. Available: http://www.druid-project.eu /Deliverables/ [2012-06-20].
Gustafsson, S. & Forsman, Å. (2012). Analysis of drink-driving accidents: where and when
do the accidents occur? VTI notat 14-2012 (in Swedish with English summary). Swedish
National Road and Transport Research Institute, Linköping, Sweden.
Jones, W., Kugelberg F., Holmgren A. & Ahlner J. (2009). Five-year Update on the Occurrence of Alcohol and Other Drugs in Blood Samples from Drivers Killed in Road-traffic Crashes in Sweden. Forensic Science International, Vol. 186, pp. 56-62.
Subramanian, R. (2003). Alcohol involvement in fatal crashes 2001. NHTSA Technical Report. NHTSA, Washington.