Gender Inequality in
Education and
Economic Growth
MASTER
THESIS WITHIN: Economics NUMBER OF CREDITS: 30
PROGRAMME OF STUDY: Economic Analysis AUTHOR: Kenechukwu Obianuju Ezeh
Master Thesis in Economics
Title: The impact of gender inequality on Economic Growth in Sub-Saharan African countries
Author: Kenechukwu Obianuju Ezeh
Tutors: Almas Heshmati & Emma Lappi
Date: 2020-05-22
Key terms: Economic Growth, Human capital, Solow's augmented growth model, gender inequality, education
Abstract
The objective of this thesis is to examine the impact of gender inequality in education on economic growth using Sub-Saharan African countries. Two gender inequality indicators are used: the gap in female to male primary and secondary enrolment. The core of this study was built on the Solow Model but augmented using both human capital and health care expenditure (HCE) Per capita. The empirical analysis is centred on annual data for 40 Sub-Saharan African countries over the period 1990-2018. The method of estimation employed is both Ordinary Least Squares (OLS) and Fixed effect within-group estimator in a panel data set. Thus, the main findings of this paper suggest that there exists a statistically significant negative relationship of gender inequality in education at the primary and secondary level on economic growth and a negative effect of female labour participation on economic growth.
Table of Contents
1.
Introduction ... 1
2.
Literature Review ... 4
2.1 Gender inequality and Economic Growth ... 7
2.2 Socio-cultural factors contributing to the gender gap ... 10
3.
Background of Sub Saharan African countries ... 12
4.
Data, Empirical Models and Methodology ... 16
4..1 Data Description ... 16
4.2. Empirical Models ... 18
4.4 Limitations ... 22
5.
Empirical Results and Analysis of Result ... 23
5.1. Correlation Analysis ... 23
5.2. Empirical Results using primary enrolment as human capital and inequality variable ... 24
5.3. Empirical Results using secondary enrolment as human capital and inequality variable ... 27
6.
Conclusion ... 31
7.
Reference List ... 32
Figures
Figure 1 Male and female secondary school enrolment...13
Figure 2Gender Parity Index, for primary, secondary, and tertiary enrolment level 1980-2018….14 Figure 3. Female-male ratio of gross primary enrolment rates worldwide 1980-2018…………....15 Figure 4. Female-male ratio of gross secondary enrolment rates worldwide 1980-2018……..15
Tables
Table 4.1 Expected Variable results from previous literature………..21 Table 4.2 Descriptive Statistics ... 22 Table 5.1 Correlation Table ... 24 Table 5.2 Regression result of the OLS of the annual data. The measure of gender
inequality in education is based on the gender gaps in primary enrolment ... 26 Table 5.3 Regression result of Fixed effect of the annual data. The measure of gender inequality in education is based on the gender gaps in primary enrolment ... 27 Table 5.4 Regression result of the Ols of the annual data. The measure of gender
inequality in education is based on the gender gaps in secondary enrolment ... 28 Table 5.5 Regression result of the Fixed effect of the annual data. The measure of
gender inequality in education is based on the gender gaps in secondary enrolment ... 29
Appendix
Appendix A1 List of countries used ... 34 Appendix A2 List of variables, definition and sources ... 35 Appendix A3 The VIF table ... 36
1. Introduction
Growth theory proposes that physical capital, human capital, and labour force are the most vital factors that influence economic growth, which in turn depends on technological progress and the institutional framework of the production of the countries (Fedderke 2002). The different strands of the growth literature all agree on these factors (Solow 1956 Mankiw, Romer and Weil 1992). However, they have differences in ways that these factors interact with each other to influence economic growth. The importance of human capital had led to the viewing of the quality of the labour force and sees education, health, and experience among other factors as central elements of human capital that can boost labour productivity (Jones 2002). Gender inequality in education can affect the way all these factors influence economic growth. For instance when there is gender inequality in education, they will be restricted pool of talent from which to draw for education, where highly qualified girls who could outperform boys are omitted from the pool of talent, thereby reducing the quality of the human capital and also human capital accumulation. This can as well lead to a reduction in the quality of labour force, which can reduce labour productivity and has a dampening effect on the economy.
Human capital proxied by education has longed been perceived as a critical determinant of economic growth (Solow 1956 Mankiw, Romer and Weil 1992 Tallman and Wang 1994 Barro and Lee 2000). For instance, Mankiw et al. (1992) stressed that education could increase the human capital level in the labour force, which will directly increase the labour force productivity and can lead to the higher growth in output. Some other theories hold that education can improve the innovative capacity of the economy; this increase in the innovative size can promote the growth of output in the economy. (Lucas, 1988 Romer, 1990). Similarly, there is a consensus that education can improve the diffusion and transmission of knowledge, which is essential in understanding and processing of new information. This knowledge can help the individual to implement new technologies devised by others successfully and can increase the technological capacity of an economy (Benhabib and Spiegel, 1994).
contribute to the overall development of the economy (World Bank, 2012) due to it increases the pool of talents of which human capital is drawn from. Eliminating gender inequality is a vital and long-held goal for most countries, due to the positive effect it has on the growth of the economy. Gender inequality in education affects the accumulation of human capital within an economy due to it reduces the number of educated individuals where human capital is pooled from, which can have a depreciating impact on the economy (Klasen 2002). This issue has led international agencies such as the World Bank and the United Nations (UN) to improve and have a well-structured development strategy designed to reduce inequalities between men and women. Similarly, national governments have become aware of gender issues and have implemented policies designed to minimise differences between men and women. To that end, gender equality and achieving universal primary education was one of the Millennium Development Goals (MDGs) established by the United Nations which are the political agenda of almost every country. Advancement towards gender equality in Sub-Saharan Africa has been slow and uneven (UNESCO 2009). Though there was progress in terms of near-universal in primary and secondary education, however, enrolment of girls at primary and secondary levels is lower than that of boys. There exist many factors, such as poverty, negative cultural values, early marriages, that influence the gender gap in education (Subrahmanian 2002). Poverty significantly contributes to gender gaps in education in Sub-Saharan African countries, as most parents will prefer sending the boys to a school than the girls (Ervin and Muriiithi 2009).
Ali (2011) established that females are the most affected group in developing countries, regarding basic education, job participation, freedom of expression, as well as political participation. Also, Dollar and Gatti (1995) estimated the education gap in schooling in the poorest countries in the year 1990. The result showed that 5% of adult women had secondary school education, one-half of the level of men. In contrast, in the wealthiest quartile (developed nations) 51% of adult women had at least secondary education as opposed 88% of the level of men that had at least some secondary education, which tallies with Klasen (2002) empirical research, that studies gender inequalities in education and its effect on economic growth.
To that end, the purpose of this thesis is to investigate how does gender inequality in education influence economic growth in Sub-Saharan African countries? This thesis will do so by estimating the gap in female and male primary and secondary school enrolment as the education variable to test the effects on economic growth. This paper will distinguish itself from other empirical studies within the field by augmenting the Solow model with both human capital and health capital and adopting a panel data ordinary least square and fixed-effect model. This thesis contributes an element to the empirical literature on the impact of gender inequality in education on economic growth. Firstly, a large number of Sub Saharan Africa countries (40), is taken into consideration to investigate the impact of gender inequality in education on economic growth, of which the group of countries used are centred to only the Sub-Saharan African countries than most of the sample used in previous works of literature since they included both developing, developed and MENA countries1. Secondly, to see if the effect the Millennium Development Goal’s (MDG) target of universal primary education had on the economy.
The next section provides the literature review and the socio-cultural factors contributing to the gender gap in education. In section 3, it presents the background of the Sub-Saharan African countries. Thereafter, the data, empirical models and methodology are presented. In the end of section 5, the result from the regression output is presented and analysed in relations to theoretical assumptions. Section 6 presents the conclusion along with suggestions for further research within this field.
2. Literature Review
Numerous theories have tried to evaluate the determinants of economic growth, ranging from the Neoclassical exogenous Growth Models, Endogenous Growth Models and Institutional Growth Models. Many of these models have stressed the importance of human capital accumulation for economic growth. In the 1960s, growth theory was concentrated more on the neoclassical model as developed by Solow (1956), Swan (1956), Cass (1965) and Koopmans (1965). The concept of capital in this model can be broadened from physical capital to include human capital in the form of education (Lucas 1988, and Barro and Sala-i-Martin 1995).
Solow (1956) developed a model from the neoclassical production function and assumed diminishing marginal returns to capital, exogenous population growth and savings rate, no depreciation and technological progress. The model predicts how the steady-state level of income per capita depends on savings rate, population growth rate, which leads to the view of convergence. In testing the Solow model, Mankiw, Romer and Weil (1992) presented the augmented Solow growth model which yielded up with an equation that includes both physical and human capital as the fundamental determinant of growth. It sees output growth as an element of physical capital, human capital, exogenous labour growth rate and technological improvement. They tested by looking at the fundamental Solow model and the Augmented Solow model, and they position those distinctions in the growth rate of per capita income across countries is due to the disparities in investment in human capital and physical capital. The study showed human capital as a proxy for education, when there is an increase, it leads to the increase in the quality of the labour force, which in turn boost economic growth due to high productivity
The Neoclassical growth theory believes that growth of output depends on three factors, namely: capital stock, the labour stock and the effectiveness of labour which is described as technological change2. Solow's neoclassical growth model exhibits diminishing returns to Labour and capital separately (Todaro & Smith, 2006). The Solow model predicts the rate of change of the capital stock per unit of effective labour, are the differences between
2Cobb- Douglas production function 𝑌
two terms3. Increase in human capital in the growth model has shown to be suitable in predicting the size of the capacity and the extent of the alpha. Mankiw, Romer and Weil (1992) found that when the Solow model is augmented with human capital, it enhances the predicting power of cross-country economic growth explanation. Therefore, the production function can be modified to include the stock of human capital4. If gender inequality enters the theoretical model through the human capital, and it is the portion of educated male and the portion of educated females’ population, it can be given as: H = ᵞPM + δPF (3.1)
Where,
ᵞ
and δ are portion of educated male in PM and portion of educated female in PF.Then assuming perfect educational gender equality implies
ᵞ=
δ5 and the female and malepopulation is equal. This can be further modified to include.
ℎ ̇(𝑡) = 𝑤𝑡ℎ𝑦
𝑡− (𝛼 + 𝛿)ℎ𝑡 = 𝑤𝑡ℎℎ𝑡 𝛽
− (𝛼 + 𝛿)ℎ𝑡 (3.2) Where 𝑤𝑡ℎ is a fraction of human capital investment in period t. ℎ𝑡 = ( 𝐻𝑡
𝐿𝑡) is the human
capital per effective unit of labour. Similarly, the Solow model can be augmented to include health care expenditure (HCE) Per capita (health capital). And the inclusion of health capital is determined by
𝑒 ̇(𝑡) = 𝑤𝑡𝑒𝑦𝑡− (𝛼 + 𝛿)𝑒𝑡 = 𝑤𝑡𝑒ℎ𝑡ᵞ − (𝛼 + 𝛿)𝑒𝑡 (3.3) Where 𝑤𝑡𝑒 is a fraction of health capital investment in period t. 𝑒𝑡 = ( 𝐸𝑡
𝐿𝑡) is the health
capital per effective unit of labour. The inclusion of physical, human and health capital improves the Solow Model (Heshmati 2018)
Other empirical studies have also investigated the effect of human capital on economic growth, Tallman and Wang (1994), among others, who use school enrolment as a proxy
3 𝑘 ̇(𝑡) = 𝑤
𝑡𝑘𝑦𝑡− (𝑛 + 𝑔 + 𝛿)𝑘𝑡= 𝑤𝑡𝑘𝑘𝑡𝛼− (𝑛 + 𝑔 + 𝛿)𝑘𝑡. Where 𝑤𝑡𝑘 denoted the fraction of output invested in
physical capita at period t. k converges to a steady-state value k* which is defined by 𝑘𝑡∗= [𝑤𝑡𝑘/(𝑛 + 𝑔 + 𝛿)]1/(1−𝛼)
4 𝑌 𝑡= 𝐾𝑡𝛼𝐻𝑡 𝛽 𝐴𝑡𝐿𝑡 1−𝛼−𝛽 𝛼 + 𝛽 < 1
for human capital found out that human capital has a positive effect on economic growth. Barro and Lee (2000) created a series for education based on educational attainment rather than using school enrolment as a proxy for human capital and came about with similar result of the positive effect of education. They deemed it fit for educational attainment as the best proxy for human capital, and the education attainment means the percentage of the population who has completed a given level of schooling, either secondary or tertiary. In his earlier research, Barro (1996) proposed that an increase in the level of real per capita GDP is improved by the rise in initial schooling and life expectancy, lower fertility, lower government consumption, lower inflation and improvements in terms of trade. On the empirical side, there has been the development of new international panel data sets, which has allowed scholars the opportunity to analyse the determinants of economic growth. These empirical models (Klasen 2002, Knowles et al. 2002, Klassen and Lamanna 2009) and follow the logic of the theoretical works of literature (Solow 1956 Mankiw, Romer and Weil 1992) which holds the importance of the growth rate of the labour force, savings, technological change, and human capital on the growth rate of the economy. Institutional element, corruption, political instability, being landlocked, openness to trade, the quality of public service, among others, were some factors examined in this context. (Barro,1991 Sachs and Warner, 1995 Bloom and Williamson, 1998). These authors do not only differ in the inclusion of certain variables perceived to influence the steady-state level of GDP, but also on the model specification in the determinants of economic growth.
Briefly looking at education spillovers on GDP per capita. Sen (1989) viewed that education can help and increase production in the economy. Also, according to Benos and Karagiannis (2016) finds that primary education reduces labour productivity, lower secondary education plays no effect on productivity, while upper secondary education and tertiary education have a productivity-enhancing impact. This can be translated to the positive spillover effect from tertiary education on labour productivity in an economy. Pereira and Aubyn (2009) finds that increasing education of the working-age population at all levels has a positive effect on GDP per worker in Portugal. Similarly, Ramos et al (2010) suggest that tertiary and secondary education increases labour productivity and growth, respectively, while primary education does not exert any influence in the economy. Also, Kosfeld and Lauridsen (2004) concluded that employed people with at
least secondary education increases both GDP per employed and GDP per capita in 180 German labour markets. This shows that education has a positive impact on the economy through its effect on labour productivity as well as human capital.
2.1 Gender inequality and Economic Growth
There exists a considerable amount of literature that studied gender inequality and economic growth and have come up with arguments on how gender inequality can act as a barrier to economic growth. Concerning gender inequality in education and economic growth, analysing the findings of most of the works of literature, results suggest that when there is gender inequality in education, it can reduce the average amount of human capital in a society which hinders economic performance. This effect does so by restricting the pool of talent from which to draw for education, thereby excluding highly qualified girls who could outperform boys and taking less skilled boys as the case may be. In contrast, if there is a decline in the marginal returns to education with imperfect substitutability between males and females. When there is a restriction in the education of girls to lower levels, while educating more boys at a higher level, this means that the marginal returns to educating girls are higher than that of boys and this would increase the overall economic performance (Knowles et al. 2002, Schultz 1993 Blackden 2006).
Also, female education can have an indirect effect on economic growth. There perceives a positive externality in female education. Females with a high level of education are known to have low fertility rate, that is, the promotion of female education can reduce fertility, child mortality levels and aids in the education of the next generations. As each of these factors, in turn, has a positive effect on economic growth in an indirect aspect. For instance, Galor and Weil (1996) stated that the gender gap in education and earnings increases fertility and negatively affects economic growth. Which can be expressed as when there is a reduction in inequality, it affects fertility adversely, as the more educated a mother, the more unlikely she gives birth to more children, which can lead to lower population growth and higher levels of capital per worker. In a similar vein, Lagerlöf (2003) captures the concept of gender inequality in education, fertility and economic growth using overlapping generation models. The result showed that female education is beneficial for economic growth as it helps in the reduction in fertility and helps in the
growth of the economy. This notion can be practical to significant numbers of countries in the Sub-Saharan Africa countries that have low levels of income.
Looking at empirical works of literature, Barro and Lee (1994) when looking at education effects found out that when there is an inclusion of male and female primary and secondary school, the coefficient of the female schooling is negative, which indicates that female education reduces the growth of the economy. Many authors found this result puzzling and re-examined the model (Dollar and Gatti 1999 Klasen 2000). They came about some shortcomings of the model used by Barro and Lee. As the model used had problems of endogeneity of the variable which can distort the result gotten. Other issues include the absence of regional dummy variables, especially for Latin America and East Asia and the high collinearity between male and female education.
In contrast, Dollar and Gatti (1999) estimated a growth equation looking at gender inequality in four diverse dimensions and treated them as an endogenous variable for hundred countries in a year ranging from 1975-1990 and found in contrast with Barro and Lee (1994) that gender inequality in education hinder economic growth. The authors gave a detailed empirical analysis of country-specific effects of female education. They concluded that the negative impact of gender inequality in education on growth is concentrated on industrial countries and less concentrated on agricultural societies (low levels of development). This result is different from Barro's study because they controlled for regions by including a dummy variable for regions (Latin America, Sub-Saharan Africa, East Asia and OECD countries) and also used instrumental variable estimations to control for the possible endogeneity between the variables6.
Also, Klasen (2002) used Barro's model and solved the shortcomings of the model. He found out that when the problem of multicollinearity is solved, and regional dummy variable are included, the adverse effect associated with female education turns. When analysing the direct and indirect effects of gender inequalities in education, the author argued that the use of male and female education variable separately might create high multicollinearity between the variables, thereby leading to biases. So, he conducted a
6 Baliamoune-Lutz and McGillivray (2015) presented a result from four estimation techniques (OLS, within
groups, GMM-DIF, GMM-SYS estimator) and found out that the results for the estimation techniques are similar.
growth equation and included a variable for the total level of education and a variable for gender inequalities in education to separately identify their effects on growth and found a positive impact of gender equality in education on growth. Klasen and Lamanna (2009) updated Klasen (2002) previous studies on education gaps and growth. They extended the analysis to employment gaps using panel data for an extended period 1960-2000, the authors found out that gender gaps in education and employment gaps reduce economic growth. These results vary from Dollar and Gatti (1999) as they did not find that the negative effect of gender inequality on growth is concentrated mainly on the industrial countries than the agricultural countries. This difference can be due to the more extended time used, no multicollinearity problems and different variables dataset.
Hill and King (1995) studied the impact of gender inequality on education in an empirical analysis. They estimated an output production function, which included the stock of physical capital, the labour force, and the gender gap in education, which was measured by the female to male enrolment ratio for a sample of 152 countries. The findings showed that a low female-male enrolment ratio is linked with a lower level of GDP per capita. Generally, they found that countries with a more significant educational inequality will have 25% lower output than a country with a smaller educational disparity. Similarly, Baliamoune-Lutz and McGillivray (2015) looked at gender inequality and growth in 31 Sub-Saharan African and 10 Arab countries, using Arellano-Bond estimations. The result showed that gender inequalities in literacy had statistically significant adverse effects on growth and that the interaction between openness to trade and gender inequality had a positive impact. The result shows that the gender gap inequalities may accompany trade-induced growth.
Castello & Domenech (2006) using panel data, studied the inequality of human capital proxied by education, on how it affects economic growth. The study showed how inequality in human capital would reduce life expectancy, which affects economic growth. The result showed the existence of multiple steady states which depends on the initial flow of education. The study suggested that the life expectancy mechanism explains a vital part of the relationship that exists between gender inequality and human capital accumulation.
In line with the theoretical and empirical works of literature on economic growth, one can see that there exist various linkages between gender inequality and economic growth. For one, there is a belief that gender inequality reduces the productivity of human capital in the economy, and this negatively affects economic growth. Also, since most studies show that there is a higher chance for a female to enrol in school if she had an educated mother. This points to the fact that female education can promote the quantity and quality of education of their children as they try to support and enable a positive environment for their children. A family that has equally educated children can help each other by offering support which can strengthen each other's success and abilities, which can increase the quality of human capital and can directly influence economic growth. Looking at the indirect effects on economic growth, firstly, reduced fertility which can translate to a reduction in population growth can reduce the dependency burden, which brings about more savings in the economy.
2.2 Socio-cultural factors contributing to the gender gap
There exist some socio-cultural factors contributing to gender inequality in education. For instance, the World Development Report (World Bank, 2005) emphasised that economic and cultural disparities feed on each other, which leads to gender inequality traps. Also, Morrisson and Jutting (2005) stated that the biased social norms could negatively affect a wide range of gender inequality indicators such as female labour participation and the female-male literary ratio. Some authors highlighted the fact that cultural factors are directly responsible for gender differences in education in developing countries (Dollar and Gatti, 1999 Norton and Tomal, 2009 Cooray and Potrafke 2011 Hiller 2014). This gender stereotypes that exist in the developing countries which assigns roles to men and women can shape investments made by parents to their children's human capital. For instance, if there exists a compelling norm that views a man should be the primary breadwinners for the family, parents may grant low value to the education of their girl child.
Another argument that contributes to the gender gap in education is child labour. Child labour has longed been a widespread problem in developing countries, especially in the Sub-Saharan Africa countries (Subrahmanian 2002). When a child under the age of 15 devotes time to work, this interrupts their schooling, which in most cases prevent them
from enrolling in schools or attending school. Child labour poses a significant threat to education systems, as children are forced to work rather than attend school. Alternatively, they will have to divide their time between school and working, which affects the ability to learn and use the knowledge gained.
3. Background of Sub Saharan African countries
Gender inequality limits the growth of individuals and the development of nations (Seguino, 2000, Klasen 2002, Hill and King 1995, Klasen 1999, Knowels et al. 2002, Baliamoune-Lutz 2007, Klasen et al. 2008). The Sub-Saharan Africa (SSA) region consist of forty-two countries (42) on the African continent south of the Saharan Africa and the six (6) island nations close to it. Totalling forty-eight (48) sub-Saharan Africa countries. The importance of education is crucial in this region as it plays a role in promoting economic development through the means of increasing the human capital level of the region as well as increasing the quality of the labour force. Sub-Saharan Africa region has recorded a growing change in both educational participation and expansion in all levels of education.
Looking at past figures, the number of children enrolled in primary school education has grown tremendously from 12 million to almost 61 million between the years 1960 and 2000 and rapid growth from about 80 million in 1999 to 101 million in 2004 (UIS 2009). This expansion was possible in countries like Benin, Ethiopia, Guinea, Lesotho, Niger, Madagascar, and Tanzania following the elimination of school fees (UNESCO 2007). The average adult literacy rate in SSA had a minimal increase from 53% to nearly 59% between 1990 and 2012 (UIS 2009). Which is definite progress in achieving educational attainment for the region. Despite the improvement in educational attainment, educational enrolment inequalities remain in this sector.
In Sub- Saharan African countries, the education of boys and girls is uneven and biased, which results in higher illiteracy rates for girls and women (UNESCO 2015). According to UNESCO (2009), the average primary school completion rate for a boy is 56%. Still, only 46% for girls, with about five countries (Burkina Faso, Niger, Madagascar, Mozambique, Guniea) having less than 15% girls completing primary school, this shows that most girls either drop out of school due to, for example, cultural beliefs and poverty. The UIS (2019) data stated that 9 million girls between the ages 6 and 11 would never go to school, compared to 6 million boys across the regions, in order words, 23% girls are out of primary school compared to 19% of boys. According to the estimates, about 187 million adults lacked necessary literacy skills in 2012, of which 61% were women.
Inequality in education is also seen in secondary school education and tertiary education (figure 2), with Gender Parity Index (GPI) where 1 means there is gender parity, 0.78 in secondary and 0.62 in tertiary education in 2018. Which implies that there is more gender inequality in tertiary education than in secondary education. In order words, more than 60% of the adult illiterates in Sub-Saharan Africa are women. In 2012, less than 80 girls were enrolled in primary schools for every 100 boys in countries like Angola, Central African Republic, Chad, and South Sudan, while girls and boys were at uniformity in twelve countries in the Sub- Saharan Africa countries. Unlike in countries like Congo, Gambia, Senegal and Seychelles, gender disparities have reversed. For example, in countries like Gambia and Senegal, there is an increase in the ratio of girl's enrolment in proportions to boys. With more boys dropping out of school, this may be because of boys dropping out of schools to work in farms (UNESCO 2015).
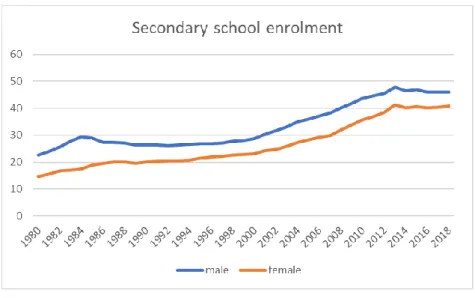
Source: World Development Indicators (World Bank)
Figure 1 Male and female secondary school enrolment in Sub-Saharan Africa
Figure 1 shows the Sub-Saharan Africa (SSA) countries, secondary school enrolment of male and female individuals between 1980-2018. The graph above shows that more males are enrolled in secondary school than females. Gender parity index is the ratio in the enrolment levels of girls to boys in both public and private schools. In figure 2 using the gender parity index for the year 1980-2018 indicates that there is near gender parity in primary school enrolment as its increasing and close to 1. Nevertheless, gender inequality is visible more in tertiary levels than in the secondary levels. The figure below (figure 2)
education. Of which is in line with Dube (2015), that expressed that the gender enrolment gap begins from the primary school level and progresses till upper levels of education which then filters girls out of the educational system. The figure (2) shows that there has been an improvement over the years as the various levels of education are moving to gender parity of one (1), where one, means equality.
Source: World development indicators (World Bank)
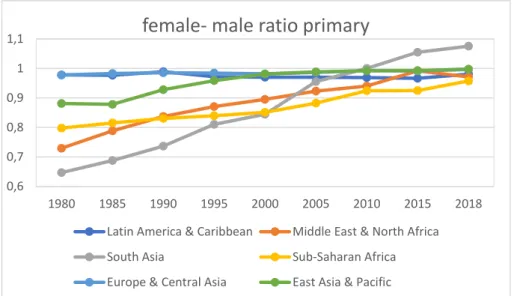
Figure 2. Gender Parity Index, for primary, secondary and tertiary enrolment level 1980-2018 In comparison with other regions, Figure (3) illustrates the female-male ratio of gross primary enrolment worldwide. Gross primary enrolment is the ratio of total enrolment, irrespective of age, to the population of the age group that officially corresponds to the level of education. There has been progress in the achievement of gender parity in primary enrolment. Although significant differences persist in Sub- Saharan Africa countries compared to other regions.
Source: World development indicators (World Bank)
Figure 3. Female-male ratio of gross primary enrolment rates worldwide 1980-2018
In contrast, progress in reducing gender inequality in secondary enrolment has been much slower and more uneven in some regions. For instance, as illustrated in Figure (4), secondary enrolment rates of females are slowly progressing as oppose in primary enrolment rates in some regions.
Source: World development indicators (World Bank)
Figure 4. Female-male ratio of gross secondary enrolment rates worldwide 1980-2018
The figure above shows the gender gaps in education in all regions, with a significant gap persistent in Sub-Saharan Africa countries.
0,6 0,7 0,8 0,9 1 1,1 1980 1985 1990 1995 2000 2005 2010 2015 2018
female- male ratio primary
Latin America & Caribbean Middle East & North Africa South Asia Sub-Saharan Africa Europe & Central Asia East Asia & Pacific
0,4 0,5 0,6 0,7 0,8 0,9 1 1,1 1980 1985 1990 1995 2000 2005 2010 2015 2020
female-male ratio secondary
Latin America & Caribbean Europe & Central Asia East Asia & Pacific Middle East & North Africa Sub-Saharan Africa South Asia
4. Data, Empirical Models and Methodology
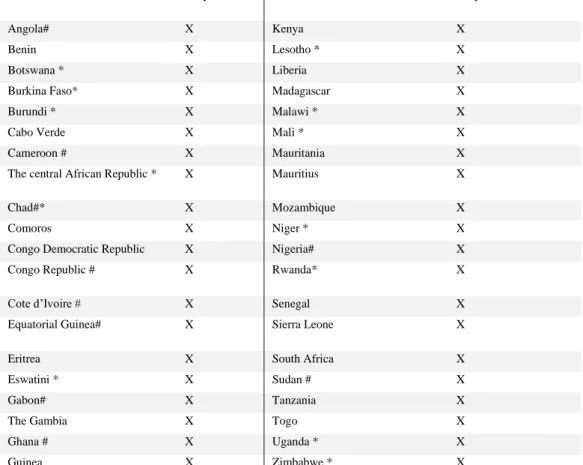
The data sets used in this study originates from the World Bank Development Indicators (WDI). It covers 40 Sub Saharan countries for period 1990-2018. The classification of sub-Saharan African countries into landlocked countries and oil-producing countries originates from the United Nations (UN) and CIA's world factbook respectively, and this served as a guide when classifying the countries in the various groups. The list of countries used can be seen in the appendix (Table A1)
4..1 Data Description
This thesis uses the augmented Solow model to test gender inequality in education on economic growth. The following variables were used in this thesis:
Measurement of Economic Growth
Gross Domestic Product per capita (Constant US$) has always been widely used by many works of literature as a good proxy for economic growth (see Valliere & Peterson 2010, Carree & Thurik 2005 Klasen 2002). The GDP per capita will be used as the dependent variable as the dataset is from the World Bank Development Indicators (WDI).
Explanatory variables
Following (Klassen and Lamma 2009Klasen et al. 2008 Knowels et al. 2002 Klasen 2002 Robert Barro and Jong-Wha Lee 1994 Lagerlöf 2003) we include several variables that commonly influence economic growth and are generally used in growth equation. These variables include labour force and capital. Labour force growth is assumed to have a positive effect on GDP since a larger share of increases in the labour force will increase production. Labour force is defined as the number of the working population (15+). Gross fixed capital is used to proxy for the investment in physical capital (k). There will be two indicators for Human capital, and they will be used separately to avoid multicollinearity issues. The indicators are the primary and secondary enrolment; the data is from the Worldbank indicators (WDI).
Following, Heshmati (2018), we add health capital into the model, this is because it is assumed that when there is the addition of both the human capital and health capital, it
strengthens the Solow model performance. Health capital is expected to have a positive effect on the level of economic growth. The health capital will be proxied by healthcare expenditure per capita (Current US $).
Measurement of gender inequality in education
The choice of different measures of gender inequality is useful for robustness checks (Cuberes & Teignier, 2011). Many authors have used a different number of variables to measure gender inequality and its effects on economic growth (Klasen & Lammanna (2009) Baliamoune-lutz & Mcqillivray (2015) Seguino (2000) Assoumou-ella (2019). There has been progress in measuring gender inequality in education. For this paper, two measurements of gender inequality are used. The indicators are the share of female to male ratio in primary and secondary school enrolment will be used to capture gender inequality in education which measures the relationship to economic growth at each level of education.
The following equation is used to derive the gender inequality variables, for the enrolment inequality in primary and secondary education:
𝐸𝑑𝑢. 𝑖𝑛𝑒𝑞𝑢𝑎𝑙𝑖𝑡𝑦𝑒𝑑𝑢𝑝𝑟𝑖𝑚𝑎𝑟𝑦 =𝐺𝑟𝑜𝑠𝑠 𝐸𝑛𝑟𝑜𝑙𝑚𝑒𝑛𝑡 𝑓 𝑝𝑟𝑦 −𝐺𝑟𝑜𝑠𝑠 𝐸𝑛𝑟𝑜𝑙𝑚𝑒𝑛𝑡 𝑚 𝑝𝑟𝑦 𝐺𝑟𝑜𝑠𝑠 𝐸𝑛𝑟𝑜𝑙𝑚𝑒𝑛𝑡 𝑚𝑝𝑟𝑦+𝐺𝑟𝑜𝑠𝑠 𝐸𝑛𝑟𝑜𝑙𝑚𝑒𝑛𝑡 𝑓𝑝𝑟𝑦 (4.1) 𝐸𝑑𝑢. 𝑖𝑛𝑒𝑞𝑢𝑎𝑙𝑖𝑡𝑦𝑒𝑑𝑢𝑠𝑒𝑐𝑜𝑛𝑑𝑎𝑟𝑦 = 𝐺𝑟𝑜𝑠𝑠 𝐸𝑛𝑟𝑜𝑙𝑚𝑒𝑛𝑡 𝑓 𝑠𝑒𝑐−𝐺𝑟𝑜𝑠𝑠 𝐸𝑛𝑟𝑜𝑙𝑚𝑒𝑛𝑡 𝑚 𝑠𝑒𝑐 𝐺𝑟𝑜𝑠𝑠 𝐸𝑛𝑟𝑜𝑙𝑚𝑒𝑛𝑡 𝑚𝑠𝑒𝑐+𝐺𝑟𝑜𝑠𝑠 𝐸𝑛𝑟𝑜𝑙𝑚𝑒𝑛𝑡 𝑓𝑠𝑒𝑐 (4.2)
Oil exporting countries: The dummy is for countries that export oil and is listed by CIA's
world factbook, which contains the various countries with how many barrels they export. Since oil-exporting countries are assumed to have higher GDP, controlling for this is essential. Following the CIA's world factbook and UN classification of Sub Saharan countries ten (10) Sub Saharan Africa countries are oil exporters, in order words, countries that export oil is equal to one while zero (0) otherwise. For instance. Baliamoune-Lutx & Mcgillivray (2009) stated that oil rents have a positive effect on economic growth.
Female labour participation: This variable shows the proportion of female in the labour
force as a share of all females in the age of 15 and over, who are economically active. The variable captures all females in the labour force that helps in the production of goods and services. The variable is expected to influence GDP positively since when there is an increase in females in the labour force, the output of production is supposed to increase as well. This shows the extent to which women are active in the labour force (Baliamoune-Lutx & Mcgillivray 2009).
Openness to trade: The variable is measured by the ratio of trade (exports and imports)
to GDP. The variable acts as a proxy for a country's level of integration in world markets. It is expected to have a positive effect on economic growth (Baliamoune-Lutx & Mcgillivray 2009).
𝑂𝑝𝑒𝑛𝑒𝑠𝑠 𝑡𝑜 𝑡𝑟𝑎𝑑𝑒 = 𝐼𝑚𝑝𝑜𝑟𝑡+𝑒𝑥𝑝𝑜𝑟𝑡
𝐺𝐷𝑃 (4.3)
Landlocked countries: This takes in the form of dummy variables and indicates 1 for
landlocked countries and zero (0) otherwise. This dummy is used to control how countries are affected due to trade restrictions. A landlocked country is expected to have a negative impact on GDP (Frankel and Romer 1999, Mackellar et al. 2002). Using the UN statistic division grouping of countries, fifteen of the Sub Saharan Africa countries are landlocked. Several studies have shown the importance of capturing the effect of landlocked countries (Mackellar et al. 2002, Amin et al. 2015). The summary of the variables used is found in the appendix (Table A2)
4.2. Empirical Models
The thesis is based on a panel-data of 40 Sub-Saharan African countries. Which contains observation for both the cross-sectional units (countries) and over several periods (1990-2018). The paper uses labour force (the average growth rate of the working population (15-64 years), capital, and the real GDP. Following Romer, Mankiw and Weil (1992), I assume g and δ as fixed. Because g is the advancement of knowledge and technology which is not country-specific and there is no available data on depreciation rate. However, no research has shown any plausible justification to expect significant variations of depreciation across countries.
When estimating the Solow model, it takes the following form, which has been used as the fundamental model (Barro and Sala-i-Martin 1992 Heshmati 2018):
𝑙𝑛𝑦𝑖𝑡 = 𝛽0+ 𝛼
1−𝛼−𝛽 𝑙𝑛𝑤𝑖𝑡 𝑘− 𝛼
1−𝛼ln(𝑛 + 𝑔 + 𝛿) + 𝜀𝑖𝑡 (4.4) 7
For estimating the augmented Solow model, including human capital, to find out the impact of gender inequality in education on economic growth. (equation 3.1). The standard human capital can be further given as
𝑙𝑛𝑦𝑖𝑡 = 𝛽0+ 𝛼 1−𝛼−𝛽 𝑙𝑛𝑤𝑖𝑡 𝑘+ 𝛼 1−𝛼−𝛽ln𝑤𝑖𝑡 ℎ− 𝛼+𝛽 1−𝛼−𝛽𝑙𝑛(𝑛 + 𝑔 + 𝛿) + 𝜀𝑖𝑡 (4.5)
From equation (4.5) is further given when augmenting Solow model, including health capital: 𝑙𝑛𝑦𝑖𝑡 = 𝛽0+ 𝛼 1−𝛼−𝛽−ᵞ 𝑙𝑛𝑤𝑖𝑡 𝑘 + 𝛽 1−𝛼−𝛽−ᵞln𝑤𝑖𝑡 ℎ+ ᵞ 1−𝛼−𝛽−ᵞ 𝑙𝑛𝑤𝑖𝑡 𝑒 − 𝛼+𝛽+ᵞ 1−𝛼−𝛽−ᵞ𝑙𝑛(𝑛 + 𝑔 + 𝛿) + 𝜀𝑖𝑡 (4.6)
The model in equation (4.6) can be estimated using OLS and shows that the rate of technical progress exogenously determines the slope. The intercept shows the effects of the rate of labour growth and the investment in physical, human and health capital. The following regressions will be carried out in the OLS regression.
𝑙𝑛𝐺𝐷𝑃 = 𝛽0+ 𝛽1𝑙𝑛𝐿𝑎𝑏𝑜𝑢𝑟𝑖𝑡+ 𝛽2𝑙𝑛𝐶𝑎𝑝𝑖𝑡𝑎𝑙𝑖𝑡+ 𝛽3𝐼𝑛𝑒𝑞𝑢𝑎𝑙𝑖𝑡𝑦 𝑒𝑑𝑢𝑖𝑡+ 𝜀𝑖𝑡 (4.7)
Where i represents each country and t represents each time.
It is expected that the augmenting the Health and Human capital variable will help explain the Solow growth model better (equation 3.11). The following equation is used to test the impact of gender inequality in education, augmenting the Solow model with both Health and Human capital:
𝑙𝑛𝐺𝐷𝑃 = 𝛽0+ 𝛽1𝑙𝑛𝐿𝑎𝑏𝑜𝑢𝑟𝑖𝑡+ 𝛽2𝑙𝑛𝐶𝑎𝑝𝑖𝑡𝑎𝑙𝑖𝑡+ 𝛽3𝑙𝑛𝐻𝑢𝑚𝑎𝑛 𝐶𝑎𝑝𝑖𝑡𝑎𝑙𝑖𝑡+
𝑙𝑛𝐺𝐷𝑃 = 𝛽0+ 𝛽1𝑙𝑛𝐿𝑎𝑏𝑜𝑢𝑟𝑖𝑡+ 𝛽2𝑙𝑛𝐶𝑎𝑝𝑖𝑡𝑎𝑙𝑖𝑡+ 𝛽3𝑙𝑛𝐻𝑢𝑚𝑎𝑛 𝐶𝑎𝑝𝑖𝑡𝑎𝑙𝑖𝑡+ 𝛽4𝑙𝑛𝐻𝑒𝑎𝑙𝑡ℎ𝑡+
𝛽5𝐼𝑛𝑒𝑞𝑢𝑎𝑙𝑖𝑡𝑦 𝑒𝑑𝑢𝑖𝑡+ 𝜀𝑖𝑡 (4.9)
𝑙𝑛𝐺𝐷𝑃 = 𝛽0+ 𝛽1𝑙𝑛𝐿𝑎𝑏𝑜𝑢𝑟𝑖𝑡+ 𝛽2𝑙𝑛𝐶𝑎𝑝𝑖𝑡𝑎𝑙𝑖𝑡+ 𝛽3𝑙𝑛𝐻𝑢𝑚𝑎𝑛 𝐶𝑎𝑝𝑖𝑡𝑎𝑙𝑖𝑡+ 𝛽4𝑙𝑛𝐻𝑒𝑎𝑙𝑡ℎ𝑡+
𝛽5𝐼𝑛𝑒𝑞𝑢𝑎𝑙𝑖𝑡𝑦 𝑒𝑑𝑢𝑖𝑡+ 𝛽6𝐶𝑜𝑛𝑡𝑟𝑜𝑙𝑠 + 𝜀𝑖𝑡 (4.10)
Where i represents each country and t represents each time.
The variables were examined using White's Heteroscedasticity test. It showed that there exists heteroscedasticity in the data sets. When there is heteroscedasticity in the data, it indicates that the variances in the estimators can be misleading and can bias the result (Gujarati,2003). Hence, to solve the heteroscedasticity issue, the robust standard error was used while running the regressions and presented instead of the ordinary standard errors. Also, the correlation table and the variance inflation factor (VIF) did not indicate multicollinearity problems of the dataset, and it is shown in the Appendix (Table A3)
4.3. Empirical Methods
To test the purpose of this study, a panel data analysis using Ordinary Least Squares (OLS) is adopted. The advantages of using panel data lie in the fact that panel data allows higher statistical efficiency and it is believed to be more effective than most cross-sectional or time-series models and fewer multicollinearity problems (Gujarati and Porter, 2009).
According to Baltagi (2008), If the data has many cross-sections in relation to the time. That is if cross-section (N) is large and time (T) is relatively small, the use of a fixed-effect model is suggested to avoid non-stationarity to affect the significance of the coefficients. This is because macroeconomic data by nature is characterised to be non-stationary and follows a random walk. The advantage of using a fixed-effect model lies in the fact that it favours robustness and controls for unobserved heterogeneity bias which is in the form of omitted variable bias which is vital to this analysis. The fixed effect controls for country characteristics and time-invariant characteristics. The fixed-effect model with country and time fixed effect will be used to estimate the research question in this paper
𝑙𝑛𝐺𝐷𝑃𝑖𝑡 = 𝛽0+ 𝛽1𝑙𝑛𝐿𝑎𝑏𝑜𝑢𝑟𝑖𝑡+ 𝛽2𝑙𝑛𝐶𝑎𝑝𝑖𝑡𝑎𝑙𝑖𝑡+ 𝛽3𝑙𝑛𝐻𝑢𝑚𝑎𝑛 𝐶𝑎𝑝𝑖𝑡𝑎𝑙𝑖𝑡+ 𝛽4𝑙𝑛𝐻𝑒𝑎𝑙𝑡ℎ𝑡+
Where 𝛿𝑡 indicates the time specifics effect (1990-2018), and 𝜇𝑖 indicates the country-specific
effect that is used in this paper.
Table 4.1 Expected Variable results from previous literature
Variables Signs Labour + Capital + Human capital + Health capital + Inequality in education - Openness to trade + Landlocked - Oil exporters +
Female labour force +
4.3. Descriptive Statistics
The descriptive statistics are presented, which shows the mean, median, standard deviation, the minimum and the maximum values of the variables used. Secondly, the descriptive statistics of the data set is presented below. Table 4.2 shows the overview of the mean, median, standard deviation, the minimum and the maximum values of the variables used.
Table 4.2 Descriptive statistics of the variables
Table A with annual years
Variable obs Mean Median Std. Dev Min Max
Dependent Variable
GDP (constant 2010 US$) 1159 259.315 73.473 672.816 2.146 4693.768 Independent Variable
Labour 1159 618.026 359.096 839.531 9.441 5840.381 Capital (constant 2010 US$) 1159 20.519 19.615 9.292 -2.424 61.469 Health Capital 1159 79.730 38.894 104.670 1.418 646.303 Primary Enrolment 1159 93.450 97.313 25.934 26.187 156.404 Secondary Enrolment 1159 36.266 33.629 21.291 4.987 109.444 Inequality in primary enrolment 1159 -0.065 -0.041 0.776 -0.387 0.948 Inequality in Secondary
enrolment
4.4 Limitations
Measurement problem may occur when measuring the impact of gender inequality on economic growth; this is due to the notion that systems of national accounts do not capture most female reproductive activities. Klasen (2002) pointed out in his article that two-third of female economic activities are not recorded in developing economies. Therefore, when analysing the effect of gender inequality in education on economic growth will suffer from the weakness of the dataset. Also, due to the missing values of some of the variables used. The use of linear interpolation was used to solve the problem of missing values which can distort the results. The model may suffer from endogeneity problem. Another limitation is that the thesis did not control for the social, cultural, and religious differences across countries which can spuriously affect the result.
Female labour participation 1159 60.425 63.622 16.086 23.448 90.770
5. Empirical Results and Analysis
The purpose of this chapter is to present the result of the thesis. The correlation table is shown to emphasise the correlations between the dependent and the independent variables. Also, to see if there is a correlation between the explanatory variables. Finally, the result will be presented and analyse.
5.1. Correlation Analysis
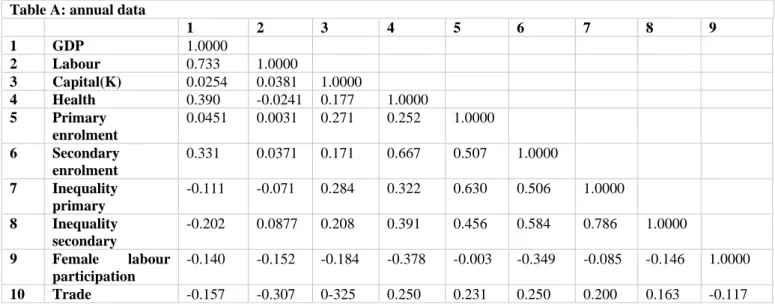
This section provides a correlation analysis of the dependent variable and independent variables used in the regression analysis. The table below contains a summary of the correlation between the variables used in the study. The correlation analysis objective is to measure the strength of the degree of the linear association between the variable used in this thesis. Labour is seen to be highly correlated with GDP at a 1% significance level and positive. Other independent variable shows a positive correlation with GDP. The correlation between gender inequality in primary enrolment and gender inequality in secondary enrolment is quite high (0.786), and it is significant.
Table 5.1: Correlation table
Table A: annual data
1 2 3 4 5 6 7 8 9 1 GDP 1.0000 2 Labour 0.733 1.0000 3 Capital(K) 0.0254 0.0381 1.0000 4 Health 0.390 -0.0241 0.177 1.0000 5 Primary enrolment 0.0451 0.0031 0.271 0.252 1.0000 6 Secondary enrolment 0.331 0.0371 0.171 0.667 0.507 1.0000 7 Inequality primary -0.111 -0.071 0.284 0.322 0.630 0.506 1.0000 8 Inequality secondary -0.202 0.0877 0.208 0.391 0.456 0.584 0.786 1.0000 9 Female labour participation -0.140 -0.152 -0.184 -0.378 -0.003 -0.349 -0.085 -0.146 1.0000 10 Trade -0.157 -0.307 0-325 0.250 0.231 0.250 0.200 0.163 -0.117
5.2. Empirical Results using primary enrolment as human capital and inequality variable
The empirical analysis below presents the OLS and fixed effect regression. The result in Table 5.2 and 5.3 presents the OLS and fixed effect within-group estimator using gender inequality indicators based on gender gaps in primary enrolment, all with year fixed effects.
Table 5.2: Regression result of the OLS of the annual data: The measure of gender inequality in education is based on the gender gap in primary enrolment
Note: Both dependent and independent variables are in log form except inequality in primary enrolment and trade.
Robust Standard errors in parentheses *** p<0.01, ** p<0.05, * p<0.1
The OLS regression in Table 5.3 shows the basic set of time-series regression using frequently used growth variables. It can be observed that there exists high R-squared value for the four regression outputs, indicating that the specified models can explain
OLS
VARIABLES GDP GDP GDP GDP
(eq4.7) (eq4.8) (eq4.9) (eq4.10)
Labour 0.741*** 0.742*** 0.884*** 0.893*** (0.0215) (0.0218) (0.0114) (0.0146) Capital 0.440*** 0.439*** 0.241*** 0.125*** (0.0517) (0.0522) (0.0448) (0.0393) Inequality primary 3.159*** 3.107*** -0.390** -0.362** (0.345) (0.418) (0.278) (0.242) Primary enrolment 0.0226 0.263*** 0.0638** (0.119) (0.0753) (0.0678) Health 0.823*** 0.647*** (0.0237) (0.0273)
Female labour force -0.629***
(0.0637) Trade 0.000658 (0.000538) landlocked -0.211*** (0.0300) Oil exporters 0.509*** (0.0469) Constant 10.70*** 10.57*** 6.956*** 9.456*** (0.362) (0.683) (0.400) (0.352) Observations 1,159 1,159 1,159 1,159 F-statistics 311.85*** 371.93*** 110.88***
Year Effects YES YES YES YES
R-squared 0.606 0.606 0.837 0.885
more than 60% of the variation in GDP per capita. The first column utilizes just the inequality in the primary variable, labour, and capital variable and GDP per capita as the dependent variable. The result from the first column gives that a 1 per cent change in Labour and Capital will yield a 0.741 and 0.440 per cent change in GDP respectively, though the inequality variable is positively significant at any levels. This is in line with the expected relationship between GDP per capita and the growth variables (Labour and capital) which has been theoretically motivated by authors (Solow 1956 Mankiw, Romer and Weil 1992).
The second equation (eq4.8) shows the regression of variables when including the education variable (primary enrolment), to test if it further explains the relationship between the inequality variable and GDP per capita. From the output, there is a positive and significant level of labour and capital variable, which indicates that a unit increase in the respective variables will lead to a rise in the level GDP per capita. On the other hand, the inequality in primary school enrolment still maintains the positive coefficient. Turning to the education variable, the coefficient has the expected sign, although it is not significant. Also appending human capital variable has a significant influence on the overall result. It significantly reduces the degree (from 44 % to 43%) of the coefficient of physical capital and increases the fitness of regression. Which shows that about 1 percent contribution is exerted by human capital measure, that is, the primary enrolment. Thus, this implies that a country whose labour force has more primary schooling makes the GDP per capita grow faster. The coefficient of the human capital (0.0226) describes the variation in GDP per capita captured by primary enrolment.
The third and fourth equation showcase the results after the inclusion of Health Care expenditure variable and Control variables, respectively. There maintains a positive relationship between GDP per capita and Labour, capital, and human capital variable. Appending the health capital has a different result as oppose the last two regression results. The inclusion of health capital changes the relationship between the GDP per capita and inequality in primary enrolment to be significantly negative. A 1 per cent increase in the inequality in primary enrolment rate leads to a decrease of -0.390 per cent in GDP per capita. This relationship between the GDP per capita and inequality variable
Mcqillivray 2015). This shows that the economic growth of a region or a country is negatively affected by a rise in inequality in education. Also, statistical significance is found in primary enrolment (which is the education variable) and the health variable. The last regression shows the inclusion of the control variables. Similarly, the coefficient of the physical capital and the inequality variable reduces. Which indicates that about 0.1 percent contribution and 0.03 percent respectively is exerted by the Control variables. However, the inequality in primary enrolment is negative and significant. The coefficient in the inequality in primary enrolment, in the last regression (-0.362) denotes that higher inequality in primary enrolment reduces the level of GDP per capita significantly. The F-statistics8 was calculated, and the conclusion drawn from it is that the models do have significant explanatory power and reject the null hypothesis that the explanatory variables are 0 and the model is improved by adding the human and health capital.
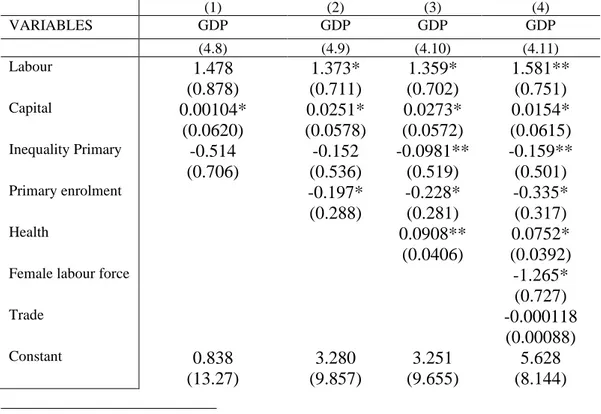
The table (5.3) below shows the Fixed effect within-group result, which helps in estimating country-specific effects and year effects. When estimating the relationship between the variables. The landlocked and the oil-exporting countries dummies are dropped.
Table 5.3: Regression result of Fixed effect of the annual data: The measure of gender inequality in education is based on the gender gap in primary enrolment
(1) (2) (3) (4) VARIABLES GDP GDP GDP GDP (4.8) (4.9) (4.10) (4.11) Labour 1.478 1.373* 1.359* 1.581** (0.878) (0.711) (0.702) (0.751) Capital 0.00104* 0.0251* 0.0273* 0.0154* (0.0620) (0.0578) (0.0572) (0.0615) Inequality Primary -0.514 -0.152 -0.0981** -0.159** (0.706) (0.536) (0.519) (0.501) Primary enrolment -0.197* -0.228* -0.335* (0.288) (0.281) (0.317) Health 0.0908** 0.0752* (0.0406) (0.0392)
Female labour force -1.265*
(0.727) Trade -0.000118 (0.00088) Constant 0.838 3.280 3.251 5.628 (13.27) (9.857) (9.655) (8.144) 8 F- statistics H 0= X1+X2=0
Year Fixed Effects YES YES YES YES Observations 1,159 1,159 1,159 1,159 R-squared 0.708 0.711 0.716 0.728 Number of countries 40 40 40 40
Note: Both dependent and independent variables are in log form except inequality in primary enrolment and trade
Robust standard errors in parentheses *** p<0.01, ** p<0.05, * p<0.1
Since OLS does not control for country-specific effects with time effects, the re-estimation of the same set of equations using fixed effect (within-group) estimator was done. As it can be observed from the estimates, the result has few outcomes that are significant unlike those obtained in the simple OLS estimation. On average there is lower R-squared value, unlike the OLS estimation. The first equation shows the positive significance level of Capital to GDP per capita. However, the labour variable shows a positive sign, and it is not significant at any level. There exist a positive and significance level of capital all through the regression output. The female labour participation in the last regression shows a significantly negative relationship with GDP per capita. The inequality variable is negative in all regressions, and significant in the last two regressions. It is essential to point out that, though most literature has stated that there exists a near gender parity in primary enrolment in the Sub Saharan Africa regions. It appears neither is the case as all the negative values of gender inequality in primary enrolment are only significant when augmenting the health capital and adding the control variables. Which implies that the augmented Solow model helps explain better when analysing the relationship between inequality in primary enrolment and GDP per capita.
5.3. Empirical Results using secondary enrolment as human capital and inequality variable
I will also be looking at gender inequality in secondary enrolment. In addition to doing this as a robustness check, it allows for the investigation of whether the disparity in secondary school enrolment is higher than the gap in primary enrolment. The empirical results related to gender inequality in secondary education is presented below (Table 5.4)
Table5.4: Regression result of the OLS of the annual data. The measure of gender inequality in education is based on the gender gap in secondary enrolment
(1) (2) (3) (4)
(0.0209) (0.0198) (0.0116) (0.0140) Capital 0.446*** 0.434*** 0.236*** 0.147*** (0.0522) (0.0498) (0.0425) (0.0389) Inequality Secondary 2.136*** 0.308* -0.623*** -0.0299** (0.180) (0.175) (0.162) (0.167) Secondary enrolment 0.910*** 0.300*** 0.287*** (0.0491) (0.0433) (0.0401) Health 0.721*** 0.551*** (0.0344) (0.0357)
Female labour force -0.611***
(0.0635) Trade 0.000177 (0.000554) Landlocked -0.128*** (0.0330) Oil exporters 0.577*** (0.0409) Constant 10.65*** 6.481*** 5.026*** 8.467*** (0.340) (0.442) (0.286) (0.321) F-statistics 336.47*** 243.05*** 103.56***
Year Effects YES YES YES YES
Observations 1,159 1,159 1,159 1,159
R-squared 0.627 0.717 0.841 0.891
Note: Both dependent and independent variables are in log form except, inequality in secondary enrolment and trade.
Robust Standard errors in parentheses *** p<0.01, ** p<0.05, * p<0.1
These results are qualitatively like those reported in the previous table (Table 5.2) where gender inequality is based on primary enrolment. As the coefficient of the gender inequality variable is negatively significant when augmenting both human capital and health capital. The OLS regression in Table 5.4 shows high R-squared value for the four regression outputs, indicating that the specified models can explain more than 62% of the variation in GDP. In the first and second regression labour, capital and secondary enrolment and inequality variable are all significant and positive. Still, when augmenting the health capital, it turns the inequality in the secondary enrolment coefficient negatively significant, which implies there exist a negative relationship with inequality in secondary enrolment and GDP per capita. The coefficient remains negative in the last regression. However, the secondary inequality coefficient appears to be larger than the primary inequality coefficient. For instance, a 1 percent increase in the level of inequality in primary enrolment decreases the level of GDP by 0.3% and a 1 percent increase in the level of inequality in secondary enrolment reduces the level of GDP by 0.6%. It is of essence to note that the data on primary enrolment tends to be more detailed than data on
secondary enrolment. As primary education was the focus of the United Nations Millennium Development Goals (achieve universal primary education).
The fixed effect result found in table 5.6 is presented below
Table 5.5: Regression result of Fixed effect of the annual data: The measure of gender inequality in education is based on the gender gap in secondary enrolment
(1) (2) (3) (4)
VARIABLES GDP GDP GDP GDP
(eq4.7) (eq4.8) (eq4.9) (eq4.10)
Labour 1.397* 1.410* 1.409* 1.565* (0.798) (0.808) (0.804) (0.864) Capital -0.00771 -0.0148 -0.0152 -0.0285 (0.0667) (0.0628) (0.0623) (0.0613) Inequality_secondary 0.282 0.135 -0.158 -0.0713 (0.484) (0.624) (0.619) (0.606) Secondary enrolment 0.133 0.116** 0.0862* (0.180) (0.177) (0.189) Health 0.0672* 0.0576* (0.0364) (0.0373)
Female labour force -0.697
(0.546)
Trade 0.000104
(0.000933)
Constant 2.113 1.424 1.216 1.876
(12.02) (11.64) (11.51) (11.02)
Year Fixed Effect YES YES YES YES
Observations 1,159 1,159 1,159 1,159
R-squared 0.707 0.710 0.713 0.717
Number of countries 40 40 40 40
Note: Both dependent and independent variables are in log form except, inequality in secondary enrolment and trade.
Robust Standard errors in parentheses *** p<0.01, ** p<0.05, * p<0.1
The table above shows that all through the regression output, labour is positively significant. The capital variable and the inequality variable show a negative coefficient, but it is not significant. Secondary enrolment depicts a significant positive result as expected as well as the health capital.
Notably, the coefficient of female labour participation is negatively significant in all estimations. This is interesting, since increase in labour participation is expected to have a positive relationship with GDP per capita, but this is not very surprising as mentioned earlier, the data on female labour participation could behave differently than expected due to the unrecorded activities of female labour activities in developing countries (Klasen
2002) 9. It could also be translated that there exists low productivity of the job occupations taken by the female cohorts. That is, as the female labour participation rises, the male labour participation which tends to be relatively large in higher productivity occupations falls, thus the negatively significant relationship to GDP per capita. This translates to the fact that female labour participation does not have a strong impact on GDP per capita. It can also be interpreted that gender inequality in education directly and indirectly limits women’s contribution to economic growth. This point to the presence of social, administrative barriers faced by women that prevents them from participating more directly informal economic activities (Baliamoune-Lutz and McGillivray (2015). However, an argument carried out by critics of female education points to the notion that due to cultural and religious aspects in where women are to be diversified from men (Dollar and Gatti) or when there is loss in a girl investment since they are married away (Schultz 2002), this makes investments in male education to generate a higher returns than females.
The result also gives some interesting perception into the relative importance of education equality has on the GDP per capita. It can be translated that the GDP per capita of the Sub-Saharan Africa countries as suggested here, to a considerable extent linked to the role played by women in the society. The cost of gender gaps towards girls in education not only harm the girls concerned but also impose a cost for the economy.
In summary, the results reported in table 5.2 to 5.5 shows strong statistical evidence that when augmenting the Solow growth model with health and human capital improves the fit of the model. Also, it yields strong evidence that gender inequality in both primary and secondary enrolment has a statistical and negative effect on the level of economic growth. The growth equation variables that are significant have the expected signs as previous works of literature. Generally, it is expected that human capital has a positive significant relationship with GDP per capita as according to the Solow growth theory, countries with high levels of human capital perform better in their levels of economic growth (Solow 1956 Romer 1986)
9 Baliamoune-Lutz and McGillivray (2015) found the coefficent of the share of women in labour force to
be stastistcially insignificant in all estimations and pointed out to SSA countries having large share of female labour force that are mostly in the argricutkural sector, which translates to low productiviy of the labour force
6. Conclusion
In this study, I have examined the impact of gender inequality in education will have on economic growth in sub-Saharan African countries. I performed panel data estimation using data from 40 Sub Saharan African countries, two indicators of gender inequality were used, which include: the disparity in primary and secondary enrolment. The result of the OLS and Fixed effect within-group estimators was presented in the previous chapter. Based on the empirical result, I conclude that there exists a negative interaction between gender inequality in both primary and secondary enrolment and the level of economic growth. However, the effect is greater in primary enrolment as oppose secondary enrolment. The findings in this paper are qualitatively in line with previous empirical works of literature (Klasen 2002, Klasen and Lamanna 2003, Baliamoune-Lutz and McGillivray 2015). I have also shown that the incorporation of human capital and health capital measure can better explain the variation in the level of GDP per capita. In conclusion, it is given that gender inequality has a negative effect on economic growth, and it is believed that cultural norms and other factors encourage gender inequality (Subrahmanian 2002). Suggestion for further studies is to add lag on GDP and add fertility variable to see how the inequality in education affects this variable in relations to economic growth in the long run. One could also investigate whether different literacy levels as a proxy for inequality in education have different effects on economic growth.