What determines the amount of reported
goodwill impairment?
- An investigation of Nasdaq Stockholm OMX (OMXS)
MASTER’S THESIS WITHIN BUSINESS ADMINISTRATION THESIS WITHIN: Accounting
NUMBER OF CREDITS: 30 ECTS
PROGRAMME OF STUDY: Civilekonomprogrammet AUTHORS: Gusten Friberg & Carl Åström Johansson JÖNKÖPING May 2018
Acknowledgements
First, we would considerably like to thank our tutor Argyris Argyrou for providing us with pragmatic and functional insights during the writing process. His knowledge has helped us to
use our academic abilities for the best possible outcome of our thesis.
Secondly, we would like to thank Toni Duras for advising us with statistical insights and lastly, thank Oskar Eng and Annika Yström for brainstorming ideas and giving us mental
motivation during periods of uncertainty.
________________________________ ________________________________
Carl Åström Johansson Gusten Friberg
JÖNKÖPING, SWEDEN, 21st of May 2018
MASTER’S THESIS WITHIN BUSINESS ADMINISTRATION, ACCOUNTING
TITLE: What determines the amount of reported goodwill impairment?
- An investigation of Nasdaq Stockholm OMX (OMXS)
AUTHORS: Gusten Friberg & Carl Åström Johansson
TUTOR: Argyris Argyrou
DATE AND PLACE: 21st of May, Jönköping
KEY TERMS: Goodwill Impairment, IFRS 3, IAS 36, Economic Impairment,
Earnings Management, Corporate Governance, Big Bath, Income Smoothing, Gender Diversity
Abstract
Background: The question on how to account for goodwill has long been a subject that causes
big debates among actors within financial accounting. In 2004, the IASB released a new standard, IFRS 3 – Business Combinations, that changed the accounting for goodwill. The interpretation for goodwill impairments according to IAS 36 has led to findings in studies that show patterns of earnings management and that a possible gap exists between the standard setter’s basic aim of IAS 36 and what actually is done by the practitioners.
Purpose: Examine what determines the amount of reported goodwill impairment for firms
listed on the Nasdaq OMX Stockholm (OMXS).
Method: To fulfil the purpose of the thesis, the authors takes a quantitative research approach
by a using a multiple linear regression model. The regression model is based on proxies for economic impairment, earnings management and corporate governance mechanisms from previous literature (Stenheim & Madsen, 2016; AbuGhazaleh, Al-Hares, & Roberts, 2011; Riedl, 2004). The data used for the regression model has been collected from published annual reports of 69 firms listed on the Nasdaq Stockholm OMX (OMXS), between the years 2007-2016.
Conclusion: The findings of the thesis show that the accounting behaviour of “Big Bath” is
exercised for firms listed on the Nasdaq Stockholm OMX (OMXS). The proxies for economic impairment have, to some extent, an impact on the amount of reported goodwill impairment, but the majority of the proxies for corporate governance mechanisms does not affect the amount of reported goodwill impairment. These findings might suggest that the standard IAS 36, which regulates the accounting for goodwill, may not entirely fulfil its purpose of creating a more transparent financial reporting.
Acronyms
EBITDA Earnings before interest, tax, depreciation and amortization
EU European Union
FAR Föreningen Auktoriserade Revisorer
(Association of Authorized Auditors)
FASB US Financial Accounting Standard Board
IASB International Accounting Standard Board
IFRS International Financial Reporting Standards
NED Non-executive director
OCF Operating cash-flow
OMXS Nasdaq Stockholm OMX
ROA Return on assets
TA Total assets
Clarification
Large Cap OMX Stockholm Large Capitalization
Mid Cap OMX Stockholm Medium Capitalization
Small Cap OMX Stockholm Small Capitalization
SPSS IBM SPSS Software (Statistical Analysis Software)
Table of contents
Acronyms ... 4
Clarification ... 4
1. Introduction ... 1
1.1 Identified research gap ... 2
1.2 Purpose ... 3
1.3 Delimitations ... 3
2. Literature review ... 5
2.1 Goodwill ... 5
2.2 Goodwill impairment ... 6
2.3 Financial Accounting Regulations ... 7
2.4 Economic Impairment ... 8
2.5 Earnings Management ... 9
2.5.1 “Big Bath” and “Income Smoothing” ... 10
2.5.2 Agency Theory ... 11
2.5.3 Stewardship Theory ... 11
2.6 Corporate Governance Mechanisms ... 12
2.6.1 Gender Diversity ... 13 3. Hypotheses ... 16 4. Methodology ... 18 4.1 Research approach ... 18 4.2 Research process ... 18 4.3 Data collection ... 19 4.3.1 Sample ... 20 4.4 Variables ... 22 4.4.1 Dependent ... 24 4.4.2 Independent ... 24
4.5 Regression model ... 27
4.6 Research quality - Reliability & Validity ... 27
5. Empirical results ... 29
5.1 Descriptive statistics ... 29
5.2 Multiple regression analysis ... 31
6. Analysis ... 34 6.1 Discussion ... 34 6.1.1 Control variable ... 38 7. Conclusion ... 40 8. Discussion ... 42 8.1 Contribution ... 42 8.2 Limitations ... 42
8.3 Ethical and social issues ... 43
8.4 Suggestions for further research ... 44
Bibliography ... 45
Appendix ... 55
Appendix 1 Regression analysis – year-dummies ... 55
Table 1 Exclusion of observations ...20
Table 2 Exclusion of firms ...21
Table 3 Variables used in the regression model ...23
Table 4 Year frequency of reported goodwill impairments...29
Table 5 Descriptive statistics ...30
Table 6 Regression analysis ...32
1
1. Introduction
In this chapter, the authors first introduce the topic of goodwill accounting.The authors then present the identified research gap, the purpose and delimitations of the thesis.
The question on how to account for goodwill has long been a subject that causes big debates among all actors within financial accounting. Academics, standard setters and practitioners have all faced problematic situations, when trying to develop a method for goodwill accounting where theories are in line with the actual practice (Hughes, 1982).
Goodwill will be recognized, as an intangible asset, when an entity acquires another entity or part of it (IFRS 3). The valuation of the goodwill is made by the acquiring firm, which makes goodwill an asset that is specifically created from the firm’s own value estimations. Therefore, goodwill cannot be sold or purchased as a separate item (IFRS 3; Hoggett & Edwards, 2000), which makes it hard to distinguish and actually pinpoint what exactly creates this added value of the goodwill (Holthausen & Watts, 2001).
The International Accounting Standard Board issued a new accounting standard, IFRS 3 - Business Combinations, to solve and eliminate the use of the accounting method called pooling of interest, which was heavily criticized under the previous standard at that time, IAS 22. IFRS 3 also changed the amortization system that was previously used under IAS 22. IFRS 3 stated new rules that goodwill should be tested for impairment at the end of each financial year (IFRS 3). Goodwill impairment testing is not a straightforward process as it requires a comprehensive knowledge on the acquisition method of accounting for business combinations (Seetharaman, Sreenivasan, Sudha, & Tey, 2006; IFRS 3).
According to the standard IAS 36 - Impairment of Assets, the firm has to use their own knowledge and ability to recognize a value reduction of the goodwill (IAS 36). Several studies have shown patterns of earnings management among firms because of the different interpretations of the standard for goodwill impairment (AbuGhazaleh, Al-Hares, & Roberts, 2011; Stenheim & Madsen, 2016; Riedl, 2004; IAS 36). Managers have the possibility to influence the financial outcome of the year which has caused the most common critique of IFRS
2 3 that highlights the complicated way of testing for goodwill impairment (AbuGhazaleh, Al-Hares, & Roberts, 2011).
AbuGhazaleh, Al-Hares, & Roberts (2011) and Stenheim & Madsen (2016) have examined the size and occurrence of goodwill impairments. AbuGhazaleh, Al-Hares, & Roberts (2011) found evidence that managers used discretionary actions when impairing for goodwill, especially in connection with newly appointed CEOs, “Big Bath”, and “Income Smoothing” behaviours. Stenheim & Madsen (2016) found evidence that showed on a connection between economic impairment and reported goodwill impairment but on the other hand, the authors also found a relation between reported goodwill impairment and incentives for earnings management through the accounting behaviour of “Big Bath” (Stenheim & Madsen, 2016).
There are more factors than just earnings management that can affect the decision of goodwill impairment. Corporate governance mechanisms have been seen to impact the behaviour and performance of a firm in a positive way (Huson, Parrino, & Starks, 2001), by reducing conflicts of interest between owners and managers (Shleifer & Vishny, 1997). The mechanisms do, for example, consist of the characteristics and composition of the board. Obert, Suppiah, Zororo, & Desderio (2015) studied the impact of gender diversity within firms’ board of directors and found that the more number of women on the board, the less scandals and more contribution to a carrying and social responsible acting. Women engage more in the actual decisions, by attending more meetings and by collecting more information before decisions (Adams & Ferreira, 2009). There has also, indirectly, been a positive relation between women on the board and the financial performance of firms (Isidro & Sobral, 2015). Additionally, the European Commission have taken action in the question on gender diversity within non-executive boards for firms, and a proposal to a directive stating a 40 percent involvement for the underrepresented gender by year 2020 has been presented (European Commission, 2012). In Sweden, females are the underrepresented gender in the corporate boards for firms listed on Nasdaq Stockholm OMX (OMXS) (SCB, 2017).
1.1 Identified research gap
Several studies have been made within the topic of determinants for reported goodwill impairment for firms reporting under the International Accounting Standard Board’s regulation (AbuGhazaleh, Al-Hares, & Roberts, 2011; Stenheim & Madsen, 2016; Saastamoinen &
3 Pajunen, 2016). AbuGhazaleh, Al-Hares, & Roberts (2011) and Stenheim & Madsen (2016) examined determinants of reported goodwill impairments for firms listed on the London Stock Exchange while Saastamoinen & Pajunen (2016) examined determinants for firms listed on the Nasdaq OMX Helsinki (OMXH). No studies can be found that have examined determinants for the amount of reported goodwill impairment for firms listed on the Nasdaq Stockholm OMX (OMXS), reporting under the IASB’s regulations. Consequently, the research contributes to the topic of goodwill and what determines the amount for reported goodwill impairment.
1.2 Purpose
The purpose of this thesis is to examine what determines the amount of reported goodwill impairment for firms listed on the Nasdaq OMX Stockholm (OMXS). In order to do so, this thesis uses proxies from previous studies (AbuGhazaleh, Al-Hares, & Roberts, 2011; Stenheim & Madsen, 2016; Riedl, 2004) as determinants for economic impairment, earnings management and corporate governance mechanisms, and in addition, the impact of female board representation by considering the gender diversity of the board, based on the European Commission's proposed legislation for gender equality (European Commission, 2012). The research contributes to the topic of goodwill and what determines the amount of reported goodwill impairment.
1.3 Delimitations
The thesis will be based on firms listed on the Nasdaq OMX Stockholm (OMXS), on the 31st
of December 2017. The listed firms at this particular time, are studied between the years 2007-2016. The thesis does not cover firms that do not have goodwill in their balance sheets and firms that have goodwill in their balance sheet but have not reported any goodwill impairment. Furthermore, this thesis does not cover firms with a broken fiscal year, firms reporting in another currency than the Swedish Krona (SEK) and firms within the financial industry (FTSE International Limited, 2012).
A regression analysis will be used to examine what determines the amount of reported goodwill impairment, and to do so, data will be collected for proxies of economic impairment, earnings management and corporate governance mechanisms. This examination will be done by stating hypotheses based on previous literature within the topic of goodwill impairment. From the
4 result of the regression analysis, the hypotheses will either be rejected or not rejected. The data collection will be done using the databases Thomson Reuters Eikon Datastream, Retriever Business and the published annual reports of the firms.
5
2. Literature review
In this chapter, the authors first introduce the topic of goodwill accounting, followed by a collection of previous studies, theories and concepts on the topic of goodwill impairment,
earnings management and corporate governance mechanisms.
2.1 Goodwill
Goodwill is calculated by adding up the value of the consideration transferred, the amount of non-controlling interest and the fair value of previous equity interest. This value is then subtracted with the net amount of the assets acquired and liabilities assumed at the acquisition date and is created as an asset (IFRS 3). Cañibano, García-Ayuso, & Sánchez (2000) argued that goodwill should be seen equal to the tangible assets with expected future value, but that the value is created by intangible investments like new technology, advertising and human resources. The variety of intangible factors that are said to be part of goodwill result in an asset that is very specific for each and one of the firms and will consequently be affected when a firm experiences financial distress (Holthausen & Watts, 2001).
Goodwill could be defined as the difference between the market value of a firm and the sum of the fair value of the firm’s individual assets, i.e. the realised value the firm would gain by selling them of individually. Goodwill is created for a firm when gaining value from the synergies of the assets that the firm has, i.e. using a portfolio of assets in the most optimal way (Feltham & Ohlson, 1995; Scott, 2009; Storå, 2013).
The different ways of defining goodwill has also been seen to influence the international standard setter’s work and consequently, a possible gap exist between the regulation in IFRS 3 and what actually is done by the practitioners (Detzen & Zülch, 2012). This gap could be explained by the standard setter’s attempt to combine both a top-down and bottom-up perspective (Brännström & Giuliani, 2011). The top-down perspective defines goodwill as future earnings that the acquiring firm expect to gain due to the acquisition (Johnson & Petrone, 1998). Goodwill is, in the top-down perspective, a group of assets that the acquiring company cannot fully value or define (Brännström & Giuliani, 2011). In the bottom-up perspective, goodwill is instead seen as an asset that was not in the balance sheet of the acquired firm, and therefore, the asset could be called “hidden assets” (Colley & Volkan, 1988).
6
2.2 Goodwill impairment
IFRS 3 changed the accounting for goodwill from amortization to annual impairment tests. Some experts claimed that the re-establishment and adoption of amortization would more validly reflect the economic benefits acquired in a business combination for a more truthful measurement. (European Financial Report Advisory Group, 2014; KPMG, 2014). Additionally, the impairment test, compared to the annual amortization, is costly and complicated and since the standard requires an extensive assessment in its interpretation, it creates a risk of false and inaccurate measurements of the goodwill (European Financial Report Advisory Group, 2014; International Financial Reporting Standards, 2014a, January; International Financial Reporting Standards, 2014b, September; International Financial Reporting Standards, 2014c, December).
The annual impairment test was perceived to create a more transparent base for the accounting for goodwill, as managers would be able to provide users with better information on future earnings, cash-flows and growth in the financial statements (European Financial Report Advisory Group, 2014). Managers may use their discretionary position in impairment testing to convey private information to the investors in order for them to better make assumptions on future economic events (Schatt, Doukakis, Bessiux-Ollier, & Walliser, 2016). Managers may also use their discretionary position to exercise earnings management, that creates an environment in which the information on goodwill impairment is irrelevant to the investors (Watts, 2006). To counteract this, detailed information on the goodwill impairment ought to be provided, i.e. valid explanations on the impairment decision will be better received from investors (Knauer & Wöhrmann, 2016). Johansen & Plenborg (2013) showed that investors were most interested in the notes relating to IFRS 3 and IAS 36. Additionally, the investors were not satisfied with this particular information provided in these notes, i.e. information on how the impairment test had been done, as investors did not fully comprehend the complex valuation. Johansen & Plenborgs’ (2013) study can be explained by the findings of Dye (2001) and Verrecchia (2001), that managers, to some extent, does not want to provide additional information on economic events that may come to hurt the firm financially, e.g. when competitors can take use of this information (Mazzi, Andre, Dionysiou, & Tsalavoutas, 2017).
7 Hirschey & Richardson (2003), Bens & Heltzer (2005), Li & Meeks (2006), showed that the impairment of goodwill had a negative effect on the stock price in a short-term perspective, which could be explained by the absence of additional information with regards to the impairment losses of goodwill and the willingness by the investors to have this information (Johansen & Plenborg, 2013). Cheng, Peterson, & Sherrill (2015) found that the impairment of goodwill resulted in negative stock price reactions by the market and at the same time, the authors found that the impairment of goodwill has positive impact on the stock price in a long-term perspective, as stakeholders recognize that an impairment of goodwill, that occurs from an earlier acquisition, as a positive event (Cheng, Peterson, & Sherrill, 2015).
The recognition of impairment is a crucial accounting mechanism in financial reports (Amiraslani, G., & Pope, 2013; André, Filip, & Paugam, 2015; Roychowdhury & Martin, 2013), however, an untimely recognition of goodwill impairments has been shown to take place in the US-market, which challenges this accounting mechanism (Li & Sloan, 2017; Filip, Jeanjean, & Paugam, 2015; Ramanna & Watts, 2012; Hayn & Hughes, 2006). Furthermore, André, Filip & Paugam (2015) also found evidence in European firms for this untimely recognition. This is of importance, as economic impairment should be faithfully reflected in a corresponding impairment loss (Ramanna & Watts, 2009; Riedl, 2004; Francis, Hanna, & Vincent, 1996).
2.3 Financial Accounting Regulations
The latest edition of IFRS 3 was issued in 2008 and was an improvement and joint project between the US Financial Accounting Standard Board (FASB) and the International Accounting Standard Board (IASB) (IFRS 3; Deloitte Global Services Limited, u.d.). IFRS 3 defines a business combination as realized when an acquirer obtains control over one or more businesses through transactions or other events (IFRS 3; FAR AB, u.d.). The big difference between IAS 22 and IFRS 3 was how the accounting for goodwill should be done. According to IAS 22, goodwill that occurred when businesses where combined should be amortized on a yearly regular basis (IFRS 3). According to IFRS 3, goodwill should now instead be tested for impairment on annual basis. This resulted in the creation of goodwill as an asset that can be held in the balance sheet indefinitely (IFRS 3; Sherill, 2016). The change from amortization-and-impairment system to an only-impairment system resulted in an increase of goodwill
8 balances reported and a case study made on the Swedish market, showed a 50 percent increase of goodwill balances reported post-IFRS 3 (Hamberg, Paananen, & Novak, 2012).
IAS 36 - Impairment of assets (IAS 36), stipulates that goodwill should be annually tested for impairment. The objective behind IAS 36 aims to secure that a firm's assets are not carried at an amount that exceed the recoverable amount of the asset (IAS 36). The recoverable amount is the highest of the value in use, and fair value less costs of disposal (IAS 36). IAS 36 states that an asset shall be tested for impairment if the firm recognizes indicators of a reduction in the value of the asset. One indication of this reduction is if the recoverable amount for the cash generating unit(s), that the goodwill has been allocated to, is less than the carrying amount of the unit(s). When allocating the goodwill to the cash-generating units, the smallest group of assets that are able to generate cash flows from ongoing use and that has a cash-flow that is separated from other groups or assets, is recognized (IAS 36). If so, an impairment should be recognized with an amount the size as the difference between the recoverable and carrying amount. The firm cannot recognize an impairment and reduce the carrying amount of the goodwill below the highest of: (1) if measurable, the asset’s fair value less costs of disposal (2) if determinable, the asset’s value in use and (3) zero (IAS 36). The standard imposes further restrictions specifically for goodwill, which requires the asset to be tested for impairment at least annually, and once recognized, the impairment cannot be reversed (IAS 36).
2.4 Economic Impairment
Literature on the goodwill impairment topic has examined a number of variables that might reflect economic impairment, e.g. a decrease in the operating cash flow between years (Stenheim & Madsen, 2016; Francis, Hanna, & Vincent, 1996; Segal, 2003; Riedl, 2004; AbuGhazaleh, Al-Hares, & Roberts, 2011). An accurate economic impairment of goodwill cannot be observed since no separate market to determine the actual and current value of goodwill exist. As a result, existing literature has used a number of proxies to investigate the undetectable goodwill impairment determinants. The faithfulness of goodwill impairments can then be discriminated by examining the validity of these proxies for economic impairment (Stenheim & Madsen, 2016).
Proxies have previously been studied on three aggregation levels: macroeconomic-, industry- and firm level, by looking at variables linked to impairment losses. On a macroeconomic level, an economic recession can be shown through increases in unemployment rates. A recession
9 will negatively affect firm performance and hence cause goodwill impairments to be reported more often (Francis, Hanna, & Vincent, 1996; Segal, 2003; Riedl, 2004). Dah (2016) found evidence that during times of recession, there is a greater rise in agency problems1, with managers exploiting their position for private gains, which in turn will negatively affect the already possible poor performance of the firm. Firm performance is also dependent on the industry it operates within, and negative financial performance for the industry as a whole will consequently affect the individual firm negatively. This will consequently result in a greater likelihood of impairment losses (Francis, Hanna, & Vincent, 1996; Segal, 2003; Riedl, 2004). On a firm level, previous literature has examined different metrics to explain the economic impairment for firms, by examining performance and asset values (Stenheim & Madsen, 2016; AbuGhazaleh, Al-Hares, & Roberts, 2011; Riedl, 2004). Poor prior performance has been seen to have a great impact on the amount of reported goodwill impairment (Francis, Hanna, & Vincent, 1996; Zang, 2008).
2.5 Earnings Management
The term earnings management is used to describe the accounting process, in which managers exploit their position for private gain, by manipulating reported earnings in an attempt to reach a desirable level of earnings. This is often to the concern of investors and stakeholders and regarded as a signal that managers are acting opportunistically, when for example, trying to smooth earnings of a financial report by taking discretionary actions. The term now also includes and describes almost all forms of earnings manipulation, not just from a managerial point of view. Practices such as “revolving doors”, i.e. when a firm hires an executive or controller from their current audit firm, the use of managers discretion to secure a lending agreement, or to window dress financial statements before initial public offerings. The literature on earnings management has mostly investigated the occurrence and importance on unexpected accruals, but recently, the focus has shifted more to studies on when the manipulation and distribution of reported earnings result in significant changes in the income statement. (Nisar, 2009)
Field, Lys, & Vincent (2001) present three specific conditions that creates a rational reporting strategy for earnings management in a firm, that may occur if and when:
10 1. There is an information asymmetry between stakeholders and the managers,
2. There is an interest conflict between the managers and stakeholders, and 3. Managers have a greater freedom of accounting choices.
If these three conditions are applicable, managers may gain benefits by engaging in some form of earnings management (Field, Lys, & Vincent, 2001). The new legislations on how to account for goodwill may open for earnings management behaviours (Masters-Stout, Costigan, & Lovata, 2008), as the regulation do not pinpoint any clear valuation of goodwill, as it is specific to each firm and the valuation is based on managers assumptions (IAS 36). Previous studies on the subject of goodwill impairments has showed evidence of earnings management and situations when these impairment losses will not be recognized by the management (Beatty & Weber, 2006; Masters-Stout, Costigan, & Lovata, 2008; Zang, 2008; Ramanna & Watts, 2009; AbuGhazaleh, Al-Hares, & Roberts, 2011; Hamberg, Paananen, & Novak, 2012; Saastamoinen & Pajunen, 2016; Silvola, Huikku, & Mouritsen, 2010).
2.5.1 “Big Bath” and “Income Smoothing”
Hayn & Hughes (2006) showed in their study that managers take advantage of their discretion to time the impairment in order to fulfil specific reporting targets, and by overstating impairment losses (Francis, Hanna, & Vincent, 1996; Rees, Gill, & Gore, 1996; Riedl, 2004; Zucca & Campbell, 1992). Zucca & Campbell (1992) showed that asset write-offs can especially be seen in times when expected earnings have not been met pre-impairment. By taking a “Big Bath”, managers have the possibility to improve future earnings, giving the impression to stakeholders that the “crisis” are past the firm (Zucca & Campbell, 1992; Alciatore, Dee, Eastion, & Spear, 1998) The practice of “Big Bath” may only influence the impairment amount (Saastamoinen & Pajunen, 2016), and the decision to report impairment losses can often be connected to compensation difficulties (Beatty & Weber, 2006; Watts, 2006), which is one of the main parts of the agency theory connected to incentives for managers (Bednar, 2016).
When pre-impairment earnings are higher than expected, the reporting strategy “Income Smoothing”, occurs more frequently, as a way to reach expected levels of earnings. Copeland (1968:101) explains that the accounting strategy of “smoothing”: “...moderates year-to-year
fluctuations in income by shifting earnings from peak years to less successful periods”, in order
11 a model by Kirshenheiter & Melumad (2002), who showed them as components of a “equilibrium reporting strategy”. “Income Smoothing” behaviour has been shown to occur in connection with goodwill impairments, but the behaviour can be diminished through effective corporate governance mechanisms (AbuGhazaleh, Al-Hares & Roberts, 2011), as employees of an organization would provide work in the best interest for the objectives of the organization and its shareholders, acting as “stewards”, which can confirm the basic assumption of the Stewardship theory2 (Neubaum, 2013).
2.5.2 Agency Theory
The agency theory, try to explain the problem that arises in the situation when a principal hires an agent to act in the principal's interests (Bednar, 2016). The agency theory can be recognized in all different kind of situations and is not only applicable in the business world. In firms, the agency theory can be shown through a separation between ownership (shareholders) and control (managers). The shareholders, that are the owners of the publicly traded firm, hires the managers (agents) to run the business and in an indirect point of view, create a return on the investments that the shareholders have put in. The problem that arises is how the shareholders should find incentives to make the managers act in the interest of the shareholders (Bednar, 2016). The reason for the managers to not act in the interest of the shareholders is based on the information asymmetry that can occur between the managers and the shareholders (Zhang, 2012). This asymmetric information is created because of the involvement and difference in the daily running of the business. The manager is the first actor to receive the most recent information, in the guidance for decision making, and the shareholders will eventually get this information when the manager chooses to pass it forward to them. The manager (agent) has the opportunity to control what kind and amount of information the stakeholders (principals) receives and therefore, the managers can act in their own interest instead of the stakeholders (Zhang, 2012).
2.5.3 Stewardship Theory
The Stewardship theory tries to explain the situation where employees of an organization has the intention to provide work in the best interest for the organization’s objective and its shareholders. In comparison with the agency theory, organizational agents will instead serve as
12 “stewards”, with purposes beyond their own best interest, as they adopt and exercise an attitude for a more unified performance and result. “Stewards” will act in line with organizational behaviour to optimize their intrinsic benefits, but not by disregarding what is best for the organization, but rather trying to enhance the outcome for others, rather than for themselves (Neubaum, 2013).
The motivations for stewards acting for a collectivistic outcome, instead on the individualistic behaviour that arises in the agency theory, has its basis from the individual's own psychological mind-set and, likewise, the organizational approach to strengthen the stewardship structure. The organization can moderate the accepted power distance levels, the level of employee involvement and define and elevate the collectivistic spirit for employees. By encouraging employees to develop their own abilities and obtain personal growth, stewards will actively work to contribute to the firm as a whole and identify and act in accordance with the organizational mission and objectives (Neubaum, 2013).
2.6 Corporate Governance Mechanisms
Corporate governance has become a well discussed topic in modern firms because of the increased separation of ownership and control within firms (Chalevas & Tzovas, 2010). Corporate governance is defined as the mix of procedures, rules, practices and policies that a firm’s executives and the firm’s board of directors devote to fulfil their duties set by the shareholders (Luhman & Cunliffe, 2013). Corporate governance is not only of importance for the practice of the shareholders, but also for all the stakeholders of the firm. A stakeholder could be, for example, the employees, other firms and/or the community that a firm is active within. Corporate governance is of importance as it helps to balance the different interests, responsibilities and rights that the firm has against its’ stakeholders, but also the interests, responsibilities and rights that the stakeholder has against the firm. (Chaudhri, 2016)
There is no so called “best model” for how to construct the corporate governance mechanisms, but still, there has been evidence that a firm’s performance can increase by actively working with these mechanisms (Perry & Shivdasani, 2005). The basic assumption on what should be resolved with corporate governance mechanisms is that it should help to improve the agency problem that arises in a firm, and additionally, create confidence for the stakeholders due to better behaviour practiced by the management (Chaudhri, 2016).
13 In year 1992, The Cadbury Report was published and was among the first official guidelines for firms to act in line with corporate governance mechanisms (University of Cambridge, u.d.). This publication has also been seen as the starting point for the research that has been done in the field of corporate governance, with a large part of the research focusing on how corporate governance will impact the financial accounting reporting. Karamanou & Vafeas (2005) found evidence that the corporate governance mechanisms impact the disclosure quality of the reports and that stronger corporate governance mechanisms lead to better and more valid accounting of the annual reports. Other studies also focused on the reason behind this improvement of the financial reports. The findings indicate that the characteristics of the board, such as more board activity and more independent non-executive board members has a negative effect on earnings management and a positive effect on the quality of the financial reporting (Lipton & Lorsch, 1992; Yermack, 1996; Chtourou, Bedard, & Courteau, 2001; Xie, Davidson, & DaDalt, 2003; Farber, 2005; Vafeas, 2005; Peasnell, Pope, & Young, 2005; Davidson, Goodwinn-Stewart, & Kent, 2005; Ebrahim, 2007; Koh, LaPlante, & Tong, 2007) . At the same time, Verriest & Gaeremynck (2009) and AbuGhazaleh, Al-Hares, & Roberts (2011) found that the level of corporate governance mechanisms in a firm influence the accounting for goodwill impairment. An increased level of strong and functional corporate governance mechanisms results in a greater frequency of impairments. This may be explained by the forcing effect of the mechanisms to reflect a more accurate picture of the firm to improve the firm value (Verriest & Gaeremynck, 2009).
2.6.1 Gender Diversity
Another corporate governance mechanism that can affect the reported goodwill impairment is the gender diversity of the board of directors. In November 2012, the European Commission decided to take actions in the question on gender diversity within non-executive boards for firms registered in the member states. This was strongly supported by the European Parliament and resulted in a proposal to a directive that states a quantitative objective of 40 percent should count for the underrepresented gender by year 2020 (European Commission, 2012). To secure that merit and qualifications remains in focus, the firms that do not reach the 40 percent allocation has to argue and present information on why this is not the case (Jourová, 2016). Spain, France and Finland, has already implemented gender quotas in their national law (Bianco, Ciavarella, & Signoretti, 2015), in contrast to Sweden, that has no present stated
14 regulation about gender diversity. However, the Swedish Corporate Governance Code recommends a gender equality as far as possible (Swedish Corporate Governance Board, 2016). The underrepresented gender in Swedish corporate boards for firm listed on OMXS was in November 2017, women, which represented 32 percent of total board members (SCB, 2017).
The topic of gender equality has emerged in the study field for businesses and the impact of increased women involvement in the top management systems within a firm has been discussed (Bilimoria, 2000; Dezsö & Ross, 2012; Terjesen, Sealy, & Singh, 2009). Some studies show differences in the way women and men are acting as leaders in businesses. Schuh, o.a. (2014) argued that women are often less power-hungry then men in the same positions within firms, which can be explained by the observed reduced power-orientation behaviour that women have (Adams & Funk, 2012). These differences will also have impact on how decisions are made and if actions are in line with the self-interest of the manager or not and when serving as a gender minority on the board, women are able to make a greater contribution to the decision-making (Kanadlı, Torchia, & Gabaldon, 2018).
When taking place in a board, women are more involved in the work and are attending more meetings of the board then their male colleagues that will result in greater alignment with the interest of the shareholders by overriding the board member’s own interest (R.B. Adams, D. Ferreira, 2009). The problem connected to the agency theory could be reduced if this happens (Carter, Simkins, & Simpson, 2003). In 2005, Ryan & Haslam (2005b) found evidence that firms more often choose to elect women as CEOs or board members when they are facing bad financial performance. The findings questioned Judges (2003) earlier arguments that boards with only male members were the ones who performed best. An increased number of women on the board was not the cause of the bad performance, but a bad performance was rather a trigger for appointing women (Ryan & Haslam, 2005b).
When selected as a board member, women are exposed for a higher level of valuing and testing, to see if they really are the best candidate for the position (Bygren & Gähler, 2012), and is considered as gender discrimination (Gregory-Smith, Main, & O'Reilly, 2014). When selecting a woman for the board, the woman on the board are classified as independent against the firm (Adams & Ferreira, 2009). The influence of the independency leads to better performance of the firm, especially with focus on productivity (Joy, Carter, Wagener, & Narayanan, 2007; McKinsey & Co, 2007; Mckinsey & Co, 2008; McKinsey & Co, 2010; Wilson & Altanlar,
15 2009; Rohner & Dougan, 2012). There are studies that has showed the opposite effect of the gender impact on a firm’s performance. Gregory, Jeanes, Tharyan, & Tonks (2013) and Shamil, Shaikh, Ho, & Krishnan (2014) argues that the market reaction and the performance of a firm depends on so much more variables than just the gender diversity of the board. There can be times during the measuring period that are biased for female directors and correcting itself when adding more variables. Ahern & Dittmar (2012) made a study looking into the effects of the stated law in Norway, that requires gender diversity level of at least 40 percent in corporate boards and found that the regulation had the opposite effect and resulted in negative impact on the valuation of the firms.
16
3. Hypotheses
In this chapter, the authors present the hypotheses used in the thesis. First, a small background for the assumptions of the hypothesis is presented by the authors, followed by the
stated hypothesis.
This thesis will use empirical proxies to examine the economic impairment of goodwill. The proxies used are: change in return on assets, change in operating cash flow and pre-impairment book-to-market value. The assumption about using proxies is in line with previous studies (Francis, Lennox, & Wang, 2010; Riedl, 2004; Beatty & Weber, 2006; Lapointe-Antunes, Cormier, & Magnan, 2008; Zang, 2008; Stenheim & Madsen, 2016; AbuGhazaleh, Al-Hares, & Roberts, 2011). The above discussion leads to the following hypothesis:
H1: Firms that experience a negative change in financial performance are more likely to
report a higher amount of goodwill impairment.
To “take a bath”, i.e. the accounting practice “Big Bath”, can take place when the result of the period is worse than expected. An even worse result will be reported for the period by recognizing impairments that are abnormally high. With this, the managers postpone the indirect income to the future periods, often the two following years (Kirshenheiter & Melumad, 2002). The above discussion leads to the following hypothesis:
H2a: Firms that experience an abnormally high negative change in pre-impairment earnings
are more likely to report a higher amount of goodwill impairment.
During “good times” of firm performance, earnings management can be seen in the shape of “Income Smoothing”. When management are facing higher pre-impairment earnings than expected, they can use write-offs to end up with reported earnings that will be closer to the expected financial goals for the period and therefore show on good managerial practices of the firm (Zucca & Campbell, 1992; Kirshenheiter & Melumad, 2002). The above discussion leads to the following hypothesis:
H2b: Firms that experience an abnormally high positive change in pre-impairment earnings
17 Firms with strong or more efficient corporate governance mechanisms have been found to reduce financial fraud and create a more correct and fair financial accounting of the firm (Peasnell, Pope, & Young, 2005; Davidson, Goodwinn-Stewart, & Kent, 2005; Mulgrew & Forker, 2006; Ebrahim, 2007; Koh, LaPlante, & Tong, 2007). When looking at corporate governance mechanisms that has been seen to affect the financial reporting within firms more, the number of independent members of the board and the level of board activity are both vital indicators (Verriest & Gaeremynck, 2009; Farber, 2005; Vafeas, 2005; Peasnell, Pope, & Young, 2005; Davidson, Goodwinn-Stewart, & Kent, 2005; Ebrahim, 2007; Koh, LaPlante, & Tong, 2007). Additionally, the gender diversity of the board has been seen to impact the accounting actions and the quality of financial reporting. An increased level of women on the board leads to better financial reporting (Joy, Carter, Wagener, & Narayanan, 2007; McKinsey & Co, 2007; McKinsey & Co, 2010; Mckinsey & Co, 2008; Wilson & Altanlar, 2009; Rohner & Dougan, 2012). The above discussion leads to the following hypothesis:
H3: Firms with strong corporate governance mechanisms are more likely to report a higher
18
4. Methodology
In this chapter, the authors first introduce the research approach and research process used in the thesis. After this, the variables used in the thesis are presented by the authors, followed
by the data collection. Last, the regression model and the research quality are presented by the authors.
4.1 Research approach
To meet the purpose of this research, existing theory (AbuGhazaleh, Al-Hares, & Roberts, 2011; Stenheim & Madsen, 2016; Riedl, 2004), that have stated theoretical propositions for the determinants and variables used as proxies for economic impairment, occurrences of earnings management and corporate governance mechanisms, is used. These proxies are connected to observable variables, that have been used in order to develop hypotheses and the collection of quantitative data. In addition, this thesis add two variables with regards to the impact of female board representation.
The quantitative research approach uses a multiple regression analysis, which is consistent with previous made studies (AbuGhazaleh, Al-Hares, & Roberts, 2011; Stenheim & Madsen, 2016; Riedl, 2004), were a multiple regression analysis is used to examine what determines the amount of reported goodwill impairment. Consequently, the results of the model used in this research could be compared with the findings from previous studies.
Including and testing for several variables allows the research to examine the impact of each individual variable (Easterby-Smith, Thorpe, & Jackson, Management & Business Research, 2015). Each observation is specific for each and one of the firms since the goodwill impairment can take an positive infinite number of values, i.e. the variable is continual (Pallant, 2010:148). This leads to a choice of a multiple linear regression, that fits best for regression analysis with dependent variables with infinite valuation.
4.2 Research process
The regression model is used to test the hypotheses stated in section 3. Hypotheses and is run in SPSS using the sample group of 154 firm-year observations for 69 firms. By examining the
19 p-values of the independent variables, any particular significance to the dependent variable is observable (Saunders, Lewis, & Thornhill, 2009; Donnelly, 2013). These p-values are examined at significance levels of 1 percent, 5 percent and 10 percent. Consistent with Stenheim & Madsen (2016), the regression is run with year-dummies to control for any significant differences between years. This is especially of interest in order to examine if any particular significance can be found for specific years and if conclusions can be drawn to the aftermath of the financial crisis between the years 2007-2010 (Sveriges Riksbank, 2018). The variables used for the regression analysis, all consist of a calculated value as described in Table 3. From this, the effect of each individual independent variable to the dependent variable is observable. The relationship between the independent variables and dependent variable is observable by looking at the positive or negative value of the ẞ-coefficient (Saunders, 2009). In order to understand and interpret the variables, SPSS is used to retrieve descriptive statistics on the mean-(average), min-, max value, standard deviation and the 25th and 75th percentile of the observations in the sample group.
The variance inflation factor (VIF), which is the inverse of the tolerance value, is used to check for multicollinearity between variables and a VIF value above 10 will indicate a strong collinearity (Saunders, Lewis, & Thornhill, 2009). If any strong indications for collinearity is found for the variables, the regression model will be modified by excluding variables to secure the reliability of the regression model (Saunders, Lewis, & Thornhill, 2009).
4.3 Data collection
The data used in the thesis is collected by the authors using the two databases Retriever Business and Thomson Reuters Eikon Datastream. The databases complement each other since they are able to provide different data used in the thesis. Manual collection of data on the board characteristics is retrieved from published annual reports of the sampled firms. The annual reports are also used to collect missing data that cannot be provided by Retriever Business or Thomson Reuters Eikon Datastream. To construct some of the variables, data is also being collected corresponding to year 2006.
20
4.3.1 Sample
The sample group used for the thesis is created by firms listed on OMXS at 31st of December 2017. To compose the sample group, the three trading lists, large capital, mid capital and small capital is used. A ten-year period is selected for the research, between the years 2007-2016. The authors chose to start in year 2007 where the correction from earlier national accounting regulations impacts has been settled, since firms listed on the OMXS are required to implement International Accounting Standards issued by IASB after 2005 (European Commission, 2002). Additionally, the choice of the time-period for the sample group is made to secure an appropriate number of firm-year observations with goodwill impairments and increase the validity of the research, as the observed time-period exceeds the previous similar research done (Riedl, 2004; AbuGhazaleh, Al-Hares, & Roberts, 2011; Stenheim & Madsen, 2016; Saastamoinen & Pajunen, 2016). The data that confirms if goodwill exists in the balance sheet or not for the listed firms is collected by using Retriever Business. To collect data on the amount of reported goodwill impairment, EBITDA, OCF and ROA, Thomson Reuters Eikon Datastream is used. The collection of the number of board members, characteristics of the board members, share price, the number of shares, result of previous and present year, total liabilities and total intangible assets is done by manual collection of the annual financial reports published by each and one of the firms in the sample group. The data used in this research is classified as secondary data.
Table 1 – Exclusion of observations
Firm-year observations N Percentage
Firms listed on Nasdaq OMX Stockholm (OMXS)
Dec. 31 2017 (nr. observations) 3160 100,00% Observations classified within the financial industry -430 -13,61% Non-existing goodwill in the balance sheets -954 -30,19% Non-impairment observations -1276 -40,38% Observations with data incomplete or missing, broken fiscal
years, other reporting currency than SEK, or not listed at Nasdaq OMX Stockholm (OMXS)
-346 -10,95%
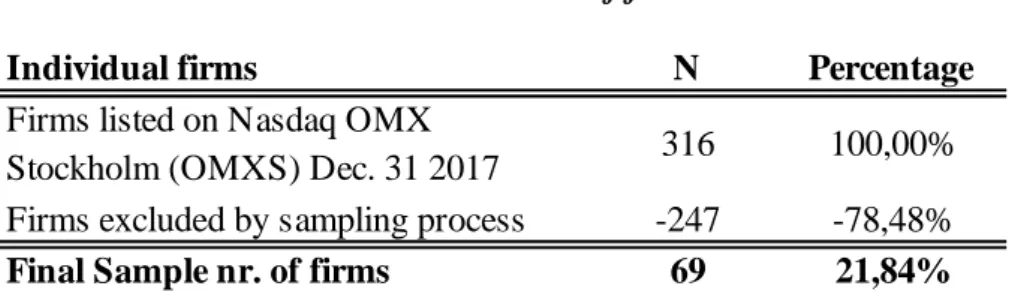
21 Table 2 – Exclusion of firms
Table 1 and Table 2 show the sampling process in the thesis. The large-, mid and small capital lists for the OMXS consisted of 316 firms in 31st of December 2017. For the chosen time period, 3160 possible firm-year observations are found. The first exclusion from the sample are made in line with previous studies made (Stenheim & Madsen, 2016; AbuGhazaleh, Al-Hares, & Roberts, 2011; Riedl, 2004) and is based on the industry classification of the firm. The firms in the sample that are classified as a financial institution according to the Industry Classification
Benchmark are excluded, which includes banks, insurance firms, real estate firms and financial
service firms (FTSE International Limited, 2012). The exclusion of financial institution firms is made because of the tougher regulations that these types of firms faces, which leads to a loss in comparability to other industries (Stenheim & Madsen, 2016; AbuGhazaleh, Al-Hares, & Roberts, 2011; Riedl, 2004). This reduce the sample with 43 firms and 430 firm-year observations. Secondly, 954 firm-year observations are excluded from the sample since no goodwill is reported for the observed period. Third, 1276 firm-year observations are not found to report any goodwill impairment for the observed period and are therefore excluded. The two criteria, goodwill in the balance sheets and reported goodwill impairments, is chosen to be made, since the hypotheses of the thesis is designed to only be applicable to firm-years with reported goodwill impairments. Lastly, a reduction of the sample group is made by excluding the firm-year observations where no data is found, when there is a broken fiscal year, or the financial reporting is made in another currency than the Swedish Krona (SEK) or if the firm is not listed on the OMXS. This reduce the sample with 346 observations.
The final sample consisted of 154 observations [4,87 percent out of total possible observations] from 69 firms [21,84 percent out of total number of firms] during the time period 2007-2016.
I ndividual firms N Percentage
Firms listed on Nasdaq OMX
Stockholm (OMXS) Dec. 31 2017 316 100,00%
Firms excluded by sampling process -247 -78,48%
22
4.4 Variables
The variables in this thesis is used in previous studies (Stenheim & Madsen, 2016; AbuGhazaleh, Al-Hares, & Roberts, 2011; Riedl, 2004; Saastamoinen & Pajunen, 2016), except for the variables related to gender diversity. To secure a comparability of the research, all continuous variables from these previous studies used in the regression model, are either adjusted for goodwill impairment reported, scaled for total assets or defined as lagged measures (i.e. t-1), consistent with previous studies (Stenheim & Madsen, 2016; AbuGhazaleh, Al-Hares, & Roberts, 2011; Riedl, 2004; Saastamoinen & Pajunen, 2016). The variable NUM_WOMEN_BOARD is adjusted as the variable NON_EXE, since both variables are defined as a fraction of the total number of board members of firm i at time t. This correction protects the thesis from potential proportionality issues in the data used, and therefore, there is no exclusion of outliers for the variables used in the regression analysis (AbuGhazaleh, Al-Hares, & Roberts, 2011).
23 Table 3 – Variables used in the regression model
Variable explanation
Dependent variable
IMP_AMOUNT (t )
Reported goodwill impairment (positive amount) of firm i, period t, scaled by total assets at time t-1 .
I ndependent variables
ΔROA (i, t, t-1 ) Changes in pre-impairment return on assets of firm i , from period t-1 to t .
ΔOCF (i, t, t-1)
The change in operating cash flows for firm i from period t-1 to t scaled by total assets at the end of t -1
BM (i, t ) Pre-impairment book-to-market of firm i , time t .
BATH (i, t )
Changes in pre-impairment earnings of firm i from period t-1 to t , scaled by total assets at time t-1 , a dichotomous variable that takes the value when below the median of nonzero negative values of this variable; otherwise 0.
SMOOTH (i, t )
Changes in pre-impairment earnings of firm i from period t-1 to t , scaled by total assets at time t-1 , a dichotomous variable that takes the value when above the median of nonzero positive values of this variable; otherwise 0. BOARD_SIZE (i, t) Natural logarithm of number of board
members of firm i time t .
BOARD_MEET (i, t) Natural logarithm of number of board meetings of firm i time t .
NONEXE (i,t )
Number of independent non-executive directors, scaled by total number of board members of firm i , time t .
NUM_WOMEN_BOARD (i, t ) Number of women on board scaled by total number of board members of firm i , time t.
EU_WOMEN_BOARD (i, t)
Variable equals 1 if firm i fulfill criteria of at least 40 % women on board in period t ; otherwise 0.
Control variable
SIZE (i, t) Natural logarithm of total assets of firm i , time t-1 .
24
4.4.1 Dependent
The dependent variable used in the multiple regression model represent the amount of reported goodwill impairment for the firm, IMP_AMOUNT. The definition of IMP_AMOUNT, follows previous studies, that the amount of reported goodwill impairment of firm i, for year t was scaled by the value of total assets for year t-1 (Stenheim & Madsen, 2016; AbuGhazaleh, Al-Hares, & Roberts, 2011; Saastamoinen & Pajunen, 2016). This makes the amount of goodwill comparable among the observations used in the research.
4.4.2 Independent
The independent variables are divided into three subsections; economic impairment, earnings management and corporate governance mechanisms.
4.4.2.1 Hypothesis H
1,- Proxies for Economic Impairment
∆ROA: Changes in return on assets can be used as an indicator for firm performance and asset
values (Stenheim & Madsen, 2016; AbuGhazaleh, Al-Hares, & Roberts, 2011; Francis, Hanna, & Vincent, 1996; Kvaal, 2005; Riedl, 2004; Segal, 2003; Sellhorn, 2004; Zang, 2008). Predicted outcome between ROA and IMP_AMOUNT: ( - ).
- A larger amount of goodwill impairment is reported for firms with negative changes in return on assets.
∆OCF: Changes in operating cash flows can be used as an indicator for firm performance and
asset values (Stenheim & Madsen, 2016; Francis, Hanna, & Vincent, 1996; Riedl, 2004; Segal, 2003; Sellhorn, 2004; Kvaal, 2005; Zang, 2008). Predicted outcome between ∆OCF and IMP_AMOUNT: ( - ).
- A larger amount of goodwill impairment is reported for firms with negative changes in operating cash flows.
BM: Book-to-market ratio can be used as an indicator for impairment losses (Stenheim &
Madsen, 2016; AbuGhazaleh, Al-Hares, & Roberts, 2011; Francis, Hanna, & Vincent, 1996; Kvaal, 2005; Riedl, 2004; Segal, 2003; Sellhorn, 2004). The book-to-market ratio of a firm consists of the valuation of the firm made by the market and the firm's own valuation of their
25 books, mostly done in directions of accounting regulation. Predicted outcome between BM and IMP_AMOUNT: ( + ).
- A larger amount of goodwill impairment is reported for firms with a high book-to-market ratio.
4.4.2.2 Hypotheses H
2a,H
2b- Proxies for Earnings Management
BATH: When pre-impairment earnings are lower than expected, impairment losses are larger,
as the accounting behaviour of “Big Bath” occurs. There is no generally proved method to measure the occurrence of “Big Bath” and therefore, the variable is more used as an indicator of this accounting behaviour in this thesis (Higson, 2003; Stenheim & Madsen, 2016; Kirshenheiter & Melumad, 2002; Alciatore, Dee, Eastion, & Spear, 1998; Zucca & Campbell, 1992). Predicted outcome between BATH and IMP_AMOUNT: ( - ).
- A larger amount of goodwill impairment is reported when changes in pre-impairment earnings between periods, scaled by total assets, when below the median of nonzero negative values of this variable.
SMOOTH: When pre-impairment earnings are higher than expected, impairment losses are
larger, as the reporting strategy of “Income Smoothing” occurs. There is no generally proved method to measure the occurrence of “Income Smoothing” and therefore, the variable is more used as an indicator of this reporting strategy in this thesis (Stenheim & Madsen, 2016; Kirshenheiter & Melumad, 2002). Predicted outcome between SMOOTH and IMP_AMOUNT: ( + ).
- A larger amount of goodwill impairment is reported when there are changes in pre-impairment earnings between periods, scaled by total assets, when above the median of nonzero positive values of this variable.
4.4.2.3 Hypotheses H
3,- Proxies for Corporate Governance Mechanisms
BOARD_SIZE: The quality of the financial reporting and the occurrence of earnings
management actions are affected by the number of board members. A larger board is an indicator for better financial reporting and less occurrence of earnings management actions
26 (Xie, Davidson, & DaDalt, 2003). Predicted outcome between BOARD_SIZE and IMP_AMOUNT: ( + ).
- A larger amount of non-opportunistic goodwill impairment is reported when there is an increased number of board members.
BOARD_MEET: The board activity, i.e. the frequency of board meetings, are positively
associated with the quality of the financial reporting and an increased number of board meetings for the fiscal year improves earnings quality (Xie, Davidson, & DaDalt, 2003; Vafeas, 2005). Predicted outcome between BOARD_MEET and IMP_AMOUNT: ( + ).
- A larger amount of non-opportunistic goodwill impairment is reported for firms with a higher frequency of board meetings.
NON_EXE: There is a higher quality of the financial reporting when there is a higher
percentage of non-executive board members that are classified as independent members. The independence reduces the incentives for earnings management (Davidson, Goodwinn-Stewart, & Kent, 2005). Predicted outcome between NON_EXE and IMP_AMOUNT: ( + ).
- A larger amount of non-opportunistic goodwill impairment is reported when there is a higher percentage of non-executive board members.
NUM_WOMEN_BOARD: The gender diversity of the board has an impact on the firm
performance. An increased number of women in the board improves the quality of financial reporting (Joy, Carter, Wagener, & Narayanan, 2007; Wilson & Altanlar, 2009; Rohner & Dougan, 2012). Predicted outcome between NUM_WOMEN_BOARD and IMP_AMOUNT: ( + ).
- A larger amount of non-opportunistic goodwill impairment is reported when there is a larger number of women on the board.
EU_WOMEN_BOARD: The gender diversity of the board has an impact on the firm
performance. An increased number of women in the board improves the quality of financial reporting (Joy, Carter, Wagener, & Narayanan, 2007; Wilson & Altanlar, 2009; Rohner & Dougan, 2012). To secure this quality of financial reporting, the EU recommends a 40 percent level of female board members. Predicted outcome between EU_WOMEN_BOARD and IMP_AMOUNT: ( ? )
27
4.4.2.4 Control-variable
Consistent with previous studies, SIZE is used as a control variable in previous studies (AbuGhazaleh, Al-Hares, & Roberts, 2011; Stenheim & Madsen, 2016; Saastamoinen & Pajunen, 2016).
SIZE: The reporting practice of a firm can be affected by the size of the firm. Therefore, it
would be legitimate to consider this variable when running the regression analysis for the amount of reported goodwill impairment. For larger firms, there is often an increased pressure from its stakeholders about complying with the accounting regulations (Watts & Zimmerman, Positive Accounting Theory: A Ten-Year Perspective, 1990). A small firm may instead lack the resources necessary for making an accurate impairment test (Bens, Heltzer, & Segal, 2011; Chalmers & Godfrey, 2011; Jarva, 2009).
4.5 Regression model
𝐼𝑀𝑃_𝐴𝑀𝑂𝑈𝑁𝑇𝑡 = 𝛼0+ 𝛼1𝛥𝑅𝑂𝐴𝑖,𝑡,𝑡−1+ 𝛼2𝛥𝑂𝐶𝐹𝑖,𝑡,𝑡−1+ 𝛼3𝐵𝑀𝑖,𝑡 + 𝛼4𝐵𝐴𝑇𝐻𝑖,𝑡 + 𝛼5𝑆𝑀𝑂𝑂𝑇𝐻𝑖,𝑡+ 𝛼6𝐵𝑂𝐴𝑅𝐷_𝑆𝐼𝑍𝐸𝑖,𝑡+ 𝛼7𝐵𝑂𝐴𝑅𝐷_𝑀𝐸𝐸𝑇𝑖,𝑡 + 𝛼8𝑁𝑂𝑁𝐸𝑋𝐸𝑖,𝑡+ 𝛼9𝑁𝑈𝑀_𝑊𝑂𝑀𝐸𝑁_𝐵𝑂𝐴𝑅𝐷𝑖,𝑡 + 𝛼10𝐸𝑈_𝑊𝑂𝑀𝐸𝑁_𝐵𝑂𝐴𝑅𝐷𝑖,𝑡 + 𝛼11𝑆𝐼𝑍𝐸𝑖,𝑡+ 𝜖𝑖,𝑡The regression model is used to test the hypotheses stated in section 3. Hypotheses and is run using the full sample of observations (n=154).
4.6 Research quality - Reliability & Validity
The reflection regarding the value of the research is done through the two segments of reliability and validity (Bryman & Bell, 2013). The reliability can for example be seen if the research replicates previous studies made in the field and the results and findings are similar, by this, a consistency is found (Saunders, Lewis, & Thornhill, 2009). In this thesis, the reliability is shown in using a regression model, measuring determinants of the amount of goodwill impairment, collected from previous made studies (AbuGhazaleh, Al-Hares, & Roberts, 2011; Stenheim & Madsen, 2016).
28 The number of variables used in the regression analysis/model in this thesis, have also had an impact on the reliability and the validity and have been selected in consideration of what previous studies have used (AbuGhazaleh, Al-Hares, & Roberts, 2011; Stenheim & Madsen, 2016; Riedl, 2004). The increased number of independent variables have also been motivated by the statement that reported goodwill impairments can be affected by many different factors (Francis, Lennox, & Wang, 2010). By including a wide range of variables that has been tested before, that can have a possible impact on the amount of the reported goodwill impairment, the research reliability may increase. However, not all variables used in previous studies are included in the regression model and additionally, two non-previously tested variables has been included in this thesis (AbuGhazaleh, Al-Hares, & Roberts, 2011; Stenheim & Madsen, 2016; Riedl, 2004). These choices make the thesis not fully consistent with previous studies and could come to harm the reliability of the thesis.
The second segment of the value of research is the validity which reflects how well the results and models used in the research actually reflect the reality (Bryman & Bell, 2013). The validity in this thesis have been secured by being attentive of where the data has been collected from. The data collection has been made by using databases with information presented from publicly published reports that are approved by auditors. Additionally, the complementing data, collected manually, was collected from the audited publicly published reports. Likewise, the motivation behind this choice was to collect data that would lead to better validity of the research.
The selected time frame for the observations is also something that could impact the validity of the research. The time frame used in this thesis could impact the results, since the years 2008-2009 was heavily affected by the financial crises (Rani & Torres, 2011), that affected the Swedish economy between the years 2007-2010 (Sveriges Riksbank, 2018). This recession could lead to abnormal observations that will impact the result of the thesis. To solve this potential dilemma of external validity, an expanded time frame, compared to earlier studies made, is used in order to recognize potential changes in the trends (Bryman & Bell, 2013).
29
5. Empirical results
In this chapter, the authors present the empirical results of the thesis; the descriptive statistics and the results of the multiple regression.
5.1 Descriptive statistics
The sample, used in the thesis, consists of 154 observations, between the years 2007-2016. Table 4 shows the frequency of reported goodwill impairment observations for the ten-year period. As seen in Table 4, a higher frequency of goodwill impairments was reported between the years 2008 and 2011.
Table 4 – Year frequency of reported goodwill impairments
The descriptive data for the variables used in the multiple regression analysis is presented in Table 5 below. Table 5 is constructed with the descriptive data of the dependent variables presented in the upper part of the table and is followed by descriptive data for the independent variables and control variable used in the regression model.
Year Reported goodwill impairment
observations (final sample)
Percentage of reported goodwill impairment observations (final
sample) 2007 13 8,4% 2008 16 10,4% 2009 23 14,9% 2010 19 12,3% 2011 24 15,6% 2012 11 7,1% 2013 14 9,1% 2014 13 8,4% 2015 9 5,8% 2016 12 7,8% Total 154 100,0%
30 Table 5 – Descriptive statistics
There is a big range for the amount of reported goodwill impairment among the observations used. The impairment amount has a minimum value of 34 000 SEK and a maximum value of 4 984 000 000 SEK with a mean value of 214 432 629 SEK. Fifty percent of the amount of reported goodwill impairment for the sample group is between 8 000 000 SEK and 103 650 000 SEK. When the average (mean) firm in the sample group report goodwill impairment, the size of the impairment represents 28 percent [0,283] of the total assets of the firm. There is a big range between the size of the firms in the sample group. The average firm reports total assets of 18 228 741 429 and fifty percent of the firms report assets between 662 757 750 SEK and 26 915 500 000 SEK, which show on big differences for the size of firm in the sample group. The variables, ∆ROA, ∆OCF and BM, associated with economic impairment, show on big differences between the max- and min values.
The average board of directors for the sample group used in the thesis consists of 7 board members and fifty percent of the observations reported a board of directors consisting of 6 to 8 board members. The minimum value of 3 board members follows the Swedish corporate law, which requires a minimum of 3 board members for a publicly traded firm (Justitiedepartementet L1, 2005, 18:46). For the sample group, a range from no women at all (min) up to 5 female
Nr. of
observations Mean Median Std. Deviation Minimum Maxmimum
25% 75% Amount of Reported Goodwill I mpairment 154 214 432 626 33 200 000 603 709 579 34 000 4 984 000 000 8 000 000 103 650 000 I MP_AMOUNT 154 0,283 0,011 1,919 0,000 21,677 0,001 0,051 Number of Board Members 154 7 7 2 3 10 6 8 Number of Female Board Members 154 2 2 1 0 5 1 2 Number of I ndependent NED 154 6 6 2 1 10 5 7 Total Number of Board M eetings 154 11 10 4 5 32 8 13 ΔOCF (i,t,t-1) 154 7,085% 0,155% 381,470% -1692,353% 3890,463% -2,503% 3,523% Total Assets (t-1) 154 18 228 741 429 4 360 450 000 32 233 337 904 26 475 000 251 000 000 000 662 757 750 26 915 500 000 ΔROA (i,t,t-1) 154 -1,042 -0,002 13,054 -102,833 46,459 -0,028 0,032 BM (i,t) 154 -0,220 0,090 1,935 -16,040 3,780 -0,223 0,363 BATH/SMOOTH 154 0,415 -0,003 13,329 -97,755 94,051 -0,051 0,029 Percentile