V¨
aster˚
as, Sweden
Examensarbete f¨
or kandidatexamen i datavetenskap - 15 hp
EVALUATING MULTI-UAV SYSTEMS
WITH TEXT TO SPEECH FOR
SITUATIONAL AWARENESS AND
WORKLOAD
Viktor Gemo Lindgren
Vln16005@student.mdh.se
Examiner: Abu Naser Masud
M¨
alardalen University, V¨
aster˚
as, Sweden
Supervisors: Afshin Ameri
M¨
alardalen University, V¨
aster˚
as, Sweden
Abstract
With improvements to miniaturization technologies, the ratio between operators required per UAV has become increasingly smaller at the cost of increased workload. Workload is an important fac-tor to consider when designing the multi-UAV systems of tomorrow as too much workload may decrease an operator’s performance. This study proposes the use of text to speech combined with an emphasis on a single screen design as a way of improving situational awareness and perceived workload. A controlled experiment consisting of 18 participants was conducted inside a simulator. Their situational awareness and perceived workload was measured using SAGAT and NASA-TLX respectively. The results show that the use of text to speech lead to a decrease in situational aware-ness for all elements inside the graphical user interface that were not directly handled by a text to speech event. All of the NASA-TLX measurements showed an improvement in perceived workload except for physical demand. Overall an improvement of perceived workload was observed when text to speech was in use.
Table of Contents
1. Introduction 1 2. Background 2 3. Problem Formulation 4 4. Related Work 5 4.1. Situational Awareness . . . 5 4.2. Design . . . 54.3. Relations to this study . . . 6
5. Methods 7 5.1. Situation Awareness Global Assessment Technique . . . 7
5.2. NASA Task Load Index . . . 7
5.3. The Graphical User Interface . . . 8
5.4. Text to speech component . . . 9
5.5. Planned Experiment . . . 10
5.6. Limitations . . . 10
6. Ethical and Societal Considerations 12 7. Implementation 13 8. Results 16 8.1. Parcitipants . . . 16 8.2. NASA-TLX . . . 16 8.3. SAGAT . . . 18 9. Discussion 20 9.1. SAGAT . . . 20 9.2. NASA . . . 20
9.3. Problems with testing and recommendations . . . 21
References 25
List of Figures
1 NASA-TLX Scales, Source [1] . . . 8
2 Original GUI, Source: [2] . . . 9
3 Single Screen Design . . . 13
4 Text to speech component call structure . . . 14
5 SAGAT Test inside the simulator . . . 15
6 Participants graphs . . . 16
7 Mental and Physical Demand . . . 16
8 Temporal Demand and Performance . . . 17
9 Effort and Frustration . . . 17
10 Overall Rating . . . 18
1.
Introduction
With the improvements in embedded control systems, miniaturization technologies and the emer-gence of new sensors, a new generation of smaller and lower cost Unmanned Aerial Vehicles (UAVs) has emerged. Due to the low cost of this new generation of UAV’s, UAV systems are more used in commercial applications. The newer generation of UAVs can with a higher degree of autonomy and rely less on human inputs. As a consequence, the number of operators needed for controlling and supervising a UAV mission has reduced drastically which in turn opens up the path for devel-opment of multi-UAV systems. This change comes at the cost of an increase to system workload for the operator[3]. In some scenarios using several UAVs to achieve a goal is more beneficial. For example using a multi-UAV system in search and rescue operations, where the UAVs can carry payloads such as first aid kits and other medical supplies. Another example is reconnaissance, where a multi-UAV system can cover a larger area in a smaller amount of time compared to a system of one or a few UAVs.
An operator’s workload grows exponentially with the number of UAVs operating inside the system[4], it becomes critical to keep the operators situational awareness high to enable efficient decision making during missions. While simultaneously avoid information-heavy user interfaces as to avoid overloading the user. Developers of the multi-UAV systems of tomorrow need to keep this in mind when designing or scaling up systems for UAV operations.
Previous research has shown that the use of multi-modal technologies such as speech synthesis combined with a touch screen device can be used to improve reaction times of UAV operators[5]. Other studies have shown that the use of a single screen system design has been more beneficial in helping the operators to maintain their focus, compared to similar UAV system designs[6]. This study will explore if the combination of a single screen design together with text to speech technology will improve situational awareness and workload of the operator in a multi-UAV system. By first designing a graphical user interface with a single screen design from the ground up, while letting some aspects of the information the graphical user interface displays also have an text to speech component attached to them. The text to speech component will let the system handle some of the information for the user so they can focus on other aspects of the mission.
The thesis is structured as follows: Section 2 explains the problem and the goals of the experiment. Sections 3 and 4 give the reader the necessary background and theory needed to understand the research and experiment and serves as a summary of previous research done related to the topic and field. Section 5 describes the controlled experiment and the methods used to answer the research question. Section 6 states all ethical considerations. Section 7 Gives an in depth explanation of the solution including all details and choices related to it. The final results are displayed in section 8 and discussed in depth in section 9. Lastly conclusions are shown in section 10.
2.
Background
An Unmanned Aerial Vehicle (UAV) is a type of aircraft which can fly without a pilot on-board. This means that they can either be flown remotely or have some level of autonomy. UAVs were originally used almost exclusively by the military. Commercial use of UAVs has become more popular in the last decade due to increasingly smaller and cheaper drones (UAVs). UAVs can pro-vide essential information and functionality for both military and civilian applications[7]. Military applications for UAVs include: reconnaissance, enemy attacks and mine clearing. Civilian and commercial applications for UAVs include : recreational activities such as drone racing, disaster relief, aerial surveillance, film making, journalism, cargo transport, forestry, scientific research and agriculture.
These aircraft usually contain a wide array of sensors and equipment. Military UAVs have weapons such as missiles or surveillance equipment such as radar. Commercial UAVs can be equipped with a variety of equipment from surveillance tools like cameras to more industry-specific tools such as electromagnetic sensors or containers for delivering goods. The UAV is one component of an unmanned aircraft system (UAS) which consists of a UAV, a ground control station (GCS) and a communication system for the UAV and the GCS. A UAS can be comprised of one or hundreds of UAVs.
The GCS is used for planning and flying missions. A mission can be defined as a set of waypoints and tasks that the drone should perform. A GCS normally provide such a service through a map where the operator can define waypoints and objectives for the flight as well as track the progress of each mission. A GCS also presents an overview of the UAVs by showing general information about the UAVs and their status. The information from the UAV may include its current speed, position, battery level and video feed. The GCS is operated by a human who monitors the feed and makes decisions based on the incoming information [4]. As the mission grows in complexity, either by increasing the number of UAVs or by introducing more environmental variables, so does the perceived workload experienced by the operator.
Workload is defined as ”a term that represents the cost of accomplishing mission requirements for the human operator”[1]. There are multiple ways to measure perceived workload, such as the widely used NASA-TLX which is discussed in section 5.2. Being aware of the potential increase in perceived workload is an important factor to consider when designing or scaling up a system. Managing workload is especially relevant in tasks that require the operator to react in a timely manner to critical information as too much workload may decrease operator performance.[3] An operator’s ability to react to events and keep track of information within a volume of time is what’s called situational awareness [8]. Situational awareness is broken down into three levels: Perception, comprehension and projection. The first level, perception, is to perceive the status, at-tributes and dynamics of relevant elements in the environment. A pilot would for example perceive elements such as air crafts, obstructions or warnings lights. The second level, comprehension is interpretation of the situation assessment. The third level, projection is knowing how the situation is likely to evolve. Once these three levels are reached, situational awareness forms the foundation of good decision making. High workload factors such as information dense tasks or a stressful environment can make achieving situational awareness harder. It is important to make sure when designing a system that all information a user requires to achieve situational awareness is avail-able, while also making sure that the graphical user interface doesn’t cause information overload or stress.
In a paper by Endsley, M.R. [9] several recommendations for implementing and conducting a Situation Awareness Global Assessment Technique (SAGAT) tests are given. Some examples of these recommendations are as follows: When giving recommendations for procedures, Endsley writes ”No display or other visual aids should be visible while subjects are answering the queries. If subjects do not know or are uncertain about the answer to a given query, they should be encouraged to make their best guess”. On the topic of when to collect SAGAT data Endsley recommends the
following ”It is recommended that the timing of each freeze for SAGAT administration be randomly determined and unpredictable enough so that subjects can not prepare for them in advance”, and later adds ”An informal rule has been to ensure that no freezes occur earlier than three to five minutes into a trial to allow subjects to build up a picture of the situation and that no two freezes occur within one minute of each other”. When discussing training, Endsley recommends that each participant should be taken through multiple training trials to make the subject more comfortable with the procedure and to clear up and uncertainties concerning how to answer the queries. Endsley also recommends to randomly select a portion of queries as a way to provide consistency and statistical validity across trials.
3.
Problem Formulation
The first goal of this thesis is to establish if text to speech can improve the situational awareness for an operator when used in a multi-UAV system. The purpose is to potentially and hopefully give a design foundation for developers of future multi-UAV systems to determine if text to speech is useful for their implementation of multi-UAV systems of tomorrow. The second goal of the study is to determine the effects inclusion of text to speech inside a multi-UAV system could have on the overall perceived workload for the system. This could prove useful when determining if the inclusion of text to speech in a multi-UAV system has an overall positive or negative effect as a whole. By conducting an experiment involving a simulated multi-UAV system with a SAGAT test to measure the situational awareness and a NASA-TLX test to measure the perceived workload, this study aims to be able to determine the efficacy of using text to speech inside such a system. The thesis will attempt to answer the following questions:
• Research Questions 1: ”Will the inclusion of text to speech in a multi-UAV system improve the operator’s situational awareness”
• Research Questions 2: ”Will the inclusion of text to speech in a multi-UAV system improve the operator’s overall perceived workload”
4.
Related Work
In order to get a better understanding of situational awareness and the ways to assess it given a scenario, in this section first we will review previous works on measuring situational awareness with a focus on UAV control systems. Then we will look into the research done into designing GCS software for UAVs. We will conclude this section by relating these works to our work and provide the contributions.
4.1.
Situational Awareness
Ruiz et al. [10] present an experiment to evaluate the effects of immersive displays using virtual reality in a multi-UAV system. SAGAT was used in the experiment as a way of measuring spacial knowledge within the survey by having each participant answer three questionnaires with 10 ran-domly selected SAGAT queries about the UAVs in the mission. These three questionnaires were administered by freezing the simulation at random times at questions were picked from a database containing 40 questions in total.
J.Shirley [11] used SAGAT to investigate the use of dynamic function allocations in simulated UAV control operations as a means of reducing human out-of-the-loop performance problems while maintaining workload reduction benefits. The test was broken into three blocks of task of escalating difficulty. After each block a 60 second pause was issued and three randomly selected SAGAT queries were presented inside a grey screen covering the vehicle control interface. These three randomly selected SAGAT queries were taken from a database of 54 total queries, 18 from each of the three levels of situation awareness.
4.2.
Design
Maza et al. [5] discuss the potential positive effects of text to speech usage inside a multi-UAV system . Their study measures the decrease in reaction time of an operator by adding modalities such as 3D audio, speech synthesis, haptic feedback and touchscreen to a multi UAV system. The results of the study showed that adding a touchscreen interface or a touchscreen with other modalities such as 3D audio and haptic feedback lead to clear improvements in an operators reaction time. Combining a touchscreen interface with text to speech gave an mean increase of 8.89 percent compared to only touchscreen, and 28.7 percent over only mouse and keyboard. Other combinations, such as touch screen and 3D audio or touch screen and vibration showed a mean increase of 11.18 percent and 10.97 percent respectively.
Important design aspects to consider during the development of a multi-UAV system and its ground control station is discussed in a paper by Rodrigeuz et. al”[4] published in 2012. The study’s emphasises is on the importance of visual alerts and indications for events such as low battery or equipment failure as well as the importance of displaying all the information required to be aware of the state of each UAV while avoiding overloading the operator. Four main elements are depicted in the study: A UAV selector panel displaying the UAVs currently in mission, a details-panel for the selected UAV, a map area displaying UAV locations and a tab widget containing logging and sensor visualisation. In a later paper published in 2016[12], a more modern iteration of this layout can be found.
Several papers [13][6] argue that the GSC tasking and UAV control should all be within a single display screen as a means of helping the operator maintain focus on the mission and avoid context switch. Examples brought up in the papers of this design principle are displaying alert messages directly onto the bottom part of the map instead of as a popup.
4.3.
Relations to this study
The choice to use text to speech over other technologies, such as those mentioned in the study by Maza [5] which showed larger improvement, was mostly due to budget restraints and the inability to conduct physical on-site testing during the COVID-19 pandemic. Maza’s study focuses on operator’s reaction time, we improve that work by measuring operator’s situational awareness and workload.
Design of the graphical user interface was heavily inspired by the guidelines drawn up in the works by Rodriguez et. al [4] and Bae et. al [12]. Mostly in the form of the vehicles panel, map marker tool tip, the interactive map and error panel respectively. Having everything within a single screen was based on the arguments laid out in the paper by M. Ilbeygi and M.R. Kangavari [13] as well as the paper by Petcher et. al [6].
Some of the recommendations in [9] have been followed. No display or visual aid is visible while the SAGAT is taken. The SAGAT is also administered at a random time, chosen at the start of each simulation run between an interval of 8 to 11 minutes. There are multiple recommendations that aren’t followed in this study. Some of the papers cited [10] [11] follow Endsleys recommendations regarding multiple trials and randomly selected queries. Because of time constraints and the inability to have physical testing due to the COVID-19 pandemic the decision was taken to not conduct multiple SAGAT procedure for each participant. Time constraint is also the reason for not using randomly selected queries from a database. Instead a number of queries small enough to answer during a single trial were used.
5.
Methods
5.1.
Situation Awareness Global Assessment Technique
Situation Awareness Global Assessment Technique (SAGAT) is a freeze on-line probe technique that allows the measurement of a test subject’s Situational Awareness (SA). It is designed for real-time simulations with a human test subject and provides diagnostic information regarding how well the system in question supports the operators various SA requirements. In a SAGAT test, the simulation is frozen at randomly selected times and subjects are then queried as to their perception of the situation in that instant. These queries, called SAGAT queries are on specific data or data criteria corresponding to the three levels of SA: perception, comprehension, projection [8]. The responses are scored as correct or incorrect, and all questions not answered are considered incorrect. Then the total percentage of correct answers for each group will be summarized into an total average for each question and for the entire group. SAGAT is widely used in a variety of fields, including air traffic control[14], commercial aviation[9] and teleoperation[15] and is is one of the best publicised and widely known measure of Situational Awareness. The SAGAT queries used in this thesis are taken from similar works in the field of UAV research. Together the chosen queries cover important attributes and elements an operator needs to be ware of during a mission. Each query has its origin listed as its reference:
• Question 1: How many UAVs are you controlling?[16]
• Question 2: Which UAV is currently experiencing an emergency?[17] • Question 3: What is the current battery level of U AVi [11]
• Question 4: What is the altitude of U AVi [10]
• Question 5: With U AVi current battery usage, will it run out of battery before completing its mission?[11]
• Question 6: What part of the plan is U AVi executing now?[16] • Question 7: What is the current location of U AVi [10]
Each participant will also be asked if they were using text to speech or not. This way we will be able to determine if the text to speech component of the Graphical User Interface has a positive or negative effect on the users Situational Awareness.
5.2.
NASA Task Load Index
”The NASA Task Load Index is a multi dimensional rating procedure that provides an overall workload score based on a weighted average of ratings on six subscales: Mental Demands, Physical Demands, Temporal Demands, Own Performance, Effort and Frustration”[18]. NASA describes the scales this way:
• Mental demand: How much mental and perceptual activity was required? Examples of activities include thinking, deciding, calculating, remembering, looking and searching. Was the task easy or demanding, simple or complex, exacting or forgiving?
• Physical demand: How much physical activity was required? Examples of activities include pushing, pulling, turning, controlling and activating.
• Temporal demand: How much time pressure did you feel due to the rate or pace at which the tasks or task elements occurred? Was the slow and leisurely or rapid and frantic?
Figure 1: NASA-TLX Scales, Source [1]
• Effort: How hard did you have to work, both mentally and physically, to accomplish your level of performance?
• Performance: How successful do you think you were in accomplishing the goals of the task set by the experimenter? How satisfied were you with your performance in accomplishing these goals?
• Frustration level: How insecure, discouraged, irritated, stressed and annoyed versus secure, gratified and relax did you feel during the task?
The NASA-TLX implementation used in this thesis consist of two parts, the first part is the total workload divided into the formerly mention six subjective sub-scales. Each sub-scale is set within a 100 points range with 5 point steps. The second part of the TLX intends to create an individual weighting of these sub-scales by letting the subject compare them pairwise based on their perceived importance. This is done by letting the user choose which measurement is more relevant to workload. The number of times each is chosen is the weighted score. This is then multiplied by the scale score of each dimension and then divided by 15 to get the overall task load index workload score from 0 to 100. The NASA Task Load Index (NASA-TLX) is the subjective measurement for the controlled experiments. It is widely used in a multitude of fields including aviation. Each participant will be given a NASA Task Load Index test to fill out after each of the simulation missions are completed. This measurement will determine if the text to speech component of the graphical user interface has a positive or negative effect on the user’s perceived workload.
5.3.
The Graphical User Interface
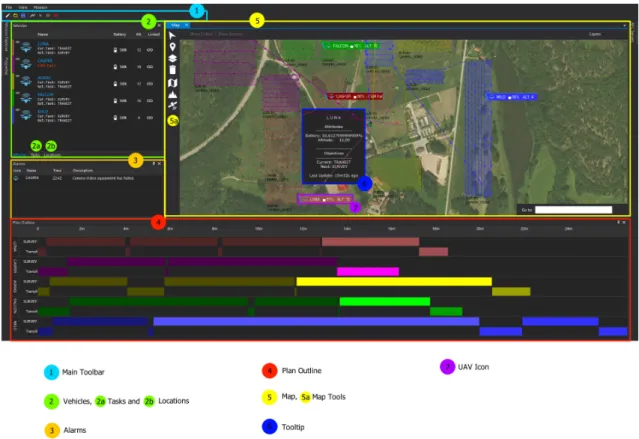
Figure 2 shows the original design of the graphical user interface for the system. The mission explorer panel is where the operator plans the mission, this includes what tasks each UAV should do and what fields and waypoints to be included in the mission. Locations, tasks and vehicles share the same panel with a tab interface to switch between them. The locations section shows which fields exist, their names and if they are assigned to a mission or not. The tasks section shows which tasks are available to use in the mission and the vehicles section of the panel shows each drone’s name, icon, battery icon and level, altitude and if they are currently assigned to the mission or not. The properties panel lists all information available for a location, task or UAV.
Figure 2: Original GUI, Source: [2]
The plan outline panel uses a gantt chart structure to show what type of tasks a UAV will be conducting during the mission. When a task of the mission has been completed, for example when the transit to a field is done, the plan outline panel fades it out to indicate that the task has been completed. The map panel shows all UAVs available. UAVs assigned to a mission have their color changed to correspond to the fields they are assigned to. The panel also shows travel paths for each UAV. The map tools include different types of map views, such as street view and satellite view. It also includes ways to define new fields, delete fields and add new waypoints and home locations.
The new design has to take into account two important factors: firstly it has to be designed in such a way that it works inside a single screen environment, where all the information can be seen and easily accessible without having external information places such as popups or secondary windows. By moving elements such as alerts from a classic popup window design into a static window integrated into the graphical user interface we will eliminate context switch while operating the system. We also aim to eliminate unnecessary or non essential information frames when running the system, this includes hiding the mission explorer panel while running a mission. It also has to be designed in a way which makes information more easily accessible. This ties together with the single screen design by also adding more icons and lowering the amounts of actions needed to get certain types of information. Some examples of this are adding battery and altitude information to the UAVs on the map panel, having tooltip display with more in depth information when hovering over an UAV on the map panel and eliminating having to scroll and click tabs to access basic information.
5.4.
Text to speech component
Google Cloud Text to Speech API and its C# API library is the backbone of the text to speech component of the graphical user interface. The C# API library for google cloud text was chosen
both for its ease of implementation since the library uses very little code, but also for its very extensive documentation over more advanced use cases. The library uses a text to speech client object which includes settings such as the language the request should be in, the voice and in what format the returned voice audio should be in. All these settings can be changed at any time, something that will be used later specifically for the voice and language. Example of this can be seen in the make request function:
v a r v o i c e S e l e c t i o n = new V o i c e S e l e c t i o n P a r a m s {
LanguageCode = ” en−US” , // S t a n d a r d Language SsmlGender = S s m l V o i c e G e n d e r . Female } ; i f ( VoiceName != n u l l ) { v o i c e S e l e c t i o n . Name = VoiceName ; } v a r a u d i o C o n f i g = new A u d i o C o n f i g { AudioEncoding = AudioEncoding . L i n e a r 1 6 } ;
The message structure of each readout was built with clear information flow in mind. The messages should be as short as possible while still both retaining all information needed while simultaneously simulating real speech patterns. The message structure firstly tells the name of the UAV in question followed by the relevant information relating to the UAV.
5.5.
Planned Experiment
The experiment consists of two groups. The first group will be using a Text to Speech component built into the graphical user interface which will read out information to the user during the simulation on top of the information given by the graphical user interface. The second group will not be using the Text to Speech component and will instead solely rely on the information provided by the graphical user interface. Each of the groups will be taken through a simulation of a mission with multiple UAVs doing different kinds of tasks. The simulation will also generate errors such as equipment failure, for example camera failure or communication loss. At a random point during the simulation the simulation will be frozen and a dialog with the SAGAT test will appear on screen. Each user will provide their name, if they are using the text to speech component or not, and answer the questions to the best of their ability.
After submitting their answer the simulation will continue until it reaches its end. After the simulation has ended, each user will be given a NASA-TLX test to fill out which will be used to evaluate their perceived workload during the simulation. Here they will also have to state if they were using the text to speech component or not. After the testing is done, each of the groups average in both tests will be counted and be compared against each other. This way it will be possible to see if the text to speech component had a positive or negative effect on the group using it compared the the group that didn’t.
5.6.
Limitations
Because of the current COVID-19 pandemic the tests will be conducted remotely via the remote control program Teamviewer. The participants will connect to the test computer from their com-puter via Teamviewer and control the test comcom-puter remotely. The program will also transfer sound from the test computer to the participant while using TTS. NASA recommends conducting the test via paper-and-pencil, one study[19] showed that a pen-and-paper test led to less cognitive workload than doing it on a computer screen, or using the official NASA TLX Apple iOS App. The test will not be conducted using the iOS app since it is not possible to provide each operator
with an iOS device. The NASA-TLX will be conducted online via a web application and results will be sent from the user to the test conductor via a text file.
6.
Ethical and Societal Considerations
The study collects data from two types of questionnaires, SAGAT and NASA-TLX. The results of these questionnaires are directly connected to an individual. To ensure all data will remain anony-mous, after collection was completed all names were anonymized and the data were scrambled. The only factor that could connect the data back to the individual would be age.
All participants gave consent, either verbally or via email, to their data being used in this study. The goal of this study is to get a deeper insight if text to speech could prove to be a valuable asset to multi-UAV operators and designers when designing a system.
7.
Implementation
In the controlled experiment two parts needed to be implemented. A graphical user interface with a working Text to Speech component and a simulator. The graphical user interface was built on top of the existing graphical user interface part of the AFarcloud project [2]. In the planning phase some important aspects were laid out for the graphical user interface: it has to be a one screen solution as laid out in [13] and [6], information should be easily accessible and the graphical user interface must contain all the information necessary to answer the SAGAT queries chosen.
Figure 3: Single Screen Design
The vehicle list was taken from the original project and had its render rewritten from the ground up. The panel uses the object view library inside the .net core to populate a vertical list. The error panel works in the same structure as the vehicle list but with an added sorting function. The map and icon render was also rewritten from the original project to show both battery level and corresponding icon for each UAV. With these changes, the vehicle list will give the user the information to answer SAGAT queries 1,3,4-7,the error panel provides information for SAGAT queries 3 and map panel for SAGAT queries 1,2,3,5-6. While the error panel doesn’t answer any unique SAGAT queries, it was added as a component to the other two element as a way to convey more in depth information of the UAV errors and make that information more easily accessible. the map also has a companion tooltip which is displayed when a user hovers over it. This tool-tip was added as a way to make information more easily accessible to the user while working with the map.
The text to speech component is built using the Google Cloud Text to Speech API. The Google Cloud Text to Speech API is an easy to use API that can create lifelike voices and is based on Googles Deep mind research. The API has access to over 50 voices in English and each one of these voices and be pitch shifted to create more voices. The text to speech component inside the project has the ability to assign each individual UAV its own voice decided by the user. This way a user can more easily identify which read out message is corresponding to which UAV. This voices
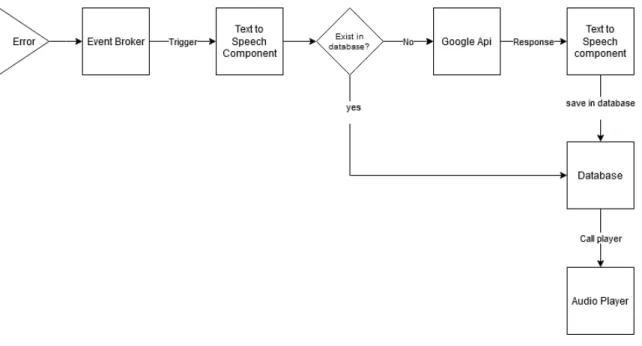
Figure 4: Text to speech component call structure
can be changed at any time inside the Text to Speech settings dialogue.
As illustrated in figure 4, when an event such as an error is raised the Event broker sees this and sends the corresponding trigger to the text to speech component. The TTS component reads the information from the trigger, which includes both the text of the message but also trigger specific information used to fetch the corresponding voice for the relevant UAV. The TTS component then checks if the message already exist in the database and will load that message instead of making another request if possible. If the message has not been fetched before the TTS component will send an API request to the Google Cloud Text to Speech API and await a response. Once a response is given the TTS component saves the file and sends the file path to the audio player which plays the sound. The TTS component is subscribed to multiple different topics inside the event broker and handles each one of these types of requests differently.
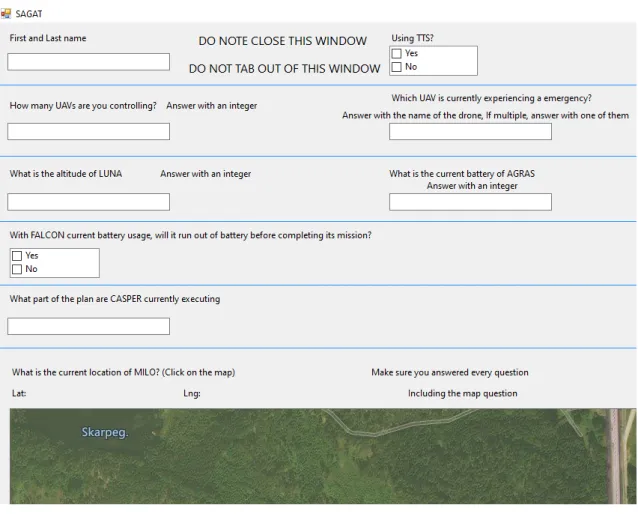
The SAGAT test, shown in figure 5, is integrated into the graphical user interface as a dialog that appears at a random time during the simulation. The user is first asked to input their name and if they are using text to speech or not as a way to group data points together. The user is then taken through the 7 SAGAT queries previously laid out. Each of the questions that include a UAV name has had its UAV randomly selected from the UAVs currently being controlled so that the user can’t prepare for the test. The location question has been designed with the library Gmap. It uses the map API from a selected map provider, for example Bing or Google. It then uses the randomly selected UAVs coordinates, changes them a little and then centers them near but not on top of the UAV in questions. The user has to be within 500m of the UAV’s location to have a correct answer. All these answers are saved in a text file which includes their name, if they were using text to speech or not, all of the SAGAT queries, their answer to the corresponding SAGAT queries and the correct answer as well as what point the automated scoring system gave them. With all this information each file can be checked to see if a user answered correctly but made a small error such as misspelling a name, giving a value in percentage or the system itself somehow failed to give correct points.
8.
Results
8.1.
Parcitipants
In order to conduct this study, two groups were formed from the 18 participants that volunteered. One group was assigned to conduct the multi-UAV system using Text to Speech (TTS) , the other group did not use TTS. The participants were divided evenly between the two groups as there were nine participants in each group. As shown in figure 6a the majority of participants were between the age of 21 and 26, the oldest participants being 32. As shown in figure 6b, none of the participants had any prior knowledge operating a system like this except for one participant answering who was unsure. The participants did two simulated missions, the first with 3 UAVs and the second with 5 UAVs. The SAGAT test was only conducted during the latter. Group 1 did not have TTS enabled for either of the missions while Group 2 had TTS enabled for both of the missions. Age 0 1 2 3 4 5 21 22 24 25 26 27 28 30 32
(a) Age of Participants
Dont know
5,3%
No
94,7%
(b) Answers given to the Question:Do you have prior experience operating a system like this?
Figure 6: Participants graphs
8.2.
NASA-TLX
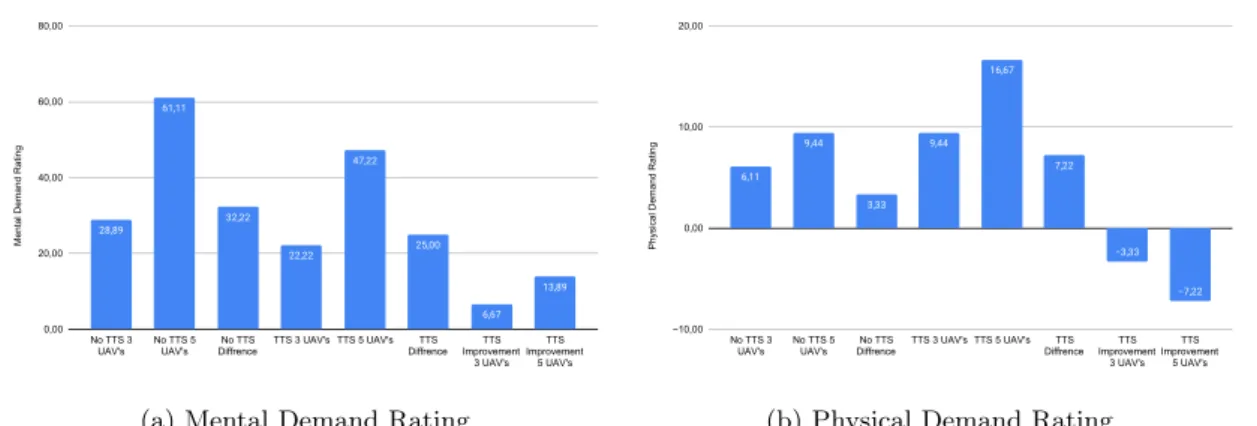
NASA-TLX consist of six subjective sub scales, each set within a 100 point range with 5 point steps. A lower score indicates a lower perceived workload and is generally preferable.
Mental Demand Rating
0,00 20,00 40,00 60,00 80,00 No TTS 3 UAV's No TTS 5 UAV's No TTS Diffrence TTS 3 UAV's TTS 5 UAV's TTS Diffrence TTS Improvement 3 UAV's TTS Improvement 5 UAV's
(a) Mental Demand Rating
Physical Demand Rating
−10,00 0,00 10,00 20,00 No TTS 3 UAV's No TTS 5 UAV's No TTS Diffrence TTS 3 UAV's TTS 5 UAV's TTS Diffrence TTS Improvement 3 UAV's TTS Improvement 5 UAV's
(b) Physical Demand Rating
Figure 7: Mental and Physical Demand
As shown in figure 7a, the mental demand rating shows an improvement of 6.67 points while operating 3 UAVs using TTS and an improvement of 13.89 points while operating 5 UAVs using
TTS. The observed change in mental demand when going from 3 to 5 UAVs was lower in the group using TTS compared to the one without it.
The Physical demand rating (figure 7b) displayed a regression of 3.33 points while operating 3 UAVs using TTS and regression of 7.22 points while operating 5 UAVs using TTS. The observed change in physical demand when going from 3 to 5 UAVs was higher in the group using TTS compared to the one without it.
Temporal Demand Rating
0,00 20,00 40,00 60,00 No TTS 3 UAV's No TTS 5 UAV's No TTS Diffrence TTS 3 UAV's TTS 5 UAV's TTS Diffrence TTS Improvement 3 UAV's TTS Improvement 5 UAV's
(a) Temporal Demand Rating
Performance Rating 0,00 20,00 40,00 60,00 No TTS 3 UAV's No TTS 5 UAV's No TTS Diffrence TTS 3 UAV's TTS 5 UAV's TTS Diffrence TTS Improvement 3 UAV's TTS Improvement 5 UAV's (b) Performance Rating
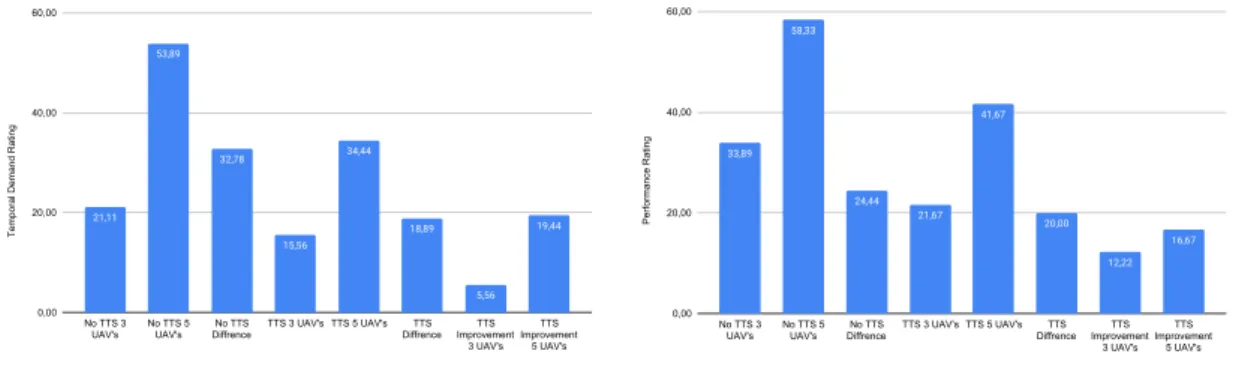
Figure 8: Temporal Demand and Performance
Figure 8a shows an improvement in temporal demand rating of 5.56 points while operating 3 UAVs using TTS and an improvement of 19.44 points while operating 5 UAVs using TTS. The observed change in temporal demand when going from 3 to 5 UAVs was lower in the group using TTS compared to the one without it.
In figure 8b the performance rating exhibited an improvement of 12.22 points while operating 3 UAVs using TTS and an improvement of 16.67 points while operating 5 UAVs using TTS. The observed change in performance rating when going from 3 to 5 UAVs was lower in the group using TTS compared to the one without it.
Effort Rating 0,00 20,00 40,00 60,00 No TTS 3 UAV's No TTS 5 UAV's No TTS Diffrence TTS 3 UAV's TTS 5 UAV's TTS Diffrence TTS Improvement 3 UAV's TTS Improvement 5 UAV's
(a) Effort Rating
Frustration Rating 0,00 10,00 20,00 30,00 40,00 50,00 No TTS 3 UAV's No TTS 5 UAV's No TTS Diffrence
TTS 3 UAV's TTS 5 UAV's TTS Diffrence TTS Improvement 3 UAV's TTS Improvement 5 UAV's (b) Frustration Rating
Figure 9: Effort and Frustration
As can be observed in figure 9a, the effort rating demonstrates an improvement of 7.78 points while operating 3 UAVs using TTS and an improvement of 10.56 points while operating 5 UAVs using TTS. The observed change in effort rating when going from 3 to 5 UAVs was lower in the group using TTS compared to the one without it.
In figure 9b, the frustration rating exhibits an improvement of 8.89 points while operating 3 UAVs using TTS and an improvement of 2.22 points while operating 5 UAVs using TTS. The observed change in frustration rating when going from 3 to 5 UAVs was higher in the group using TTS compared to the one without it.
Overall 0,00 20,00 40,00 60,00 No TTS 3 UAV's No TTS 5 UAV's No TTS Diffrence
TTS 3 UAV's TTS 5 UAV's TTS Diffrence TTS Improvement
3 UAV's
TTS Improvement
5 UAV's
Figure 10: Overall Rating
Figure 10 shows an improvement in the overall rating of 9.89 points while operating 3 UAVs using TTS and an improvement of 14.22 points while operating 5 UAVs using TTS. The observed change in overall rating when going from 3 to 5 UAVs was lower in the group using TTS compared to the one without it. if we convert this to overall improvement in percentage we have an improvement of 52% while operating 3 UAVs using TTS and an improvement of 33% while operating 5 UAVs using TTS.
8.3.
SAGAT
The SAGAT test awards a point for each correct given answer. The graphs show the correct response rate for each questions, with 1 being 100% correct and 0 being 0% correct.
Group # −0,50
0,00 0,50 1,00
SAGAT Q1 SAGAT Q2 SAGAT Q3 SAGAT Q4 SAGAT Q5 SAGAT Q6 SAGAT Q7 TOTAL AVERAGE
No TTS Avg TTS Avg TTS Improvement
Figure 11: SAGAT Results
Figure 11 shows the results of the SAGAT test conducted as a freeze in place probe during the 5 UAV mission. Question 1 (How many UAVs are you controlling?) had the same correct response rate between the two groups. Question 2 (Which UAV is currently experiencing an emergency?) displayed a 33% increase in correct response rate while using TTS. Question 3 (What is the altitude
of U AVi?) shows a 11% decrease in correct response rate while using TTS. Question 4 (What is the current battery of U AVi?) also shows a decrease in correct response rate of 11% while using TTS. Question 5 (With U AVicurrent battery usage, will it run out of battery before completing its mission?)had a decrease in correct response rate by 11% while using TTS. Question 6 (What part of the plan is U AVi currently executing?) demonstrates an improvement in correct response rate of 11% while using TTS. Question 7 (What is the current location of U AVi?) which is answered by clicking on a map provided inside the SAGAT test, a decrease of correct response rate of 44% while using TTS is presented. Questions 2 and 6 had both a TTS event attached to them. Question 2 had a readout of which drone had an error about 15-30 seconds before the SAGAT test was displayed. Questions 6 had each UAV send out a TTS event each time they changed their current task. These two questions were also the only questions that saw an increase in correct response rate while using TTS.
9.
Discussion
9.1.
SAGAT
For the SAGAT questionnaire, question 2 had a TTS event attached to it that read out when an UAV encountered an emergency and question 6 had a TTS event attached to it that read out when an UAV changed its current objective. For example, when it switched from surveying to transit. Both of these questions had an increase in correct response rate when using TTS while every other questions except questions 1 had a worse correct response rate when using TTS.
One reason this could have occurred is due to the presence of a TTS event for the attribute. This makes the attribute weighted and perceived more important than other attributes that do not have an TTS event attached to them. This created a bias for the operator in which they will pay less attention to the other attributes and rely more heavily on the TTS component inside the system. This can most clearly be seen during question 7, a question concerning where on the map the UAV is currently where the correct response rate decreased by 44% while using TTS.
If we look more closely at Questions 3, 4 and 5 the decrease in correct response rate when using TTS is 22% for question 3 and 11% for questions 4 and 5. With a small sample size of two groups with 9 people in each, this means that on questions 4 and 5, the TTS group had one more overall wrong than the non TTS group.
Overall, these trends resulted in a 6% decrease in situational awareness while using TTS compared to not using TTS.
When asked, the majority of participants had a negative reaction to the surprising nature of the SAGAT test, and felt that if they were given information that there would be a test about certain attributes and aspect of the graphical user interface they would have performed better. While this could be true, this would not be feasible because of the small amount of questions inside the SAGAT. It was instead decided not to tell the user that there would be a test. This is supported by the SAGAT guidelines as a way to make sure the user could not hyper focus on the relevant parts of the test as to improve their score. Multiple participants said they didn’t remember the name of the vehicle having a emergency but the color, while we could have given the correct points for the correct color, no user that gave the color gave the correct corresponding color to the vehicle having an emergency. Multiple users also had a problem with the map question because they choose to use another map view such as street view while operating the system. This caused a problem because the map question was set to have the satellite view, something that had not been considered a problem.
9.2.
NASA
The NASA-TLX shows a clear improvement in perceived workload when using TTS for all cat-egories except for physical demand. In the test there is not a clear objective physical task or component which could be the reason for this outlier in the result. The outlier is based on one measurement inside the second part of the test, where the person answers with a physical rating of 60 and a weight of 0.266 units. That’s much higher than the rest of the group’s average of 10, and there are only two weights above 0 in the entire group, the other one being of 0.066. Because of these facts we will not consider this an important measurement and not further analyze the physical demand of the task because it lacks a clear physical component.
When scaling the mission from 3 UAVs to 5 UAVs we can see a decrease in scaling cost for Mental Demand, Temporal Demand and Performance. Mental demand while using TTS has a lower scaling cost with 7.22 units and Temporal has the biggest decrease in scaling cost with 13.89 units over not using TTS, which is a decrease of 57.6%. Performance scaling cost while using TTS decreased
by 4.44 units.
Measurements for effort and frustration had a increase in scaling cost while using TTS. Effort had a scaling cost increase of 4.22 units while frustration had a scaling cost increase of 6.67 units. This is an increase of 31% while using TTS. Another thing to note is that both of these measurements had the lowest TTS improvements while using 5 UAV’s, with Effort Rating having an improvement of 3.56 units and Frustration Rating 2.22 units.
When asked about their experience, most of the people that answered with a higher frustration and effort rating cited that the mission was far too long. The missions with 3 UAVs lasted about 15 minutes, and the mission with 5 UAVs lasted about 25 minutes. While these missions were designed with a longer duration in mind. The fact that it impacted some of the participants in a noticeable negative manner should be considered in future experiments. Lowering the time or adding more events and interactivity to the test might improve these two measurements further when using TTS.
For the overall perceived workload while operating the system with 3 UAVs, the improvement in overall perceived workload while using TTS was 52% compared to not using TTS. The TTS was only applied on two attributes, the TTS event for emergencies and the TTS event for task change. It could be expanded to cover all the attributes related to the questions inside the SAGAT, this includes battery event, altitude change, map position and the amount of UAVs. The perceived workload when operating 5 UAV systems while using TTS showed a 33% improvement compared to not using TTS. Another thing to note is that the increase in perceived workload when scaling from 3 to 5 UAVs is lower when using TTS. The TTS group showed a increase of 23.92 units when scaling up compared to the non-TTS group’s 28.30 units. This is a decrease in overall scaling cost by 21.7%.
We conclude that the improvement in overall perceived workload outweighs the 6% decrease in situational awareness. By lowering the perceived workload, the chances of a user being burned out by a high workload is lower which in the long run will lead to a less stressed out and more efficient operator. By lessening the mental load of the operator by allowing some pieces of information to be handled by the system, the addition of TTS could improve the productivity of an operator of a UAV system. It should be noted that further tests are necessary to find a good set of events that can be presented to the user through TTS, to keep a good balance between the situational awareness and workload.
9.3.
Problems with testing and recommendations
Some difficulties occurred during the controlled experiment and the weeks leading up to it. Because of the COVID-19 pandemic, physical testing in groups was first restricted and tests were planned to be on site with a single test conductor and a single participant. This changed when the Swedish government changed its restrictions during the month of November, only weeks before testing was supposed to begin, and on site testing was no longer feasible. This resulted in the testing taking place online which created two issues. The first of the issues was that a controlled environment for the experiment was hard to ensure. A participant might have outside factors in their home which could both distract and assist them with the test. This breaks the sanctity of the controlled experiment.
An example of this was one participant had his brother next to him, which he discussed with during the entire second part of the test. When the SAGAT came up the brother helped the participant answer some of the questions. This resulted in the removal of the participant from the study and their result was nullified. Two other participants took phone calls during the testing, and a third participant was playing video games when the SAGAT test popped up. This resulted in them not being able to answer any of the questions inside the SAGAT.
The second problem was getting participants to do the test remotely. Multiple participants who signed up for the initial controlled experiment were unable to partake in the experiment once it was moved from on site to online. This was mostly due to a lack of equipment such as a working computer, stable internet connection or headset. Furthermore, some Participants did not have an environment at home where they could reliably take a one hour test without interruptions or interference from people inside or around their home. This resulted in around 40% of the initial participants dropping out of the trial once the change to remote happened. The number of partic-ipants in the remote trial did eventually recover to its initial size by introducing new particpartic-ipants. The sample size could have potentially been larger and the environment more controlled had these factors not been present.
In future trials the number of SAGAT queries should be increased. Both the number of queries but also the number of queries inside each different level of situational awareness. In the trial there was only one level 3 question, Question 5. By including a more equal distribution of questions from each of the three levels, we ensure that an equal amount of data points are gathered from all of the aspects of situational awareness. Because the trial had a low number of questions there was no way to conduct one or more SAGAT tests with a single operator without them encountering the same question twice. It also makes the use of randomizing the questions impossible, which is a recommendation given inside the SAGAT guidelines. This is the reason for not telling the participants about the SAGAT test in the second mission. The low number of SAGAT queries inside this trial are due to lack of time and prior knowledge of SAGAT and how to form SAGAT queries, as well as due to the small amount of papers inside the UAV field that had published SAGAT queries available.
While text to speech has a clear improvement in the overall perceived workload it’s still unclear how much text to speech a multi-UAV system should use. In future trials, a higher amount of TTS event should be added to cover all the questions inside the SAGAT. In this trial this would include an TTS event for battery and altitude change. This way it can be determined if a weighted bias is created when giving an attribute a TTS event and if so, how many of the attributes should have a TTS event. It is also important to have a bigger sample size of participants in future trials. Two of the questions had one person difference in correct response rate, with a bigger sample size things such as small deviations wont be as big of an issue as in this trial. A bigger sample size would also make it possible to have a group that uses TTS for one mission and one which does not.
10.
Conclusions
To answer research question 1: ”Will the inclusion of text to speech in a multi-UAV system improve the operators situational awareness”. With the inclusion of text to speech the situational awareness of the operator saw an improvement in the questions where there was a TTS event attached, it saw a decrease in almost every other question. The inclusion of TTS resulted in an overall decrease of 6% in situational awareness. Future works might be able to answer if an increase in TTS events might result in an overall increase in situational awareness.
To answer research questions 2:”Will the inclusion of text to speech in a multi-UAV system im-prove the operators overall perceived workload”. The inclusion of text to speech resulted in an improvement in overall perceived workload of 52% during the mission with 3 UAVs and 33% during the mission with 5 UAVs. There was an overall improvement in every single category except for physical rating and an all around better scaling cost in all categories except in frustration and physical when adding more UAVs to the system.
References
[1] S. Hart, “Nasa-task load index (nasa-tlx); 20 years later,” vol. 50, 10 2006.
[2] A. A. E., B. C¸ ¨ur¨ukl¨u, B. Miloradovic, and M. Ekstr¨om, “Planning and supervising autonomous underwater vehicles through the mission management tool,” in Global OCEANS 2020, October 2020. [Online]. Available:
http://www.es.mdh.se/publications/6059-[3] L. Col., J. Eggers, and M. Draper, “Multi-uav control for tactical reconnaissance and close air support missions : Operator perspectives and design challenges,” 2006.
[4] D. Perez Rodriguez, I. Maza, F. Caballero, D. Scarlatti, E. Casado, and A. Ollero, “A ground control station for a multi-uav surveillance system,” Journal of Intelligent Robotic Systems, vol. 69, 01 2012.
[5] I. Maza, F. Caballero, R. Molina, N. Pe˜na, and A. Ollero, “Multimodal interface technologies for uav ground control stations.a comparative analysis,” Journal of Intelligent and Robotic Systems - JIRS, vol. 57, pp. 371–391, 01 2010.
[6] A. Petcher, R. Khazan, and D. Utin, “A usable interface for location-based access control and over-the-air keying in tactical environments,” in 2011 - MILCOM 2011 Military Communica-tions Conference, 2011, pp. 1480–1486.
[7] S. Se, P. Firoozfam, N. Goldstein, L. Wu, M. Dutkiewicz, P. Pace, and J. Naud, “Automated uav-based mapping for airborne reconnaissance and video exploitation,” 04 2009.
[8] M. Endsley, “Endsley, m.r.: Toward a theory of situation awareness in dynamic systems. human factors journal 37(1), 32-64,” Human Factors: The Journal of the Human Factors and Ergonomics Society, vol. 37, pp. 32–64, 03 1995.
[9] ——, “Direct measurement of situation awareness: Validity and use of sagat,” Situation Awareness: Analysis and Measurement, 01 2000.
[10] J. J. Ruiz, A. Viguria, J. R. Martinez-de-Dios, and A. Ollero, “Immersive displays for building spatial knowledge in multi-uav operations,” in 2015 International Conference on Unmanned Aircraft Systems (ICUAS), 2015, pp. 1043–1048.
[11] J. Shirley, “Effects of dynamic automation function allocations on operator situation awareness and cognitive workload in uav control.” 2018.
[12] B. Lim, J. Kim, S. Ha, and Y. Moon, “Development of software platform for monitoring of multiple small uavs,” 09 2016, pp. 1–5.
[13] M. Ilbeygi and M.-R. Kangavari, “A new single-display intelligent adaptive interface for con-trolling a group of unmanned aerial vehicles,” 2019.
[14] M. Endsley, R. Sollenberger, and E. Stein, “Situation awareness: A comparison of measures,” Proceedings of the Human Performance, Situation Awareness and Automation: User-Centered Design for the New Millennium, Savannah, GA, 01 2000.
[15] D. Kaber, E. Onal, and M. Endsley, “Design of automation for telerobots and the effect on performance, operator situation awareness, and subjective workload,” Human Factors and Ergonomics in Manufacturing Service Industries - HUM FACTORS ERGONOM MANUF SER, vol. 10, pp. 409–430, 09 2000.
[16] C. Fuchs, A. Ferreira, J. Sousa, and G. Gon¸calves, “Adaptive consoles for supervisory control of multiple unmanned aerial vehicles,” vol. 8007, 07 2013, pp. 678–687.
[17] M. Endsley, “A systematic review and meta-analysis of direct objective measures of situation awareness: A comparison of sagat and spam,” Human Factors: The Journal of the Human Factors and Ergonomics Society, p. 001872081987537, 09 2019.
[18] NASA, “Nasa task load index: Paper and pencil package.” [Online]. Available:
https://humansystems.arc.nasa.gov/groups/TLX/downloads/TLX.pdf
[19] J. M. Noyes and D. P. J. Bruneau, “A self-analysis of the nasa-tlx workload measure,” Ergonomics, vol. 50, no. 4, pp. 514–519, 2007, pMID: 17575712. [Online]. Available:
![Figure 1: NASA-TLX Scales, Source [1]](https://thumb-eu.123doks.com/thumbv2/5dokorg/4807028.129183/12.892.331.555.129.428/figure-nasa-tlx-scales-source.webp)
![Figure 2: Original GUI, Source: [2]](https://thumb-eu.123doks.com/thumbv2/5dokorg/4807028.129183/13.892.127.767.128.555/figure-original-gui-source.webp)