VTI rapport 594A Published 2007
www.vti.se/publications
Driver distraction
A review of the literature
Publisher: Publication:
VTI rapport 594A Published: 2007 Project code: 40658 Dnr: 2006/0226/26
SE-581 95 Linköping Sweden Project:
Inattention and Drowsiness
Author: Sponsor:
Katja Kircher IVSS (Project leader: Saab Automobile)
Title:
Driver distraction – A review of the literature
Abstract (background, aim, method, result) max 200 words:
Driver distraction has been defined in many different ways. The most important difference is whether only visual inattention or also cognitive inattention should be included. Many different methods have been used to assess the prevalence and types of driver distraction that occur, and to describe the consequences in terms of driving performance and crash involvement. There is strong agreement that distraction is detrimental for driving, and that the risk for crashes increases. Drivers rather opt for repeated glances instead of extending one single glance, if the secondary task demands attention for a longer period of time. However, repeated glances have more detrimental effects on driving performance than a single glance of the same duration as one of the repeated glances. Only recently the method of remote eye tracking has emerged, which enables real time identification of visual distraction. So far this method has mostly been used in driving simulators. Different algorithms that diagnose distracted drivers have been tested with promising results. In simulators it is difficult, however, to induce true distraction, due to the short duration of the experiment and the artificial setting. A prolonged field study under naturalistic conditions could provide new insights and validation of simulator studies.
Keywords:
distraction, eye movements, countermeasure, field study
Utgivare: Publikation:
VTI rapport 594A Utgivningsår: 2007 Projektnummer: 40658 Dnr: 2006/0026-26 581 95 Linköping Projektnamn:
Distraktion och sömnighet
Författare: Uppdragsgivare:
Katja Kircher IVSS, Projektledare Saab Automobile
Titel:
Förardistraktion – En litteraturstudie
Referat (bakgrund, syfte, metod, resultat) max 200 ord:
Förardistraktion har definierats på många olika sätt. Den största skillnaden är om enbart visuell distrak-tion eller också kognitiv distrakdistrak-tion innefattas. Många olika metoder har använts för att undersöka förekomst och typer av förardistraktion och för att beskriva konsekvenserna med avseende på förarbete-ende och olycksinblandning. Det råder enighet om att distraktion försämrar körprestationen och att olycksrisken stiger. Förarna väljer hellre att titta bort från vägen flera gånger istället för att titta bort en gång under en längre stund om sekundäruppgiften kräver uppmärksamhet över en längre tidsperiod. Upprepade blickar bort från vägen leder emellertid till sämre körprestation än en enda blick av samma längd som en av de upprepade blickarna. På senaste tiden har metoden att mäta ögonrörelser kontaktfritt dykt upp, vilken möjliggör identifikation av förardistraktion i realtid. Hittills har denna metod använts mestadels i körsimulatorer. Olika algoritmer som diagnostiserar förardistraktion har undersökts med lovande resultat. I körsimulatorer är det däremot svårt att få fram naturlig distraktion hos föraren, eftersom experimenten vanligtivs är förhållandevis korta och hela situationen är onaturlig. En längre fältstudie under naturliga betingelser skulle kunna skaffa nya insikter och valideringen av
simulatorstudier.
Nyckelord:
Preface
This literature overview was produced mainly as a state-of-the-art report for the IVSS project Inattention and Drowsiness with Saab Automobile as the project leader. The goal of the project is to evaluate a distraction countermeasure that is supposed to direct the driver’s visual attention back to the road when he or she has looked away from the centre forward for too long. The evaluation will be done in the field with a small-scale field operational test (FOT). This will be the first project in which an eye tracker will be used in the field for a longer period of time in order to determine glance direction. The present report focuses on visual distraction. It is concerned with methods that have been used to assess visual distraction and associated findings. Special attention is directed at field studies, and a few large-scale field studies are described in more detail. Furthermore, different algorithms which have been used to assess distraction in real time with eye trackers are presented and discussed. Finally, both theory and
experimental research around distraction mitigation strategies are taken up. I would like to thank my colleagues in the Inattention and Drowsiness project for valuable discussions. Special thanks to Fredrich Claezon (Saab) and Albert Kircher (VTI) who always had a willing open ear for discussions.
Acknowledgement
I am very grateful to Arne Nåbo (Saab) and IVSS for initiating and sponsoring the project, which is a great opportunity to learn more about distraction and working in the field.
Linköping September 2007
Quality review
Review seminar was carried out on 2007-06-15 where Professor Håkan Alm reviewed and commented on the report. Katja Kircher has made alterations to the final manuscript of the report. The research director of the project manager Lena Nilsson examined and approved the report for publication on 2007-09-21.
Kvalitetsgranskning
Granskningsseminarium genomfört 2007-06-15 där Håkan Alm var lektör. Katja
Kircher har genomfört justeringar av slutligt rapportmanus 2007-06-21. Projektledarens närmaste chef Lena Nilsson har därefter granskat och godkänt publikationen för
Table of Contents
Summary ... 5
Sammanfattning ... 7
1 Introduction ... 9
2 Definition of Distraction ... 10
2.1 First International Conference on Distracted Driving ... 10
2.2 Other Literature... 13
3 Methods and Findings Concerned with Distracted Driving... 15
3.1 Laboratory Studies/Driving Simulator Studies... 15
3.2 Test Track Studies ... 16
3.3 Field Studies ... 17
3.4 Visual Occlusion as Distraction Research Method in Simulator and Field ... 26
3.5 PDT as Method in Simulator and Field ... 28
3.6 Questionnaires/Polls/Focus Groups ... 29
3.7 Correlation Studies/Accident Analyses ... 30
4 Glance Behaviour During Driving... 32
5 Glance Duration and Traffic Safety ... 37
6 New Approaches of Measuring Distraction ... 42
7 Distraction Mitigation Strategies ... 45
8 Discussion ... 49
Driver distraction – A review of the literature
by Katja Kircher
VTI (Swedish National Road and Traffic Research Institute) SE-581 95 Linköping Sweden
Summary
Until recently there was no generally accepted definition of distraction, and the most prominent discordance was that some researchers included cognitive inattention in the concept, while others reserved the term solely for visual distraction. In 2005 a large part of the First International Conference on Distracted Driving was dedicated to agreeing on a definition. The resulting definition clearly excludes long-term impairments like
fatigue and alcohol intoxication, and states that the attention must be drawn away from driving towards something else in order to qualify as ”distraction”.
A multitude of methods has been used to assess the prevalence and the types of driver distraction that occur, and to describe the consequences in terms of driving performance and crash involvement. There is strong agreement that distraction is detrimental for driving, and that the risk for crashes increases. Only recently the method of remote eye tracking has emerged, which enables real time identification of visual distraction. So far this method has mostly been used in driving simulators, and different algorithms that diagnose distracted drivers have been tested with promising results.
Earlier research has shown that eye glances away from the road rarely exceed a duration of 2 sec. Most ”normal” glances range from about 0.7 sec. to slightly above 1 sec. In general, drivers rather opt for repeated glances instead of extending one single glance, if the secondary task demands attention for a longer period of time. It has been shown, however, that repeated glances have more detrimental effects on driving performance than a single glance of the same duration as one of the repeated glances. Apparently the drivers look away from the forward roadway again before they are completely back “in the loop”. Consequently, most algorithms that diagnose driver distraction based on glance behaviour do not only consider the most recent glance, but take the recent glance history into account.
Some distraction mitigation strategies have been tested in driving simulators. The drivers were either advised to look back at the road, or the interaction with the
secondary task was terminated by the system. The results of those studies were mixed, and it could not clearly be shown that the countermeasures tested improved driving performance. It has to be noted, however, that the results stem from driving simulator experiments, during which distraction was induced artificially. It is recommended to test both the algorithms used to diagnose driver distraction and the countermeasures in the field with naturalistic distraction.
Generally it is important to focus research on naturalistic distraction because it is not clear how much artificially induced distraction makes the driver ”forget about” driving, or whether it rather resembles dual task performance in which the driver tries to
maximise performance in both tasks and is well aware of the additional demands. A field study with real time eye tracking would be able to shed light on this question and also allow to evaluate a possible distraction countermeasure over a prolonged period of time.
Förardistraktion – En litteraturstudie
av Katja Kircher VTI
581 95 Linköping
Sammanfattning
Fram till nyligen fanns ingen allmänt accepterad definition av distraktion och den största oenigheten låg i att några forskare inkluderade kognitiv ouppmärksamhet i konceptet, medan andra använde begreppet enbart för visuell distraktion. Under 2005 ägnades en stor del av den första internationella konferensen om distraherad bilkörning (First International Conference on Distracted Driving) åt att komma överens om en definition. Den resulterande definitionen utesluter klart och tydligt långvariga nedsätt-ningar som trötthet och alkoholpåverkan samt kräver att uppmärksamheten måste dras bort från körningen och till något annat för att tillståndet ska kallas för ”distraktion”. En mångfald av metoder har använts för att skatta förekomsten av olika typer av förar-distraktion samt för att beskriva konsekvenserna när det gäller körbeteende och olycks-risk. Det finns stor enighet i att distraktion har negativa effekter på körbeteendet och att olycksrisken ökar. Under den senaste tiden har metoden att mäta blickriktning på distans börjat användas mer och mer, vilket möjliggör identifikation av visuell distrak-tion i realtid. Hittills har denna metod mest använts i körsimulatorer och olika algo-ritmer som diagnostiserar förardistraktion har testats med framgång.
Tidigare forskning har visat att blickar bort från vägen sällan tar längre tid än
2 sekunder. De flesta normala blickar åt annat håll har en längd mellan 0,7 sekunder upp till en dryg sekund. Förarna väljer snarare att titta bort flera gånger istället för att titta bort en gång under längre tid om sekundäruppgiften kräver en längre stunds uppmärk-samhet. Man har dock kommit fram till att upprepade blickar bort från vägen försämrar körprestationen mer än en enda blick av samma längd som en av de upprepade
blickarna. Tydligen tittar förarna bort från vägen igen innan de är helt tillbaka ”i loopen”. De flesta algoritmer som diagnostiserar förardistraktion baserat på blickbete-endet tar därför inte bara hänsyn till den senaste blicken bort, utan betraktar även blick-beteendet under de föregående sekunderna.
Några distraktionsvarningssystem har testats i körsimulatorer. Förarna har då antingen fått rådet att titta tillbaka på vägen eller så har förarens interaktion med sekundärupp-giften brutits. Resultaten av dessa studier har varit blandade och det har inte funnits några tydliga indikatorer på att körbeteendet skulle ha förbättrats med de distraktions-varningssystem som testats. Det är viktigt att komma ihåg att resultaten härstammar från experiment som gjorts i körsimulatorer där förarna distraherats artificiellt. Forskarna rekommenderar att testa både algoritmerna som diagnostiserar förardistraktion och distraktionsvarningssystemen i fält där naturlig distraktion förekommer.
Det är viktigt att forskningen fokuserar på naturlig distraktion, eftersom det inte är klart huruvida artificiellt framkallad distraktion låter föraren ”glömma” bilkörningen eller om det snarare blir en ”kombinationsuppgift” där föraren försöker maximera prestationen i båda uppgifterna och är mycket medveten om den förhöjda belastningen. En fältstudie med blickriktningsmätning i realtid skulle kunna belysa denna frågeställning och sam-tidigt möjliggöra en bedömning av en distraktionsvarning över en längre tidsperiod.
1 Introduction
In recent years the interest in distracted driving has grown, even though some researchers started classifying different distractors and their frequency in accident involvement much earlier. Now the media, governments and the public become more and more aware of the problem, especially with the advance of mobile phone use while driving. Wierwille and Tijerina (1998) showed that a relationship exists between the visual demand of in-vehicle systems and accident occurrence, which indicates that systems that are meant to help the driver can also be hazardous, not to mention systems that only have entertainment qualities but do not support the driver with the driving task. Much of the current literature focuses on distraction by in-vehicle information systems (IVIS) or advanced driver assistance systems (ADAS) or so-called “nomad systems”, which include cell phones, laptops and external GPS systems, in other words systems that are not integrated in the car network. Distraction can, however, also come from all kinds of other sources, like passengers, animals or occurrences outside the vehicle.
This report was written with the goal of collecting knowledge on existing research for a project that is concerned with developing and evaluating a distraction countermeasure. The activation of the countermeasure is based on glance behaviour. Two instrumented vehicles, one truck and one passenger car, are driven by eight participants each. Every driver uses the vehicle during one month. During the first ten baseline days no distrac-tion warnings are presented. Then the distracdistrac-tion countermeasure is switched on and the driver receives warnings when the distraction criterion is reached. The main objective of this report with respect to the project was to gather knowledge on visual distraction, which was then used as a basis for building the distraction warning algorithm.
In the first part of the present literature review different definitions of driver distraction are discussed. In the second part different methods for measuring driver distraction are presented and their advantages and disadvantages are considered. Some studies using different methods to investigate questions related to distraction are presented. Special focus lies on studies that measure eye glance behaviour. The influence of looking away from the road on performance measures like speed, lane-keeping and other behavioural variables is examined. Finally a few larger-scale field studies that were at least partially concerned with distraction are discussed, because the method of choice for evaluating the distraction countermeasure mentioned above can be considered a field operational test, albeit small scale in terms of the number of research vehicles. The final chapter deals with the concept of distraction as opposed to secondary task performance.
2
Definition of Distraction
Until recently there was no generally accepted definition for driver distraction. Due to the lack of a common definition, many researchers came up with their own definition or remained vague, which can render it difficult to compare research results directly. Only recently a group of internationally renowned scientists attempted to promote a common definition for driver distraction.
2.1
First International Conference on Distracted Driving
A conference on “Distracted Driving” was held in Toronto in October 2005. Much of the event was devoted to agreeing on a good definition. The following statements are excerpts from the home page of the conference
(http://www.distracteddriving.ca/english/index.cfm?url.language=english).
Tasca’s (2005) paper is centered around defining distraction. He first presents different definitions found in the literature, based on which he develops his own definition. He first quotes a definition by Ranney, Garrott and Goodman (2001):
• Driver distraction may be characterised as any activity that takes a driver’s attention away from the task of driving.
• Any distraction from rolling down a window, over adjusting a mirror, tuning a radio to using a cell phone can contribute to a crash.
• Four distinct categories of distraction exist (but more than one can be active at one time):
• Visual (e.g. looking away from roadway) • Auditory (e.g. responding to ringing cell phone) • Biomechanical (e.g. adjusting CD player) • Cognitive (e.g. lost in thought).
Ranney et al. (2001) specifically include being “lost in thought”. Being “lost in thought” is a phenomenon where the driver directs his attention away from the driving task to his own internal thoughts without being distracted by something external. Here this type of distraction is named ”cognitive distraction”, which could be considered somewhat misleading, as it implies that the other types of distraction presented here are not cogni-tive. It seems safe to assume that distraction always involves ”cognitive distraction”, otherwise it would be an additional activity, a ”secondary task”, performed by the driver while she still consciously tries to attend to the driving task (though possibly with degraded results).
Stutts, Reinfurt, Staplin and Rodgman (2001) as well as Stutts et al. (2003) state that distraction occurs when a driver is delayed in recognition of information needed to safely accomplish the driving task because some event, activity, object or person (both inside and outside the vehicle) compelled or tended to induce the driver’s shifting attention away from the driving task (citing Treat, 1980, p. 21). The presence of a triggering event distinguishes a distracted driver from one who is simply inattentive or “lost in thought”. Thus, these authors explicitly exclude the state of being “lost in thought” from their definition of distraction.
Also Beirness, Simpson and Desmond (2002) see the need to distinguish inattention from distraction. They formulate the following requirements for distraction:
• Need to distinguish distraction from inattention
• Distracted driving is part of the broader category of driver inattention
• Presence of a triggering event or activity distinguishes driver distraction as a subcategory of driver inattention.
Green (2004) states that “driver distraction” is not a scientifically defined concept in the human factors literature. According to him, with driver distraction a layperson means that something is drawing the driver’s attention to a different object, direction or task, which is not concerned with the primary driving task. This means that a distractor grabs and retains the driver’s attention. This statement includes the fact that the attention ”is pulled away” instead of being redirected voluntarily. Therefore secondary tasks, which are performed while the driver consciously tries to distribute his attention between the driving task and the secondary task should be excluded.
After having reviewed the literature review Tasca (2005) proposes his own definition of driver distraction and states that distraction occurs when there is:
• A voluntary or involuntary diversion of attention from primary driving tasks not related to impairment (from alcohol/drugs, fatigue or a medical condition). • Diversion occurs because the driver is:
• performing an additional task (or tasks) or
• temporarily focusing on an object, event or person not related to primary driving tasks.
• Diversion reduces a driver’s situational awareness, decision-making and/or performance resulting in any of the following outcomes.
• collision • near-miss
• corrective action by the driver and/or another road user.
Thus, Tasca does not exclude voluntary secondary task executions, but the category ”lost in thought” seems to be excluded, even though this is not completely clear. Tasca apparently only considers the diversion of attention to be a distraction when the diver-sion results either in a collidiver-sion, a near-miss or a corrective action by the driver or another road user. This means that the driver who by chance did not cause any evasive actions or worse, even though his attention lay elsewhere, would not be classified as having been distracted.
Smiley (2005) describes distraction as “misallocated attention”. She states that it depends on the driver state, the driving task and the driving environment to which extent attention is misallocated. Just as Tasca, she claims that the major reason for distraction to occur at all is that humans are “serial, limited capacity processors of information”, who at times do not prioritise well. She promotes visual search, vehicle control and conflicts and crashes as measures for distraction. Smiley advocates a
broader definition of distraction, including the concept of being “lost in thought”, and including self-initiated secondary tasks. She also includes driving tasks, like looking in the mirror, that are executed in an inappropriate moment.
At the conference on distracted driving a point was made that in many instances a distracted driver does not have both hands on the steering wheel. It is recommended, however, that a driver should always have both hands on the steering wheel, in a safe position, except when operating another essential vehicle control. This point was not stated so clearly in other literature, though. A reason for this might be that much research on distraction involved the drivers’ taking their hand off the wheel, because they were instructed to operate in-vehicle controls. Therefore, if it is not motivated by instruction, taking one’s hand off the steering wheel can be useful as supplementary indicator for distraction.
Another point was that distractions often do not occur in isolation but that more than one “bad habit or technique” are executed simultaneously. In those instances the driving task is likely to be neglected even more.
Hedlund (2005), who summarised the conference, found it essential for distraction that the attention be directed away from driving to something else, which is not internal to the driver but something external (either in the car or outside). Hedlund also included the consequences of distraction in his definition. The consequences are not necessarily an observable manoeuvre, but an increase in risk for untoward situations. He presented the following criteria for distracted driving (slide 3).
• diversion of attention from driving
• because the driver is temporarily focusing on non-driving object, task, event, or person
• which reduces awareness, decision-making, or performance
• leading to increased risk of crashes, near-crashes, or corrective action.
In April 2006 the summary and recommendations of the conference were published, and the following definition of distraction was suggested (Hedlund, Simpson, & Mayhew, 2006, p. 2):
Distraction involves a diversion of attention from driving, because the driver is temporarily focusing on an object, person, task, or event not related to driving, which reduces the driver’s awareness, decision-making, and/or performance, leading to an increased risk of corrective actions, near-crashes, or crashes.
As clarification the following implications of the definition are listed (ibid.):
• Distractions exclude pre-existing conditions, including impairment by alcohol or drugs, fatigue, and psychological state; however, any of these can potentially make it easier for a driver to be distracted or can change the effect of a distraction.
• Distractions may be affected by personal characteristics such as age and medical conditions.
• Distractions may be affected by driving conditions and situations.
• Distractions need not produce immediate consequences such as corrective actions or crashes, but do increase the risk of these consequences.
The conference delegates agreed that this definition provided a sound basis for future research, even though it was deemed necessary to formulate simpler definitions for certain audiences.
2.2 Other
Literature
Other recent literature has been reviewed in order to find more general and operational definitions used in studies of distraction.
Tijerina (2000) differentiates between three types of driver distraction that are relevant for traffic safety: general withdrawal of attention, selective withdrawal of attention and biomechanical interference. The first occurs when the drivers look away from the road. It depends on how long and how frequently the driver looks away from the road
whether this type of distraction becomes dangerous or not. Further down the relation-ship between glances away from the road and safety is described in more detail. The second type of driver distraction, selective withdrawal of attention, is what other authors describe as “cognitive inattention”. It is described as the result of increased cognitive workload and does not involve the driver’s looking away from the road. Tijerina claims that in this state lane keeping and speed maintenance are not affected, but object and event detection can be degraded (see e.g. Haigney & Westerman, 2001). Both visual and cognitive withdrawal of attention lead to a narrowed fuctional field of view and more open-loop instead of closed-loop scanning behaviour (see Jahn, Oehme, Krems, & Gelau, 2005 for further references). The third type of driver distraction, the
biomechanical interference, occurs when the driver moves his body out of the neutral position or takes the hands off the steering wheel. This can delay or hinder the optimal execution of manoeuvres.
Streff and Spradlin (2000) provide a review of some literature on distracted driving. They give the following definition of distraction: ”Distraction in the driving situation can be defined as a shift of attention away from stimuli critical to safe driving toward stimuli that are not related to safe driving” (p. 4). They continue defining ”attention” as: ”Attention is generally defined as the process of concentrating or focusing limited cognitive resources to facilitate perception or mental activity” (ibid.). This definition does not clearly state whether internal thoughts are included or not. The authors focus first on theories on attention and consider ”selective attention”, ”divided attention” and ”sustained attention”. They state that crashes become more likely as drivers purposely attend to stimuli not related to driving safely (selective attention), that they divide their attention between too many stimuli, or that they are being distracted (here described as when attention is focused on something irrelevant to driving unintentionally).
Young, Regan and Hammer (2003) published a literature review on studies concerned with distraction caused by activities or objects inside the vehicle rather than outside the vehicle. They make a distinction between “technology based distraction” and “non-technology based distraction”. The authors say that “driver distraction forms part of the
broader category of driver inattention” (p. 2). They then quote Treat (1980) whose definition is used by the American Automobile Association Foundation for Traffic Safety (see p. 10). Much of the literature presented in the review examines one or seve-ral devices or activities and their influence on driving behaviour. Thus, the assumption seems to be that carrying out activities that are not directly related to the driving task can be subsumed under “distracting activities”. In the report different measures for distraction and their advantages and disadvantages are discussed.
Harbluk, Noy and Eizenman (2002) do not give a definition, but use what they call ”cognitive distraction”. In their study they specifically wanted drivers to watch the road, but to think about something else. Distraction was assumed to occur when the drivers were computing numbers in the head. They focussed therefore, unlike many other authors, specifically on the ”lost in thought” phenomenon, which other authors sort under ”inattention” but not ”distraction”.
Almén (2003) does not give a definition of distraction, but essentially works with the criterion of looking away from the road a certain period of time. She does not record, though, whether her participants really look away from the road, but gives them a secondary task (reading numbers from a display on the passenger’s seat). Two seconds after the onset of the secondary task a warning signal for distracted driving comes. Therefore her operational definition of distraction is that the participants have had a distractor for at least two seconds.
Karlsson (2005, p. 6 f.) uses the following working definition: ”Distraction occurs when a driver is delayed in the recognition of information needed to accurately bound the field of safe travel and the minimum stopping zone because an event (a distractor) external to the driver compelled or tended to induce the driver’s shifting attention away from this information.” He refers to the ”field of safe travel” postulated by Gibson and Crooks (1938) and otherwise uses the definition of Treat (1980) as a basis for his definition.
Brown (2005) did not attempt to distract her participants at all but used occlusion goggles instead, which were shut when the driver arrived at a certain location, such that the driver could not see anything any more. The goggles were shut for not more than two seconds. This was meant to simulate driver distraction. No information is given as to whether the participants rated this method as simulating distraction well. Occlusion as a means of investigating distraction is discussed further below.
Victor (2005, p. 68) defines distraction slightly differently, including the quality of the driving behaviour in the definition: ”Distraction is defined as attention, measured as eye movements, being captured by information that is irrelevant to the driving situation to the degree that a) insufficient attention is left for the primary control task of driving,
and/or b) that driving performance (e.g. lane keeping or speed control) is compromised”
(italics in original). By including driving behaviour a criterion is needed as to when one can speak of compromised performance. This can be different in different environ-ments. It seems inadequate to assume distraction as soon as degraded driving behaviour is noted, which is indicated by the ”or” phrase in the definition, because degraded behaviour can result from many other sources like fatigue, intoxication, inability, etc., which should not be subsumed under distraction.
3
Methods and Findings Concerned with Distracted Driving
In this section findings related to distracted driving are presented. The methodologies with which the effects of distracted driving were assessed vary widely. They range from driving simulator studies over test-track to field studies, and they make use of different methods and measures. Questionnaires, polls and accident analyses are also used. In connection with the results of different studies the advantages and disadvantages of each method will be discussed. Of course the advantages and disadvantages of each method have to be regarded with respect to the goal of the study and cannot necessarily be taken as absolute (Kantowitz, 1992).
3.1
Laboratory Studies/Driving Simulator Studies
Laboratory studies are conducted in a mock-up environment, which, in the case of distracted driving, almost always consists of a driving simulator. The simulator can be a simple computer monitor with a chair in front of it, up to a high fidelity moving base simulator with a real car body included.
The advantages of a simulator study are that the environment can be controlled, such that the situations desired by the experimenters can be presented, and that all partici-pants can be subjected to the same situations. A large number of different situations like different road conditions, illuminations and weather conditions can be studied without having to wait for them to occur in a natural environment. Dangerous situations can be studied, which would not be possible on the road, due to ethical reasons. Results obtained in a high fidelity simulator are often found to be valid for at least certain aspects of real world driving, and usually validation studies exist for those simulators (e.g. Reed & Green, 1999; Törnros, 1998; Törnros, Harms, & Alm, 1997). A further advantage of a driving simulator is that prototypes of warning systems often are easier to build for a simulator than for a real vehicle. Often more precise log data and a larger number of log variables are available.
The disadvantages of a simulator study depend on the quality of the simulator. The less advanced the simulator is, the cheaper to use it usually is, but on the other hand external validity is lost. A more advanced simulator can be very expensive. Participants are obviously aware of the fact that they are being observed, which might lead to a non-natural behaviour. The available time for research in a simulator is usually restricted, therefore it is not clear whether only the novelty effect of a certain measure or device is investigated, or whether the same behaviour would be observed in a long-term study. Also, the number of participants in a simulator experiment is rather limited, therefore it is important to choose representative participants. Especially in relation to distraction simulator studies have drawbacks, which might not be important when investigating other issues. It is difficult to induce distraction, because this is in a sense a contradiction in terms. As time is limited and the participants probably are aware of the test situation and often want to perform well, it is not easy to collect many incidents of “true distrac-tion” within a driving simulator experiment. Therefore secondary tasks are presented to the participants to work as “distractors”. It is not clear, however, whether the behaviour resulting from this corresponds to the behaviour found in “true distraction”, that is, whether there is a difference between “secondary task performance” and “performance while distracted”. For further discussions of the advantages and disadvantages of driving simulators as research tools see Goodman et al. (1997) and Reed and Green (1999).
The literature on simulator studies in connection with some form of distraction is exten-sive. There has been a lot of research of the distracting effects of cellular telephone use while driving (see Kircher et al., 2004, for further references), of how navigation
systems distract the driver (see Tsimhoni, Smith, & Green, 2004, for further references), and so on. Not so many studies were concerned with distraction countermeasures per se, though, where the main point was to induce distraction, to see how to counteract it best. Almén (2003) conducted one study in a high fidelity driving simulator, in which the distractor consisted of a reading task. The participants had to verbally report numbers that were presented on a computer on the passenger seat. A countermeasure was tested, but no convincing effects were found. One conclusion of the study was that it was not easy to induce distraction artificially.
Karlsson (2005) came to a similar conclusion after two simulator studies during which a detection task that was based on a matrix of arrows was used as distractor. This distrac-tor had been developed in the HASTE project (Jamson & Merat, 2005) and is called S-IVIS (surrogate in-vehicle information system). In both of Karlsson’s studies the distractor was “announced” by an auditory signal, to which the participant had to react by performing a visual secondary task. It was found, though, that the participants were well aware of the fact that they took their eyes off the road, so the resulting behaviour was that they tried to fulfil the secondary task but still monitored the traffic as much as they could.
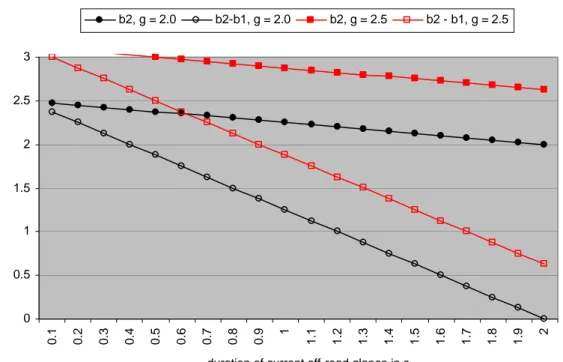
Donmez et al. (2007), however, report an experiment in a simulator in which drivers were distracted by a task that involved matching a character string memorised earlier to what was read on a display. The participants were paid according to their performance on the secondary task. Distraction mitigation strategies were visual two-stage warnings that were given when 2 seconds (first stage) respectively 2.5 seconds (second stage) of off-road glance duration were exceeded according to an algorithm, that took into
account both the current off-road glance duration and a 3 seconds moving average of the accumulated off-road glance duration. The warnings given were either coloured stripes appearing on the display where the secondary task was presented, or LEDs that were lit on the dashboard. SeeingMachine’s product FaceLab was used for real time gaze direction assessment. The authors found their setup to work well, and they do not report any difficulties with experimenter-induced distraction in the simulator.
Zhang, Smith and Witt (2006) conducted an experiment with a relatively similar setup as the one of Donmez et al. (2007), except that they did not warn the drivers when they were distracted but only observed changes in behaviour. Even though effects in driving behaviour could be found that were related to the induced distraction, the authors recommened validation in the field where natural distraction occurs.
3.2
Test Track Studies
A step further towards reality are test track studies, which are performed on a closed course, but while driving a real car. The conditions are more controlled than in a field study. The investigated situations can be more dangerous than in field studies, because surrounding traffic is either absent or controlled.
Similar to simulator studies, though, the participants are usually quite aware of the experimental setting and of being observed, it is not easily possible to perform long-term studies, and the number of participants is approximately as limited as for simulator
studies. Even though they might be less expensive than studies in high fidelity driving simulators, test track studies are still rather costly.
One study, which examined individual differences with respect to distraction in relation to lane exceedences, was performed on a test track (Tijerina, Parmer, & Goodman, 1999). Drivers were distracted from the driving task with a navigation system, on which they had to perform certain tasks. The participants’ performance on a number of
temporal visual perception and cognitive tasks was correlated to driving performance on the test track. It turned out that there were low but consistent correlations between the performance on the track and on the test battery.
Shutko (1999) performed a test track study, in which the participants, who were com-mercial drivers, drove a truck and had to perform a route selection task on an in-vehicle display as distractor. At a certain point empty plastic barrels were released and rolled out in front of the truck. Different collision avoidance warnings were tested.
Again, just as for the simulator studies, it is not the aim to wait until the participants get distracted “naturally”, therefore they are distracted artificially. The question of external validity with respect to distraction arises again. For many purposes these approaches still are reasonable. However, if the object of interest is a distraction countermeasure it is of paramount importance to be sure that the driver is distracted naturally.
3.3 Field
Studies
A field study is the method that is closest to real driving, and it therefore has high external validity. The possibility to control the environment is relatively limited, and participants cannot deliberately be exposed to dangerous situations. There are many possible variations of field studies, some of which are described below.
Time frame: The studies can be short, lasting only for a single drive, as has
been the case for most field studies up to now, but a more extreme field study, the 100-car study, which is described in more detail below, lasted for more than one year (Neale, Dingus, Klauer, Sudweeks, & Goodman, 2005). Therefore, in principle, field studies make it possible to investigate long term effects of certain measures under natural conditions. At the Virginia Tech Transportation Institute (VTTI) further large-scale field studies are underway and in planning. While VTTI focuses on observing driving behaviour without intervening measures, it is also possible to study “before and after” effects in the field. To this end especially the University of Michigan Transport Research Institute (UMTRI) conducted several field operational tests (FOTs) where the participants received an instrumented vehicle for between two and six weeks. Typically the participants use the vehicle first with deactivated driver support system, which is switched on after a certain time period. Currently a large FOT called Integrated Vehicle-Based Safety Systems (IVBSS) involving both passenger cars and trucks with the goal to evaluate an integration of several collision avoidance warning systems is in preparation (Sayer, 2006).
Informed participants: Field studies can be conducted with recruited participants that usually drive instrumented vehicles. In this case approximately the same restrictions with respect to number of participants apply as for the simulator and test track studies. Again, the 100-car study is a notable exception with 109 recruited drivers. In this study 80% of the participants drove their own cars which had been instrumented. The ACAS FOT in Michigan had almost 100 participants (Sayer, Mefford, Shirkey, & Lantz, 2005). Each participant received one of eleven similar cars and drove it for four weeks.
Other types of field studies are performed without the parti-cipants’ being informed, for this kind of study the collected data are usually relatively limited and focus on macro-level data (e.g. Vogel, 2002). Typically speed measurements or headway measurements are collected. This latter type of field study is not suitable for research on distracted driving.
Experimenter: Field studies can be conducted with or without an
experi-menter in the car. Having an experiexperi-menter in the car increases the participants’ awareness of being studied, but is often necessary for instructions, operating equipment, data collec-tion, and for safety reasons. In some field studies the experi-menter also acts as observer and logs the participants’
behaviour. Long-term studies are usually conducted without an experimenter in the car, but the cars tend to be equipped with multiple data logging systems that ideally should be hidden from the participants’ and the other road users’ view.
Naturalistic/FOT: In recent years with a growing number of larger-scale field
studies being conducted and planned a discussion has come up regarding the nomenclature of the different types of studies. It was suggested to view these types of tests as lying somewhere on a continuum from completely naturalistic to more experi-mental in design. In the former approach the participants ideally drive their own vehicles without any further instruc-tions, and the data collection process should be as discreet as possible in order to avoid changes in behaviour due to being observed. The goal is to study driving behaviour as it is. In the case of the 100-car study one goal was to collect naturalistic pre-crash data. A FOT on the other hand involves a baseline data collection phase where the participants drive without special instructions, and a “treatment phase”, involving for example an ITS device in the car or some kind of special instruction to the driver. Here the goal is to examine the effects of the treatment on driving behaviour in a within-subjects design.
Harbluk, Noy and Eizenman (2002) examined so-called “internal distraction” in real traffic by letting their participants compute numbers in the head (via a handsfree telephone). They found narrowed scanning behaviour and reduced scanning of instru-ments and mirrors with increasing cognitive workload in their participants. A good
review of further studies that examine the effects of talking on the phone and of using navigation systems is provided by Young, Regan and Hammer (2003).
Many studies investigating the effects of the use of navigation systems and cellular telephones as well as other IVIS implicitly study driver distraction, but the distraction was always induced by the experimenter in some way or another, and is not “natural”. The exceptions in which natural distraction was observed, were the 100-car study conducted around Washington DC in the United States (Neale, Dingus, Klauer, Sudweeks, & Goodman, 2005), the ACAS FOT study, conducted in Michigan in the United States (Sayer, Mefford, Shirkey, & Lantz, 2005) and the RDCW FOT also conducted in Michigan (Sayer, Devonshire, & Flannagan, 2005). Even though those studies did not specifically focus on distraction, valuable insights into driver distraction and driving performance related to safety was gained. The three studies are described in more detail below.
3.3.1 The 100-car Naturalistic Driving Study
The National Highway Traffic Safety Administration (NHTSA) and the Virginia Department of Transportation (VDOT) in the USA commissioned the so-called 100-car naturalistic driving study, in order to collect naturalistic pre-crash data, and generally to collect a large amount of naturalistic driving data. The study was conducted by the Virginia Tech Transportation Institute (VTTI). The full report on the experimental design phase (Neale et al., 2002), an overview of the design and the results (Neale, Dingus, Klauer, Sudweeks, & Goodman, 2005), the full phase-II results report (Dingus et al., 2006), a report on the impact of inattention on crash risk (Klauer, Dingus, Neale, Sudweeks, & Ramsey, 2006) and a report on the relative risk of potentially unsafe driving behaviour (Klauer, Sudweeks, Hickman, & Neale, 2006) are available. Around 80% of the participants drove their own cars (which had been instrumented for the study) during the period of one year, the others received leased vehicles. Altogether around 42300 hours of driving, that is, almost five continuous years of driving, were sampled. The collected data were speed, lateral and longitudinal acceleration, headway, presence of side obstacles, video recordings of five cameras (driver’s face and driver’s side of vehicle, passenger’s side of vehicle outside of car, forward view, rear view, over-the-shoulder view of the driver’s hands and surrounding area), GPS data and others. The cameras recorded at 30 Hz, the compression algorithm reduced the actual number of unique frames to around 7.5 frames/second. The drivers could press a button in order to flag incidents.
The selection of participants followed several practical reflections. In order to increase the probability for rear-end crashes young and male drivers should be overrepresented (though they were not, in the end). The desired average mileage was high (27,000 miles per year), and the selected research area was Washington DC urban area. Only drivers with prior crash involvement were considered, and they were preferred when they had occupations necessitating extensive urban driving.
In the study 82 crashes, of which 15 were police-reported, 761 near-crashes and 8,295 incidents were registered. For 13 of the crashes log data were incomplete, because the acquisition system was still in the start-up phase. It was stated that the drivers “soon” forgot about the instrumentation of the vehicles. It was speculated that one hour of driving time with the newly instrumented vehicle was enough in some cases, which was derived from the drivers’ engaging in dangerous behaviour, among other things. Of all
drivers, 7.5% never experienced an event of any severity, but the same percentage was involved in many incidents and 3 or 4 crashes.
In order to find crashes, near-crashes and incidents in the data, trigger criteria for certain variables were determined with the goal to miss not more than 10% of such events while reaching a false-alarm rate of less than 30%. The falsely identified events were later discarded by the data reductionists. The final triggers are presented in Table 1. It turned out that due to the high variability in driving style more than 110,000 triggered events had to be viewed in order to identify real 9,125 events. It has to be noted that 965 of those events could be attributed to only two of altogether 109 primary and 132 addi-tional drivers.
Apart from this event database, a baseline database was created, which was stratified according to vehicle involvement in events. Thus, a vehicle which was involved in three per cent of the crashes, near-crashes and incidents would provide three per cent of the baseline epochs. It has to be noted that four vehicles that were not involved in any inci-dent were, thus, not represented in the baseline data at all. The baseline epochs were randomly selected film segments of six seconds duration during which the vehicles maintained a speed of at least 5 mph (ca. 8 km/h). Those epochs could be compared to the six seconds around an event (five seconds before until one second after) in order to determine the relative frequency of activities during events and during baseline driving. For 5,000 of the 20,000 baseline epochs video based eyeglance analyses were per-formed frame by frame.
Table 1 Event triggers used in the 100-car study, adapted from Klauer et al. (2006, p. 11).
Trigger type Description
lateral acceleration lateral motion ≥ .7 g
longitudinal acceleration acceleration or deceleration ≥ .6 g acc. or dec. ≥ .5 g and forward TTC ≤ 4 s all longitudinal decelerations between .4 g and .5 g coupled with a forward TTC value of ≤ 4 s and that the corresponding forward range value at the minimum TTC is not greater than 100 ft
event button activated by the driver forward time to collision
(instrumented vehicle and vehicle in front)
see longitudinal acceleration (only used in combination with longitudinal acc.) rear time to collision
(instrumented vehicle and vehicle behind)
any rear TTC trigger value ≤ 2 s that also has a corresponding rear range distance of ≤ 40 feet
any rear TTC trigger value in which the absolute acceleration of the following vehicle ≥ .3 g
yaw rate any value ≥ 4-degrees change in heading that is followed by another ≥ 4-degrees change in heading in the other direction
Engagement in “secondary behaviour” was found in 73 per cent of the baseline epochs. It has to be noted, though, that drowsiness, unspecific eyeglances and so-called “driving related inattention”, which includes checking the mirrors and the speedometer, are in-cluded in this number. “Secondary task engagement”, that is, an action specifically decicated to something not driving related, was found in about 55 per cent of the baseline epochs either alone or in combination with one of the “secondary behaviour” categories mentioned before.
Based on the results of their analyses, Neale, Dingus, Klauer, Sudweeks and Goodman (2005, p. 6) postulate that “driver distraction has to be expanded to a more encompas-sing ‘driver inattention’ construct, that includes secondary task engagement and fatigue as well as two new categories, ‘Driving-related inattention to the forward roadway’ and ‘non-specific eye glance’” (italics in original). Driver-related inattention means, that the driver checks e.g. the mirrors or their blind spots, but fails to pay attention to the for-ward roadway, where something critical is happening. The non-specific eye glance category comprises of glances away from the road, but at no specific object. They are usually only momentary, but the data “suggested that driver’s glances away from the forward roadway potentially contribute to a much greater percentage of events than has been previously thought” (ibid., p. 7).
In the study 78 per cent of the crashes and 65 per cent of the near crashes were classi-fied as having one of the four categories mentioned above as contributing factor. “Secondary task engagement” was the largest category, followed by “driving-related inattention”. These two categories were present during baseline driving with around the same percentages, however. An odds-ratio calculation revealed that moderate to severe drowsiness increased the likelihood for at-fault crashes and near-crashes more than sixfold, while the performance of complex and moderate secondary tasks increased the likelihood two- to threefold.
Analyses were performed to examine how “eyes off forward roadway” and near-crash/ crash risk were related to each other. The variables that were studied are presented in Table 2.
Table 2 Eyes off forward roadway metrics as used in the 100-car study, adapted from Klauer et al. (2006, p. 100).
Eyes off forward roadway metric operational definition
total time eyes off forward roadway the number of seconds that the driver’s eyes were off the forward roadway during the 5 seconds prior and 1 second after the onset of the precipitating factor
number of glances away from the forward roadway
the number of glances away from the forward roadway during the 5 seconds prior and 1 second after the onset of the
precipitating factor length of longest glance away from the
forward roadway
the length of the longest glance that was initiated during the 5 seconds prior and 1 second after the onset of the precipitating factor
location of longest glance away from the forward roadway
the location of the longest glance (as defined by length of longest glance) – location is based upon distance (in
degrees) from centre forward and is in one of three categories: < 15°, between 15° and 30°, > 30°
It has to be noted that no clear definition of “off the forward roadway” could be found in the report, and that there are varying definitions of the time window used (5 s prior to 1 s after the onset of the incident versus the period of 6 s before the onset of the inci-dent). Furthermore, the “location of longest glance away from the forward roadway” was subdivided in categories based on 15°-steps in the definition, whereas in the text 20°-steps were used (below 20° away from centre forward, between 20° and 40°, more than 40°). Generally no distribution parameters are given for the presented results. For 40% of the crashes drivers did not look away from the forward roadway from 5 s prior to 1 s after the onset of the conflict. The accumulated average time of the drivers’ looking away from the forward roadway was around 1.8 s for crashes, around 1.25 s for near-crashes, around 1.05 s for incidents and around 0.85 s for baseline driving for the 6 s prior to the onset of the conflict. All differences were significant. Odds ratio calculations showed that the near-crash/crash risk more than doubled when the total time during which the driver’s eyes were off the forward roadway exceeded 2 s of 6 s. The mean number of glances away from the forward roadway within the period of 5 s prior to 1 s after the onset of the conflict was slightly above 1.4 for crashes, around 1.3 for near-crashes and incidents, and around 1.1 for baseline driving. It is stated that the differences between near-crashes and baseline and between incidents and baseline were significant, but no clear statement is made for the difference between crashes and baseline.
The mean length of the longest glance away from the forward roadway lay above 1.6 s for crashes, slightly below 1.2 s for near-crashes, slightly below 1 s for incidents and
slightly below 0.8 s for baseline driving. The differences were statistically significant for all pairs.
The results for the location of the longest glance show that for crashes and near-crashes the area between 20° and 40° is overrepresented. For incidents and baseline driving a larger percentage of the longest glances away from the forward roadway is directed at objects within 20° of centre forward, but also further away than 40° of centre forward. It has to be noted, however, that the duration of the longest glance was much shorter during baseline driving and for incidents as compared to crashes and near-crashes. This might allow the speculation that the longest glance for the latter two event types was not planned.
Especially with reference to rear-end crashes the authors suggest that distraction countermeasures could have large benefits (Neale, Dingus, Klauer, Sudweeks & Goodman, 2005, p. 7): “Of particular interest in the analyses of rear-end conflict contri-buting factors was the prevalence of distraction. An important aspect in rear-end crash countermeasure development is the degree to which an un-alerted driver can be warned and make a proper response.” This statement is based on the fact that in 13 out of 14 crashes involving the instrumented vehicle and the vehicle in front inattention to the
forward roadway was a contributing factor.
A canonical discriminant analysis was conducted on all 20,000 baseline epochs in order to find out whether driving performance indicators were able to discriminate between attentive and inattentive driving, that is, whether the driver is engaged in a secondary task or not. The variables used in the discriminant analysis can be found in Klauer et al. (2006) on page 112. It was found that the best predictors only accounted for less than one per cent of the variance associated with inattentive and attentive driving, and the analysis could not classify the epochs better than chance. The authors conclude that even though there are differences between inattentive and attentive driving those variables cannot explain them.
From the host of results obtained from the 100-car study the following are seen as especially relevant for the planned field operational test with a distraction warning system. It is shown that the visual behaviour of the driver is not only related to driving performance measures, but it is related to crash involvement. Crash risk increases when the driver looks away from the road for more than two seconds within a time span of six seconds. It is clearly stated that a distraction countermeasure could be beneficial for traffic safety. Furthermore, it was difficult to find patterns in the log files through which traffic incidents could be identified reliably. Additional video filming of the driving scene is therefore essential.
3.3.2 Field Operational Tests at UMTRI
The University of Michigan Transportation Research Institute (UMTRI) conducted several large-scale field operational tests (FOT). They involve typically around 50 to 100 lay drivers who are asked to use an instrumented car as they would use their own for about four to six weeks. Usually during the first quarter of the trial baseline data are sampled, that is, the cars function just like standard cars, apart from that they con-tinuously collect data. When the baseline period is over a driver support system is activated automatically and remains on for the remainder of the study. Among the systems tested are adaptive cruise control and forward collision warning (ACAS-FOT described below) and road departure crash warning systems (RDCW-FOT described below). Even though field operational tests of this kind usually have the purpose to
investigate the performance of the tested support system and possible changes in driving behaviour as reaction to system activation the large amounts of collected data also provide material for investigations of naturalistic driving behaviour. Below two of the field operational tests conducted at UMTRI are described in more detail, because reports concerned with driver distraction have been published based on the data collected during those studies.
ACAS-FOT
During the Automotive Collision Avoidance System Field Operational Test (ACAS FOT, the project was begun in June 1999 and completed in November 2004) 96 age-stratified, randomly chosen drivers in Southern Michigan used a prepared ACAS vehicle for four weeks. The vehicles were equipped with an adaptive cruise control system (ACC) and a forward collision warning system (FCW). The primary goal of the study was to investigate whether adaptive driver assistance systems would lead to increased driver distraction, operationalised by secondary activities of the driver. The secondary goal was to investigate how well drivers accepted a forward collision
warning system and an adaptive cruise control system, when they had the chance to test it for a while under real conditions in the field.
For the first week the driver assistance systems were switched off, only conventional cruise control, which is a feature found in most North American cars, was available. The data of this week were used as baseline. After the first week the systems were switched on automatically and remained on for the remainder of the time.
Each driver’s face was filmed by a camera pointing towards him or her, and the forward driving scene was filmed, too (1 Hz). For each driver clips of four seconds were
sampled every five minutes at 10 Hz.
During the 12 months of field trials 137,000 miles were covered. The average trip length was 12 miles, although many trips were shorter than one mile and some exceeded 100 miles. 75 percent of all travels occurred in well-lit conditions, while 25 percent occurred in the dark. The oldest age group travelled slightly longer (38% of the total mileage) than the other two age groups (each 31% of the total mileage). Half of the mileage was driven on freeways. It was found that there were large individual differen-ces with regard to personal mileage and how the trips were distributed (type of road, time of day, etc.).
It was found through data analysis and interviewing the participants that the drivers had experimented with the systems to test their functionality. Even though they had been asked to limit experimenting to the first few days with the system, there were instances when the system functionality was tested or demonstrated later on, too, especially when new passengers were in the car. In general, experimenting behaviour seemed to have subsided by the third week of system availability.
Sayer, Mefford, Shirkey and Lantz (2005) examined a random sample of 5% of the four second 10-Hz-clips for 66 drivers, stratified by week. Only clips in which the speed lay above 25 mph (40 km/h) were included. The goal was to establish whether the
prevalence of secondary behaviour, that is, behaviour not related to the driving task, increased with the presence of adaptive driver assistance systems or not. To this end the selected 890 clips were coded by trained research assistants into containing no
secondary behaviour or containing such behaviour, and which kind. The general result both for the introduction of FCW and ACC was, that the only increase in secondary
behaviour could be found for “conversation with passenger”. This was interpreted such that the drivers were excited to tell their passengers about the new system.
In total almost 20% of the analysed video clips included secondary behaviour. As the duration of the secondary behaviour was neither taken account here nor in the 100-car study it is reasonable to multiply the value obtained here with 1.5 for comparison with the 100-car study, because the reviewed ACAS-FOT clips had a duration of 4 s while the 100-car epochs had a duration of 6 s. The adjusted ACAS-FOT value of almost 30% still lies substantially under the 55% of secondary task engagement during baseline driving in the 100-car study. One possible explanation might be the fact that the analysis in ACAS-FOT excluded video clips at speeds below 40 km/h. It is thinkable that drivers engage more in secondary tasks while travelling at low speeds, but the liability to eng-age in secondary tasks was not broken down into different speeds in any of the studies. A full description of the study can be found in Ervin et al. (2005a; 2005b).
RDCW-FOT
During the Road Departure Crash Warning Field Operational Test (RDCW-FOT) 78 lay drivers produced 133,290 km naturalistic driving data. More than 500 variables were sampled at either 10 or 20 Hertz. The study is described in detail in LeBlanc et al. (2006a; 2006b). A report with the purpose to examine the effects of secondary tasks on naturalistic driving performance was published (Sayer, Devonshire, & Flannagan, 2005). For a stratified subset of altogether 36 drivers 1,440 video clips of five seconds duration were analysed (10 clips in each of 4 weeks for each of the 36 selected drivers). The minimum speed criterion was the same as for the ACAS FOT (> 40 km/h). It was ensured that the clips did not include situations in which the drivers received lateral drift or curve speed warnings. In the RDCW study secondary task engagement was found during 34% of the clips. The most frequently observed behaviour was “conversation with passenger” (15%), followed by “grooming” (6.5%) and “hand-held cell phone use” (5.3%). Not many of the clips stemmed from local roads and ramps, most likely due to the speed restriction. There seems to be a tendency, however, that drivers engage slightly more often in secondary tasks on “slower roads” than on limited access roads, which might support the notion that slower speeds are a contributing factor to secondary task engagement.
Manual glance analyses were made based on the 5-second video clips. During 61% of the clips at least one glance away from the forward scene could be observed, which lasted for .73 s on average. In 37% of the clips a second glance was observed which lasted for .79 s on average. The percentage and duration of the first and second glance away from the road were broken down into different secondary tasks, including “no secondary task performance”. Of all those categories “using a cell phone” resulted in the fewest glances away from the forward scene (54% of all clips for the first glance) and the shortest glances on average (.55 s). The highest percentage of clips with glances away from the forward scene was found for eating and drinking. The longest average glance duration was found for the category that included all other activities that did not belong to either conversation, grooming, cell phone use, eating/drinking or multiple activities and amounted to .87 s. Grooming followed with an average glance duration of .82 s The differences between the glance durations for first glances were not significant, however.
The effect of secondary task engagement on driving performance parameters was investigated, too. It was found that secondary task engagement led to significantly
increased steering angle variance in comparison to driving without performing a secondary task. Phone use while driving was associated with the highest steering angle variance, even though the glances away from the forward scene were shorter than for any other category. No easily interpretable results were found for the effect of
secondary task engagement on the standard deviation of lateral position (SDLP) and on mean throttle position and variance. Telephone use sticks out again when looking at speed control. Especially in clips during which the brake was engaged the mean speed variance was lower than for all other secondary task categories, including “no secondary task”. Also when the driver did not brake, speed variance was relatively low during phone use as compared to the other categories.
The UMTRI-studies demonstrate, just as the 100-car-study, that secondary task engage-ment is frequent during driving. Valuable insights about natural glance behaviour are obtained. Again, however, it can be seen that manual glance analysis is very cumber-some and time consuming. Therefore advance of remote eye trackers is promising for this type of research.
3.4
Visual Occlusion as Distraction Research Method in
Simulator and Field
Visual occlusion is a method that has been used in driver distraction research in many different ways. Visual occlusion is defined as “the physical obscuration of vision for a fixed period of time” (Gelau & Krems, 2004, p. 185). The theory behind the technique is that driving is a task with high visual demands (Sivak, 1996). Visual occlusion is considered to be a method with which it is possible to assess both the visual demands of driving and the visual demands of in-vehicle displays and the like. Furthermore, it is used to simulate distraction, and different occlusion intervals are used in order to assess whether a task can be interrupted without detrimental effects or not. The two parameters that can be manipulated are the presentation or inspection time, that is, the time during which the relevant information is visible, and the occlusion time, which is the time during which vision is obscured. It is possible to let the participants control for how long they want to view their task in order to determine task demands and possible intraindividual differences. Another possibility is to set the intervals at fixed values and observe changes in behaviour and performance decrements. Depending on the setting, the participant can either receive a secondary task during the occlusion periods or have one’s vision completely obscured.
Different methods have been used to occlude the driver’s view. One of the first devices were mechanical shutters attached to a baseball helmet. More modern devices prevent issues like re-accomodation concerns and light intensity problems by using a polarising filter during occlusion, which can be switched on very rapidly, and which does not change light intensity substantially. Other methods would be an interruption in the presentation of a simulated driving scene or of a display presented on a monitor. Historically the first ones to use the occlusion technique to study drivers’ visual
behaviour were Senders, Kristofferson, Levison, Dietrich and Ward (1967). They found that longer occlusion periods lead to lower maximum speeds, and that curve negotiating places additional visual demands on the driver, but the studies have received some criticism on methodological grounds (Lansdown, Burns, & Parkes, 2004). The partici-pant numbers were limited, and conclusions were drawn based on experimenter’s judge-ment instead of on objective data.