Akademin för Innovation, Design och Teknik
Towards dynamic performance
measurement systems
Master Thesis Work, Innovation and product realization
30 HP, advanced level
Product and Process Development
Mohammed Salloum
Presentationsdatum: 18 maj 2010
Uppdragsgivare: Volvo Construction Equipment Handledare (företag): Catrin Mattsson
Handledare (högskola): Magnus Wiktorsson Examinator: Magnus Wiktorsson
E
XECUTIVE
S
UMMARY
The purpose of this report is to single out the most critical aspects for evolving and dynamic performance meausrement systems. The report concludes that the existence in practice of theoretically important aspects are diverse and that the most appropriate way of governing the aspects are through the creation of a performance management process. The theoretical chapter is established for dual purposes. The first is to give the reader a comprehensive understanding of what has been done in the field of performance measurement and management so far and the second is to answer the first research question imposed.
The empirical chapter investigates to what degree the existence of factors singled out in theory are present in practice. Two extensive case studies are presented. Further, the chapter also answers research question two.
Finally, the result and analysis chapters focuses on cross-analysing the case studies made and to generate a recommendation. Research question three is answered under these headings.
A
CKNOWLEDGEMENTS
This one year journey has been more giving than I could have ever imagined. Just as a former PhD student warned me about before initiating this report, there has been ups and downs. I would like to show my appreciation for the people supporting me during this rollercoaster ride.
First of all, I would like to acknowledge my academic supervisor Magnus Wiktorsson for his guiding throughout the PREPARE year. Special thanks to Markus Bengtsson and Annette Brannemo at Volvo CE for their support. I am grateful towards the managers at Volvo CE for taking their time and participating in my empirical studies. Further, I would like to take the opportunity and thank all my peers at the PREPARE programme, I highly appreciate all the fruitful discussions we have had over the course of this year.
Last but not least I would like to thank my family for their unconditional support and love. a special thanks to my brother, Ali, for his help and understanding at times when the report was taking the better out of me.
Mohammed Salloum, Eskilstuna, 2010
T
ABLE OF CONTENT
EXECUTIVE SUMMARY ... III ACKNOWLEDGEMENTS ... IV
TABLE OF CONTENT ... V
INTRODUCTION AND POSITIONING ... 1
1.1BACKGROUND ... 1 1.2PROBLEM DESCRIPTION ... 2 1.3PURPOSE ... 3 1.4RESEARCH ... 3 1.5DELIMITATIONS ... 3 1.6EXPECTED RESULTS ... 4 RESEARCH METHODOLOGY ... 5 2.1METHOD ... 5 2.2RESEARCH APPROACH ... 6 2.3RESEARCH PROCESS ... 8
2.4STRATEGIES FOR DATA COLLECTION ... 8
2.5DATA COLLECTION ... 9
2.6ANALYSIS OF DATA ...13
2.7VALIDATION AND QUALITY ASSURANCE ...14
FRAME OF REFERENCE ...17
3.1DEFINITIONS ...17
3.2WHY PERFORMANCE MANAGEMENT? ...18
3.3AHISTORICAL APPROACH ...19
3.3.1 Henry Ford and Taylorism ... 19
3.3.2 Human Relations Movement ... 20
3.3.3 Toyota and Total Quality Management... 21
3.3.4 Non-financial performance measures ... 22
3.4ANALYSIS OF RESEARCH MADE ...23
3.5PERFORMANCE MEASUREMENT SYSTEMS ...24
3.5.1 The Performance Measurement Matrix ... 24
3.5.2 Sink and Tuttle Model ... 25
3.5.3 TOPP Performance Model ... 27
3.5.5 The Performance Prism ... 30
3.5.6 The Performance Pyramid ... 32
3.5.7 Medori and Steeple’s Framework ... 33
3.6CRITICAL ASPECTS FOR DYNAMIC PERFORMANCE MEASUREMENT SYSTEMS ...34
3.6.1 On-going management ... 36 3.6.2 Evolution ... 37 3.6.3 Alignment ... 38 3.6.5 Pre requisites ... 39 EMPIRICAL STUDIES ...41 4.1CASE COMPANY A ...41
4.1.1 Case study objective... 41
4.1.2 Methodology ... 42
4.1.3 Results ... 42
4.1.4 Discussion ... 43
4.2 Case Company B... 47
4.2.1Case study objective... 47
4.2.2 Methodology ... 47
4.2.3 Results ... 48
4.2.4 Discussion ... 49
4.3CROSS-CASE ANALYSIS ...51
4.4RECOMMENDATION ...55
4.4.1 On-going management ... 55
4.4.2 Alignment ... 56
4.4.3 Evolution ... 56
4.4.4. Performance management process ... 57
CONCLUSIONS AND FUTURE WORK ...61
5.1CONCLUSION ...61
5.2FUTURE WORK ...62
I
NTRODUCTION AND POSITIONING
This chapter aims to generate an understanding of why the research project has been executed and the importance of it. The chapter is structured with a traditional background and problem description that gives the reader a solid base. Furthermore the chapter describes the purpose of the project and formulates the research questions. Ultimately the boundaries, researcher’s role and the expected outcome are discussed.
1.1BACKGROUND
The volatile market situation for construction equipment in combination with the rapid decline of demand for Volvo Construction Equipment (VCE) products has accelerated the pressure for a more responsive measurement system. Paradoxical, the current way of managing performance at VCE Operations Eskilstuna is flawed from several points of view.
The performance measurement system at VCE Operations Eskilstuna lacks a supportive management process linking top and bottom levels of the organisation creating a critical gap in the cascading of strategies and goals. The short term consequence have been lagged decision-making and ad-hoc solutions surrounding performance related issues. The long term consequence will most likely be costs of restructuring due to the vague continuous management and maintenance of the measurement system. The restructuring would involve actions to
update information systems for data collection and actions to revise measures due to strategic and organizational change. A performance measurement system without the capability of dynamic adjustment to contextual change is not efficient. Further, with the linking process between the macro and micro levels of performance management absent, the risk of managing the company with biased and misguiding measures is impending.
Operation Eskilstuna is seeking to attain a performance oriented culture and has initiated several concepts with the purpose of rolling out a new company culture. However, the sheer quantity of the frameworks has caused perplexity within the organisation and has accentuated the absence of an all-embracing performance management process. Further, the lack of integration between the strategic and financial processes has amplified perplexity.
The deficiencies mentioned above make it difficult for the company to manage and communicate strategy. The shortcomings become even more obvious in sharp cyclical fluctuations and rapid organizational change. The non-existence of a documented process of working and evaluating measures is obvious. Each department has implemented a specific way of working and definitions in regards to partial measurements often differ between departments.
The organization has a strongly goal-oriented culture and this is a crucial part of the problem. Working purposefully with biased measures increases the risk of steering the organization towards the wrong direction.
1.2PROBLEM DESCRIPTION
There is a clear demand for an evolving measurement system in both academia and industry. The demand seeks a measurement system robust to non-relevant interference but simultaneously sensitive to relevant changes. The non-existence of a performance management process at VCE Operations Eskilstuna makes the evolution of the measurement system ad-hoc.
1.3PURPOSE
The purpose of this study is to define and formulate an evolving and dynamic measurement system for VCE Operations Eskilstuna.
1.4RESEARCH
In order to develop a performance management process, the following research questions has been defined.
RQ1 – what are the critical aspects of an evolving and dynamic performance management system?
RQ2 – What specific improvements of the critical aspects are needed at Volvo CE Operations Eskilstuna?
RQ3 – What is needed to implement the improvement of the critical aspects at Volvo CE Operations Eskilstuna?
1.5DELIMITATIONS
The project is part of a one-year research programme named PREPARE. The programme is created through collaboration between Mälardalen University, the KK foundation and the region of Mälardalen. The research is conducted in an interactive environment where study and work are executed at both university and workplace interchangeably. Furthermore, during the research programme the researcher's work tasks at Volvo CE are linked to the project. As a participant of PREPARE the researcher's role is to create knowledge that is relevant both for academia and industry with an emphasis on the industrial relevance.
The delimitation will cut at the performance management process. It is of utmost importance to stress this due to the fact that most large corporations have employed balanced score cards to measure cascading strategic objectives. These score cards are as often built up by multiple key performance indicators with vague boundaries. Further, the
exercises of choosing the measures and validating the hypothesis on which the strategy rests is out of the scope.
1.6EXPECTED RESULTS
The expectation is that the report will contribute to a map of the critical aspects of an evolving and dynamic performance management system. Furthermore, the ambition is that the research will investigate to what extend the essential aspects has been implemented in practice. A final expectation is that the current performance management structure at Volvo Construction Equipment will be altered towards the findings of this report.
R
ESEARCH METHODOLOGY
This chapter intends to highlight the researchers' scientific views. Furthermore, the chapter aims to present and justify the choice of research through a discussion that includes strategies for data collection. Finally, the chapter will present the methodology for quality assurance.
2.1METHOD
In the PREPARE research initiave with Mälardalen University, KK-foundation and a selected league of industrial companies in the region of Mälardalen, the research purposes to present results relevant to both academia and industry. In order to create dual relevance the research ought to move constantly between practice and theory in an iterative process combining theory with real world contact (Fagerström, 2004). This approach is of essence to obtain the requested relevance (See Figure 1). In order to create common knowledge, interactive research will be conducted. The researcher will study together with practitioners (Brulin, Ellström, Svensson & Widegren, 2002).
Figure 1. The research process (Fagerström, 2004).
2.2RESEARCH APPROACH
Research can be conducted from several different methodological approaches. Arbnor and Bjerke (1994) have classified three different research approaches (Figure 2):
• The analytical approach is positivistic and assumes that reality is objective.
• The actors’ approach is a hermeneutic view and sees reality as a social construction.
• The system approach is more closely related to the positivistic manner than to the hermeneutic approach and assumes that reality is objectively achievable where various partitions interact through relations and that the ultimate understanding can be reached through mapping.
Figure 2. Methodological approaches related to paradigms (Arbnor & Bjerke, 1994).
The field of application differs between the approaches of research depending on various factors. The positivistic approach is usually used in the field of nature science due to the view of an objective reality while the actors’ approach is more frequent in the field of social science where reality is subjective and dependent on factors such as time and culture. The approach bordering to both sides of the extreme, the systems approach, is usually summoned in complex contexts where connected activities are to be evaluated.
Positivism is according Arbnor and Bjerke (1994) an analytical approach that can be expressed as an extension of the methods of natural science to social sciences and related business economy. Positivism is an approach of science that considers knowledge to be based on systematic experiences and assumes that experience is empirically testable. Furthermore, the positivistic approach is seen as explanatory knowledge due to the direct adoption and application of natural science methods to social science (Arbnor and Bjerke, 1994). The understanding knowledge and hermeneutics is in contrast to positivism and the declared knowledge (See figure 2).
The choice of approach depends primarily on the researcher's personal views in regards to knowledge and the research questions that he has formulated. The researcher has in this thesis taken a systems approach to the research questions. This claim is based on the fact that the research conducted will analyse and scrutinize the different components that a performance management system consists of.
A positivistic approach will be applied when scrutinizing performance measurement metrics. The researcher has not been seeking to define hermeneutical or system-based factors related to performance measurements. Furthermore, the research never intended to test complex data collection systems or analyze the interaction of its components in relation to isolated performance measures. However, it is obvious that a performance measurement system will work in an open production system, heavily influenced by its temporal, cultural and social context. The final applicability and functionality can depend upon a number of non-analytic factors not considered in this positivistic-based approach.Further, the approach is based upon a limited number of industrial studies. This is however always the case in this kind of case study-based research, where analytical
generalisation is used in contrast to research based on statistical generalisations (Yin, 1991).
2.3RESEARCH PROCESS
The research has been conducted in accordance to the outline of the PREPARE programme developed by Mälardalen university, the KK-foundation and the selected league of industrial companies in the region of Mälardalen (See figure 3). The pre-study was initiated with a project definition. The second step was then to analyze the current situation and describe the existing problems and delimitations. Step three was to execute the intensive phase of the state-of-the-art mapping. When reaching the stage of problem analysis the empirical collection started with two case studies. Finally a solution was presented.
Figure 3. The PREPARE programme outline.
2.4STRATEGIES FOR DATA COLLECTION
Literature advocates different strategies of data collection depending on the context and purpose of its use. Barnes (2001) has drawn the rational conclusion that each approach has its advantages and disadvantages. Following are five types of strategies according to Yin (1994).
PREPARE PROGRAMME
Research prestudy Project Definition Current Situation State Of The Art Problem Analysis Solutions• Experiment focuses on contemporary events in controlled environments and is best meant for questions based on "how" and "why".
• Surveys apply best when questions are based on words such as "who", "what", "where", "how many", "how much" and focuses on contemporary events.
• Analysis of archived data is most appropriate for "who", "what", "where", "how many" and "how much" questions. This type of approach is best suited to issues related to contemporary and historical events.
• History is best suited for historical "how" and "why" questions. • Case studies are best designed for contemporary "how" and "why"
questions.
It is not always obvious which strategy to apply. According to Yin (1994) the selection of strategy depends at large on three factors. Type of research question, level of control the researcher has over events and level of focus on contemporary versus historical events (Yin, 1994).
2.5DATA COLLECTION
Literature study
A thorough literature study has been executed. The literature study continued throughout the research study but the extensive work was done initially. This study has been used as Yin (1994) argued, to develop sharper and more profound research questions. Furthermore, the literature study falls in line with Routio’s (2004) view that it exists to essentially clarify the problem and create a perception of what other attempts to solve the problem has left. Literature study topics include; performance metrics, productivity system, performance management,
The Descriptive Case Study
The case study process has followed the process map suggested by Yin (1994) illustrated in figure 4. The starting point has been the theoretical framework developed through extensive research through the field. When a somewhat clear picture of the academic landscape was generated the focus shifted to the selection of case studies. The choice was made to focus on two case studies due to wide grasp of the performance management process.
The next step was to design a data collection protocol. Two components created the base to the protocol used throughout both studies: analysis of archived data and a comprehensive interview study: Observations of archived data – Includes the financial data base, information systems, operational manuals and processes of the company case studies. Financial data is used when assessing how financial measures are related to the strategic objectives and hypothesises. The capabilities of the information systems are briefly investigated and operational manuals and processes are scrutinized in order to decide the level of standardised and structured way of working.
Interview study – A comprehensive interview study with members of the executive production board of the chosen case companies. The interviews were conducted in three parts. Open interviews, semi-strfuctured interviews and an ending questionnaire. The reason for the chosen mix of interview forms is due to the variety of components surrounding a measurement system.
FIGURE 4.CASE STUDY METHOD.
The next step after designing the data collection protocol was to execute the first case study. As the author is employed at the case company much of the information had already indirectly been retrieved over the last two years through observations, informal discussions and formal meetings. Still, an interview study and analysis of data were conducted. The second case study was conducted at a manufacturing site belonging to the same company. However, the same level of information was never reached in the second study due to cultural, personal barriers and the short time for the study. Having that in mind no interferences were made in the collection of data and the same freedom applied as in the first case study. The biggest difference in the two cases is that the author could anticipate the result of the interview study before conducting it while in the second no expectations whatsoever were done.
After the execution of the case studies the material was gathered and analyzed in a structured manner. Case reports were summarized for each site and then compared to each other. Finally, based on the case studies and the cross-case analysis a recommendation was derived, as suggested by figure 4.
Analysis of archived data
The research questions in the thesis have placed great emphasis on analysis of contemporary and historical information. To determine the relevance of metrics and influencing factors related to the performance management system the research needs to apply a strategy for data collection that suits both contemporary and historical events. Furthermore, the chosen strategy need to be appropriate for research questions based on words such as "who", "what", "where" and "how many".
With the above requirements in mind the choice of strategy of data collection fell on analysis of archived data. According to Yin (1994) the chosen strategy is suitable for financial research. The disadvantage of the strategy is the limitation of data that researchers sometimes encounter (Yin, 1994). In this case however the researcher had unlimited access to archived data because of his employment at the company where the research as been conducted.
The empirical information analyzed came almost exclusively from Volvo Construction Equipment’s archives of data. The analysis focused on historical financial ratios, influencing performance measurement system parameters and factors related to performance management. Interviews
According to Yin (1994), interviews are one of the most important data sources in a case study. The purpose of the interviews is to create a suitable passage for theory to meet practice.
The sessions started of with an introduction to the subject and overall goals with the interview study by the interviewer. Further, the purpose and use of the material was disclosed. The interviews were divided into four phases. Firstly, background variables were collected. Then the actual empirical collection started with an open form to allow the
interviewee to communicate her perception of the performance management process at the case company. The next step was then to introduce semi-structured questions with the purpose of mapping out the theoretical components of a performance measurement system. Finally a questionnaire with nine questions were handed the interviewees focusing on rating the strength of the components. On average the interviews took 45 minutes to conduct and all material was recorded. Each interviewee received a copy of their interview in a scripted form to provide a final validation before analysing the material.
The questions in the interviews have been based on information collected during the literature study and analysis of archived data. The persons interviewed have been members of the management board for production at the case companies. However, exceptions were made for persons not belonging to the management board but deemed to have made critical observations of the situation at the company.
2.6ANALYSIS OF DATA
As previously discussed, the researcher has aimed at creating knowledge with both practical and academic relevance. The common knowledge has been generated through interactive research.
Figure 4 visualizes the approach of analysis that the researcher has applied. The researcher has analyzed empirics and theories simultaneously in multiple rounds. The purpose of the chosen strategy of analysis was to ensure that generated results was and remained practically and theoretically relevant during the entire research process.
The literature study has, as Figure 5 indicates, been held at a horizontal level. The aim at the initial phase was to define and clarify terminology surrounding the topic. The generated theory related to the terminology was then compared against the practitioner’s perception of the terminology.
During phase two the literature study became more specific. The aim was to assess the vital characteristics of a performance management system. An analysis of the most influential theoretical works in the
field of performance management was executed. These were then benchmarked against the results of the interviews with practitioners. Phase three of the sequential approach of analysis intended to answer research question 3. The researcher assumed that the definition of the terminology is identified at the beginning of this phase.
Figure 5. Process of data analysis
The empirically tested theories in the two opening sequences were reconciled with the final phase of the literature study that, at this stage,
was strongly focused on the critical aspects of a performance management system. The measurement which met the criteria related to the analysis in phase two was then empirically analyzed via historical data from Volvo CE’s databases.
Finally, the work has been validated through academic discussions, industrial presentations and an academic article.
2.7VALIDATION AND QUALITY ASSURANCE
To ensure that research results are reliable and useful, validation is of utmost importance. According to Olesen (1992) the validation of a research is based on five aspects;
• Internal logic - Research results are based on accepted theories and a logical flow exists through the entire work
• Truth - The theoretical and practical results can explain real phenomenon.
• Acceptance - The theories used in the research are generally accepted by other researchers.
• Application – Correlation between the degree of application and quality of findings and results.
• Innovative thinking - New solutions or problem approaches are presented.
The validation of acceptance, innovative thinking and internal logic is ensured by the academic article that has been derived from this thesis. The article was presented at the Swedish Production Symposium (SPS09) in Gothenburg in the beginning of December 2009.
The truth has been validated continuously since the author has conducted interactive research. The research results were rooted with the practicing society in sequential fashion. The application factor was covered during the data collection phase in which metrics and components generated in theory were applied to data from Volvo Construction Equipment’s databases.
F
RAME OF
R
EFERENCE
This chapter introduces the theoretical framework applied in the research conducted in the field of performance management. Three sections separate the chapter: The historical aspect, performance measurement systems and critical dynamic factors. Initially, the theoretical development from the days of Henry Ford is mapped out. Secondly the performance management frameworks with highest academic impact are introduced. Finally, the factors critical to a dynamic performance management system are highlighted.
3.1DEFINITIONS
This chapter will start off with defining critical terms in the report for the sake of clarity.
Performance measure - A measure used to quantify efficiency and effectiveness of taken actions (Neely et al., 2005). The terms Key Performance Indicator (KPI), metric and measure will be used interchangeably throughout the report.
Performance Measurement System - The set of metrics used to quantify efficiency and effectiveness of taken actions (Neely et al., 2005)
Performance Management - The process of managing strategy through business improvement methodologies and supported technology (Cokins, 2004).
Productivity – The ratio of what is produced to what is required to produce it. Productivity measures the relationship between output such as good and services produced, and inputs that include labor, capital, material and other resources (Hill, 1993).
3.2WHY PERFORMANCE MANAGEMENT?
Lord Kelvin once said “When you can measure what you are speaking about, and express it in numbers, you will know something about it [otherwise] your knowledge is of a meagre and unsatisfactory kind; it may be the beginning of knowledge, but you have scarcely in thought advanced to the stage of science” (cited in Tangen, 2004).
There is a plethora of well-rehearsed proverbs to apply when discussing performance management and performance measurement systems. An increased research evidence indicate that measuring firms outperform non-measuring firms financially, in management of change and in being perceived as industry leaders (Lingle and Schiemann, 1996). Hence why the concept has generated a great amount of attention for some time without signs of stagnation.
For the last two decades performance metrics has been in focus in an ever-increasing number of fields (Folan and Brown, 2005). One of the most central arguments for performance measurement systems is according to Lynch and Cross (1991) the assurance of aligned tasks and actions with strategies and objectives. Ghalayini and Noble (1996) develops the argument further and argues that in order for companies to ensure achievement of their goals and objectives performance measures are used to evaluate, control and improve production processes. Performance measures are used to compare the performance of different organizations, plants, departments, teams and individuals, and to assess employees.
Organisational performance has always influenced actions taken by companies. The means of accurately measuring performance is perceived as increasingly important in field of performance both for academia and practice. The concept plays an important role in operations management. Operations management play an integral part in strategic management coming to translating strategic visions to
actions. Therefore can performance measurement systems be perceived as the tools to link strategy to action (Barnes, 2008). Bourne et al. (2000) asserts that the use of performance measures is split into dual branches. Primary, the initial area is to monitor the success of strategy implementation (Kaplan and Norton, 1996). Secondly, the feedback generated from measures should be used to challenge and test the validity of the strategy and the set of hypothesis underlying it (Kaplan and Norton, 1996).
Another solid argument is the fact that what gets measured in an organization does have a behavioural impact influencing employee behaviour making the choice of what to measure a key decision (Neely et al., 2005). According to Waggoner et al. (1999) the most frequent mentioned reasons for implementing measurement systems are:
• Monitoring of performance
• Identification of areas that are in need of attention • Enhancing motivation
• Improving communication • Strengthening accountability
3.3AHISTORICAL APPROACH
According to Barnes and Radnor (2007) the literature of performance management and measurement systems can be divided into three distinctive time periods in continuous evolution; the early twentieth century, post world war two and mid 1980s. The cutting point between the eras should not be seen as revolutionary and sudden but bevelling. However, Ghalayini and Noble (1996) perceives the literature to be divided into only two phases, 1880s and 1980s. This report has not made a clear distinction between the time periods.
3.3.1 HENRY FORD AND TAYLORISM
The origins of performance measurements can be traced back to Frederick Taylor and the era of scientific management. Taylor built his
philosophy around the thesis that management was responsible of devising the most efficient method of performing work. Scientific management derived and implemented new and improved methods of working via analysis of existing work methods through measurements and observations. The performance of the new methods of working was then closely monitored through metrics.
Taylor’s scientific management framework built around increasing the efficiency and output of the individual worker. The framework advocated financial incentives to individual workers that increased efficiency and output. The financial incentive evolved to performance measures to monitor the progress of the labour force. Performance measures were only used at a micro level for measuring productivity whilst operation managers focused on financial figures generated by cost accountants to monitor the macro level of the company. With the push system of the early twentieth century volume and cost (hence productivity) were the only variables monitored and with the heavily labour weighted manufacturing of that time it seemed rational. Performance measures were derived from management accounting systems and emphasised cost with a rigid focus on financial measures such as productivity, profit and return on investment (Rolstadås, 1998). The application of Frederick Taylor’s framework had a great impact on the success of western industry in the beginning of the 20th century. 3.3.2 HUMAN RELATIONS MOVEMENT
In the aftermath of the Second World War the dominance of measuring efficiency and cost perished. Simultaneously the human relations movement amplified its influence through Elton Mayo’s Hawthorne experiments and Abraham Maslow’s hierarchy of needs theory. The famous experiments at Western Electric's Hawthorne plant became acknowledged as groundbreaking and provided new scientific foundations for management (Smith, 1998). The studies were conducted between the years 1927 and 1932 and examined productivity correlated to work conditions. The researcher found that the people were motivated by more than financial incentives and that that employees achieved best and generated most motivation in a humane milieu. The part of the experiment that evolved around the constructive effects of benevolent supervision and affection for employees that
made them feel like part of the group is today known as the Hawthorne Effect (Geber, 1986).
During the 1950s and 1960s Taylorism was labelled as an autocratic management style inappropriate and obsolete in a democratic era. At the same time unemployment rates were low and employees had suddenly gained increased choices in terms of where to work. Increased quality of working became paramount to employers in order to retain and attract qualified personnel. Workers were given amplified influence in affecting work practice and the way of working. Performance measures at micro and individual levels started to gradually vanish, while measures of team performance started to gradually increase.
3.3.3 TOYOTA AND TOTAL QUALITY MANAGEMENT
In the 1970s the unquestioned position of the American management style became challenged as western manufacturers where pressured by acute competition from overseas, in particular Japanese manufacturers. Globalisation started to change the rules of making business, trade barriers were lowered and successful companies started to compete in an international arena and regarded the world, and not only their nations, as their market (Rolstadås, 1998). Consumers experienced that the Japanese goods were superior in both quality, variety and competitivelly priced. Western manufacturers were forced to overlook their practices, they realised that the increased complexity of organisations and the markets entailed by globalisation made solely financial measures as performance indicators obsolete (Kennerley and Neely, 2003).
The most apparent difference between western and Japanese manufacturers was that the former solely focused on efficiency while the latter equally emphasised both efficiency and effectiveness. In order to recapture the cutting edge, western companies re-evaluated their strategic priorities from solely cost to delivery precision, lead time, built-in quality and flexibility. New measures were generated to reflect the concern of effectiveness and philosophies such as Total Quality Management where introduced (Ghalayini and Noble, 1996).
3.3.4 NON-FINANCIAL PERFORMANCE MEASURES
This resulted in an enlightening of the limitations of traditional financial metrics. The traditional measures were derived from management accounting systems and emphasised financial metrics. These metrics have their origins in the operating management of textile mills, steel mills, railroads and customized retail stores (Ghalayini and Noble, 1996) and are deemed to be historically focused. Najmi, Rigas and Fan (2005) argue that traditional accounting performance measures fail to convey strategies and priorities in an effective manner within an organization. Further the impact of the shift in correlation between the tangible book value and market value of firms made an impact of the shift of era. A study conducted 1982 concluded that tangible book values represented 62 per cent of the market value of industrial organizations. In contrast similar studies at the turn of the century the tangible book value only represented 10 to 15 per centage of the market value (Kaplan & Norton, 2001). In the process of creating value the influence of tangible assets has diminished over time and focus have been inevitably pointed at intangible assets such as customer relationships, innovative products, high quality operational processes, efficient information systems and databases and employee capabilities. Measuring performance via solely financial measures is heavily criticized in both practice and academia. Consensus prevail in the opinion that cost based systems such as traditional measures are insufficient as a management tool in the contemporary markets with rapid change and acute competition (Kennerley, Neely, 2003). Ghalayini and Noble (1996) argue that traditional measures are out of context, lagged, lacks alignment with strategy, not quantifiable in operational terms, expensive and inflexible. Kaplan and Norton (1992) take it further and argue that traditional measures totally lacks customer and competitor perspectives and are too internally focused. Skinner (1974) agrees and debates that traditional financial measures lacks a strategic foundation and fail to succeed in delivering data on quality, responsiveness and flexibility.
When the new “non-traditional” measures arouse with characteristics revolving around vertical and horizontal alignment between metrics and strategies, a focus on operational measures that are useful for everyday decision making, being more palpable the further they are broken down, and an ability to adjust to change in the marketplace
(Rolstadås, 1998). Measures that reports yesterdays financial results are inadequate in regards to the factors that are paramount to larger market shares and higher profits such as customer service, first-time quality, employee development and R&D effectiveness (Neely, 2002). A growing recognition that operations had a strategic role to play evolved and managers wanted to now if their operations were achieving appropriate levels of performance (Neely & Austin, 2000). In the transition between 80s and 90s business process re-engineering (BPR) gained dominance. Business process re-engineering is defined by Hammer and Champy (1993) as:
“The fundamental rethinking and radical redesign of business processes to achieve dramatic improvements in critical, contemporary measures of performance such as costs, quality, service and speed”
The main principle of BPR was the view of an organisation as a set of processes. This promoted a strategic view of operations and gave rise to assessment beyond cost and quality to speed, delivery and dependability (Slack et al, 2005). Within operations, balanced and multi-dimensional measure concepts were generated. These concepts were forward looking with an emphasis on non-financial, external measures (Bourne et al, 2000). According to a management survey conducted in 15 countries around the world and published by Darrel Rigby in 2001, 30 to 60 per cent of firms have adopted the balanced scorecard ( see section 3.5.4.). The concept of the balanced scorecard has become the most distinctive symbol of the new way to measure.
3.4ANALYSIS OF RESEARCH MADE
Andrew Neely conducted a citation/co-citation analysis published in 2005 as an update of a more extensive literature review of the academic study in the field of performance management executed 1995. The result undeniably pointed at the dominance of Robert Kaplan and his balanced scorecard concept. However, the academic studies conducted so far in the field are perceived as immature. To strengthen this, Neely analysed the citation/co-citation analysis at depth. The 1352 articles in the analysis included 31 646 citations to 16 697
authors of 25 040 works. The top four most cited authors are from different disciplines within the field, Bob Kaplan from accounting, Andrew Neely from management, Rajiv Banker from operations research and information systems and Abraham Charnes mathematics and operations research (Neely, 2005). Only 10,2 per cent of the total citations came from the top-ten most frequently cited journals. The wide diversity of the material points at a wide distribution and lack of consensus of the theoretical core in the field of study within performance management as subject in academia (Neely, 2005).
Further, Neely estimated that between the years of 1994 and 1996 3615 articles on performance measurement were published alongside with books at a rate of one every 2 weeks in the United States alone (Folan and Browne, 2005). In a similar statistical breakdown of the performance measurement association’s conference between 1998 and 2002 Marr and Schiuma (2003) generated a result strengthening the findings of Neely from 2005. The dominance of Robert Kaplan and the balanced scorecard is evident throughout the scope of the analysis.
3.5PERFORMANCE MEASUREMENT SYSTEMS
Performance measurement systems has come and gone over time with various impacts. The evolution of the systems provides an adequate picture of how the field of performance management has changed. Below follows an outline of the most influential measurement systems. 3.5.1 THE PERFORMANCE MEASUREMENT MATRIX
The performance measurement matrix is one of the older systems existing. Performance is here measured by a four dimensioned matrix. The matrix is split into four cells: external/cost, external/non-cost, internal/cost and internal/non-cost (Keegan et al., 1989). As illustrated by figure 6, the system is founded on four pillars:
• Performance measures must be derived from strategy
• Performance measures must be integrated vertically and horizontally
• Performance measures must be supporting the multidimensional environment
• Performance measures must be based on a thorough understanding of cost relationships and behaviour.
The authors argue that performance measurements trigger actions from management and therefore it is of utmost importance that measures are derived from corporate strategies and are integrated vertically and horizontally.
FIGURE 6.THE PERFORMANCE MEASUREMENT MATRIX (KEEGAN ET AL.,1989).
Metrics need to be measurable on each hierarchical level and the further measures extend down the organisation the more specific they need to get. Telling an operator at the factory floor to increase return on investment will not generate anything but setting up measures of scrapings per unit and delivery precision for each factory cell or work centre will trigger actions that in the long run will amplify return on investment (Keegan et al., 1989).
The system need to measure the whole multidimensional environment with indicators both internally and externally. The purpose of the design of the performance measurement matrix is to give a holistic view of the overall performance of the company. Finally focus should be on cost drivers and generated measures need to be based on a sound and thorough understanding of cost relationships and behaviour. This is
because cost, according to the authors, is the most important basis of performance measurement.
3.5.2 SINK AND TUTTLE MODEL
A classic performance measurement system is the Sink and Tuttle model. The model defines performance as a complex interrelationship between seven criteria, illustrated in Figure 7;
• Effectiveness – This involves doing the right things at the right time with the right quality. Expressed as the ratio of actual output divided over expected output.
• Efficiency – Doing things the right way, expressed as the ratio of expected consuming of resource over actual resources consumed. • Quality – A wide concept, therefore this criterion is measured
through six checkpoints; quality management process, inputs, outputs, downstream systems, upstream systems and transformation value adding process.
• Productivity - Defined as the traditional input to output ratio. • Quality of work life - An essential contribution to a
high-performing system.
• Innovation - A key element in sustaining and improving performance
• Profitability / budgetability - Represents the ultimate goal for any organisation.
Having the first three performance criterion in place is a prerequisite for a productive organisation. Further, quality of work life and innovation are moderators. They can either decrease or increase performance. Producing high level performances at these criterions amplifies profitability in short-term and supports the long-term goals of survival, excellence and growth (Tangen, 2004).
The industry and business environment has changed since the release of the model. However the above criteria are still deemed important to business.
The model has several limitations. It does consider the need for flexibility, which is considered to be a strategic priority. Further the model lacks consideration for the customer perspective.
FIGURE 7.SINK AND TUTTLE MODEL (TANGEN,2004).
3.5.3 TOPPPERFORMANCE MODEL
A framework constructed within the TOPP Project views performance as an integration of three dimensions, illustrated in Figure 8:
The first two dimensions have the same definitions as in the Sink and Tuttle model. The additional adaptability dimension gauges the extent to which a company is equipped for future changes (Tangen, 2004). TOPP was a productivity study carried out in the Norwegian manufacturing industry between 1992 and 1996. The study was sponsored by the Norwegian Research Council and had as overall goal to focus on the total productivity for the whole enterprise and stimulate an industrial climate that improves competitiveness. The key objectives of the study were time to market, quality, flexibility and total cost (Rolstadås, 1998).
3.5.4 THE BALANCED SCORECARD
The balanced scorecard was developed 1992 by Robert Kaplan and David Norton. The authors describe the scorecard as the cockpit of an airplane. In an airplane, the pilots need information about several aspects in order to navigate and fly, in comparison a manager needs to view and gauge performance from several areas simultaneously in order to run a business. The idea of the balanced scorecard is to use a balanced set of measures to allow executive managers to take a quick but comprehensive look at four crucial aspects of business. These aspects are derived to provide answers to four paramount questions illustrated in Figure 9:
• How do we look to our shareholders (financial perspective) • What must we excel at (internal business perspective) • How do our customers see us (the customer perspective)
• How can we continue to improve and create value (innovation and learning perspective)
The concept refutes critical voices raised in regards to gauging performance via traditional financial measures. These critics argue that firms should solely focus on operating measures and that the financial numbers will take care of themselves if operations are executed soundly. However, the authors consider the financial perspective to be important because of two reasons. Firstly, well designed financial measures can amplify quality and secondly because correlation
between operational improvements and financial boosts are thin and volatile (Kaplan and Norton, 1992).
FIGURE 9.THE BALANCED SCORECARD (KAPLAN &NORTON,1992).
The balanced scorecard uses financial performance measures as tools to display results of taken actions. In addition, the model also uses operational non-financial performance measures to assess drivers of future financial performance.
The purpose of streams of information from several directions in combination with a limited set of measures is to guard against information overflow, sub-optimisation and to keep the focus at the most crucial aspects of business.
The balanced scorecard is the most cited piece of work in the field of performance management. At the time of introduction the scorecard was considered revolutionary to the field due to its innovative multi-dimensional approach to performance measurement. According to Rigby (2001) between 30 and 60 per cent of companies has adopted the framework.
Even though the balanced scorecard is considered to be the most famous and popular framework it has disadvantages. Ghalayini et al. (1997) argues that the weakness of the scorecard is that it is conceptualized as a tool of controlling for senior managers and not as
an improvement tool for factory operation levels. Another weakness is the inadequate instructions on how proper measures can be identified and initiated. Finally the concept lacks a competitor perspective. Since firms started to implement the balanced scorecard, investigations has empirically concluded that the impact of enhancement related to performance of the framework have supplied mixed results (Banker et al., 2000) (Neely et al, (2004) cited in Neely, 2005). Due to the freshness of the concept investigations in regards to the effect of the balanced scorecard in practice has not been possible earlier. Brignall (2002) argues that the linear and static nature of the tools for designing and implementing score cards, strategy maps, is the problem. Strategy maps assume rationality between factors of organizational performance when, in reality, those relationships are recursive and irrational. Studies in the Canadian manufacturing industry indicate that even though firms adopt the balanced scorecard they have not been able to adopt non-financial measures to higher degree than firms using traditional performance management approaches. (Gosselin, 2005). 3.5.5 THE PERFORMANCE PRISM
The performance prism is a framework designed to assist performance measurement selection – the vital process of picking the right measures. It suggests that the performance measurement system should be focused around five distinct but linked perspectives, illustrated in Figure 10;
• Shareholder satisfaction – Who are the important stakeholders and what do they want and need?
• Strategies – What are the strategies we require to ensure the wants and needs of our stakeholders are satisfied?
• Processes – What are the processes we have to put in place in order to allow our strategies to be delivered?
• Capabilities – What are the capabilities we require to operate our processes?
• Stakeholder contributions - What do we want and need from stakeholders to maintain and develop those capabilities?
FIGURE 10.THE PERFORMANCE PRISM (NEELY ET AL.,2001).
Stakeholder satisfaction is seen as the first facet. Instead of deriving measures from strategy, the framework argues that a strategy is a plan for delivering value to a set of stakeholders and hence measures need to be directly derived from the wants and needs of the stakeholders. When the wants and needs are mapped out, the second facet starts: the exploration of what strategies to put in place to ensure their satisfaction (Neely et al., 2001).
The third facet of the framework is the processes. The common generic business processes needed in order for organizations to follow and fulfil strategies are enlightened. These are: develop new products and services, generate demand, fulfil demand and finally plan and manage enterprise. Specific measures within each process should be identified and generated in order to allow managers to track performance. The fourth facet is capabilities; they are defined as the combination of people, practices, technology and infrastructure that together allow execution of business processes. The last facet of the performance prism is stakeholder contribution. The authors argue that organizations and stakeholders enter a relationship with mutual demands. Just as the first facet lists the wants and needs of the stakeholders, the last facet addresses the wants and demands of the organisation towards the stakeholders (Neely et al., 2001).
The framework is unique with the broad focus on stakeholders. The strength of the prism is that it questions before selecting and hence ensuring that solid measures are generated.
3.5.6 THE PERFORMANCE PYRAMID
Cross and Lynch (1992) framework “the performance pyramid” puts corporate vision in focus. It is considered one of the earliest approaches to advocate integrated measurement systems. The framework addresses internal and external effectiveness and links corporate strategy with daily operations through a pyramid consisting of four levels, illustrated in figure 11:
FIGURE 11.THE PERFORMANCE PYRAMID (CROSS &LYNCH,1992).
• Corporate vision – The “heart and soul” of the company defines its markets and how to compete: on price, breadth of product line and quality of sales force. The strategy is translated into business unit objectives.
• Business Units – Comprises key results, objectives and measures. Most business units define success as reaching short-term goals of cash flow and profitability and long-term goals of growth and market position.
• Business Operating Systems – Bridges the gap between top-level, traditional indicators and new day-to-day operational measures.
• Key Performance Measures – Integrated and balanced set of performance measures that are controllable on daily basis for managers and workers alike. Measures consist of; quality, delivery, cycle time and waste.
The Performance pyramid focuses on the paramount requirement of a performance measurement system, a clear link between performance measures at different hierarchical levels within a company so that goals are aligned. The pyramid links corporate strategy to operations by translating objectives top down and measuring bottom up (Cross and Lynch, 1992).
Continuous improvement is discussed but no implicit process exists for implementation. The authors suggest that continuous improvement is triggered by the state of improvement of the competitors and that their achievements should be a point of reference for what the company must overachieve. For example, a goal of 95 per cent delivery precision says nothing without knowing where the competition is heading.
Ghalayini et al. (1997) argues that the main strength of the concept is the integration of corporate objectives with operational performance indicators. Further, the vertical and horizontal alignment of strategies is another strength that ensures correct direction. However, the concept lacks a mechanism for identifying key indicators of performance. Further, the lack of a process for continuous improvement is also seen as a disadvantage.
3.5.7 MEDORI AND STEEPLE’S FRAMEWORK
The Medori and Steeple’s framework is based on a research programme executed at four medium- to large-sized manufacturing organisations. The purpose of the research programme was to identify actual industry requirements for a performance measurement framework (Medori and Steeple, 2000).
The concept is designed to either audit or enhance an existing performance measurement system or to create a brand new one. The framework is designed as a process consisting of six detailed stages, illustrated in figure 12:
1. Defining manufacturing strategy and success factors
2. Matching strategic requirements with the six defined competitive factors
3. Selection of the most suitable measures
4. Auditing existing measurement systems to identify which existing measures are to be kept
5. Implementation of measures based on eight elements 6. Periodic review of the measurement system
Figure 12. Medori and Steeple’s Framework (Medori & Steeple, 2000).
The starting point is to define the manufacturing strategy. The purpose of the step is to ensure that measurements are related to the company’s strategy. The second stage matches the requirements derived from the strategies to six competitive priorities: quality, cost, flexibility, time, delivery and future growth. Once stage 2 is completed the competitive priorities become clear in the area of measurement for the company. After identifying priorities the most suitable measures are chosen out of a spectrum of 105 well defined measures in stage three. The fourth stage is to audit the existing performance measurement system. The measures of the existing system are compared with the ones picked in stage three. Old measures that are aligned with the new ones are kept, the rest are scrapped. Stage five is essential and contains the implementation of the measures linked to eight elements: title, objective, benchmark, equation, frequency, data source, responsibility, improvement. Finally, the last stage of the framework is revolved
around periodic maintenance of the system. Periodical reviews are a part of the framework and serve as a guard against redundancy and obsolescence (Medori and Steeple, 2000).
3.6CRITICAL ASPECTS FOR DYNAMIC PERFORMANCE MEASUREMENT SYSTEMS
In recent years considerable attention has been given on the design and use of performance measurement systems. As global competition increases and ownership and management has increasingly been separated, financial measures on return of investment have been applied for expanding range of applications, in order to facilitate a monitoring of management and execution from executive levels and owners.
However, as Kennerley and Neely (2003) point out, there is wide documentation on the deficiencies in traditional financial performance measures and their insufficiency for the effective management of businesses in today’s rapidly changing and highly competitive markets:
“Authors suggest that traditional financial performance measures are historical in nature (Dixon et al., 1990); provide little indication of future performance; encourage short termism (Hayes and Abernathy, 1980; Kaplan, 1986); are internally rather than externally focused, with little regard for competitors or customers (Kaplan and Norton, 1992; Neely et al., 1995); lack strategic focus (Skinner, 1974); and often inhibit innovation (Richardson and Gordon, 1980).”
These drawbacks of traditional measures have been especially visible during the latest year of financial crisis and rapid decline in orders, especially for the automotive sector. In addition, in an increasingly complex performance measurement context, the management of performance systems and performance indicators is increasingly important.
Companies often fail to continuously reflect the dynamic business environment and their new priorities in their performance measurement systems. With this background, Neely (2005) points out five key research issues for performance measurement:
• How to design and develop enterprise performance management rather than measurement systems?
• How to measure performance across supply chains and networks rather than within organisations?
• How to measure intangible as well as tangible assets for external disclosure as well as internal management?
• How to develop dynamic rather than static measurement systems? • How to enhance the flexibility of measurement systems so they can
cope with organisational changes?
This report has vowed to search deeper into the two latter issues raised above: How to develop a dynamic and flexible measurement system and what the critical aspects of such system are. Through extensive search of literature in the field of performance measurement and performance management three critical aspects for a dynamic and flexible system have been identified: Ongoing management, Evolution and Alignment. How measurement systems h evolve after implementation is a question that few researchers have tried to answer (Waggoner et al., 1999). Each of the critical aspects for a viable system are discussed more in depth below.
3.6.1 ON-GOING MANAGEMENT
As it is generally accepted both in academia and practice that business strategy is dynamic and ever changing in nature; a consensus is growing that performance measurement systems must be accounted for when direction changes (Najmi, Rigas and Fan, 2005). In a historical analysis made by Barnes and Radnor (2007) the authors conclude that the management of performance measures has deepened and is now linking the operational parts to the strategic management process. A more holistic approach is being recognized where alignment throughout the organization is emphasised. In addition, Gregory (1993) reason that none of the existing measurement systems emphasises the need for a management process, nurturing the measurement system and keeping it viable. Instead the management is seen as a once-off initial occurrence.
Salloum and Wiktorsson (2009) argue that a management process is paramount in order to create a dynamic and flexible measurement system. As sound measures are derived from either corporate strategies or stakeholder interests a reactive and efficient performance management process linking strategic objectives to measures is of essence. A reactive performance management process will anticipate contextual change and trigger rapid change throughout an organization as strategy differs. An efficient performance management process will create a measurement system that is robust to irrelevant disturbances and simultaneously sensitive to relevant changes (Salloum & Wiktorsson, 2009).
However, few organizations appear to systematically manage their measurement systems over time. This creates a paradox with organizations using metrics that are deemed obsolete or redundant due to the unfamiliarity of changing them (Waggoner et al., 1999). If the ongoing management is not functional the cascading of top measures will be biased and misguiding measures at middle and lower levels will be generated. In organisations that appreciates and values results this is risk of magnitude (Salloum & Wiktorsson, 2009).
It is of utmost importance that the development and management of a performance measurement system is not seen as a once-off happening but as an on-going event. Niven (2006) argues that a measurement system must be responsive to differentiated conditions internally and externally and therefore needs to be a progressive process. In order to secure that ideal results are achieved a performance measurement system needs to be designed, managed and evaluated in periodic fashion (Waggoner et al., 1999).
3.6.2 EVOLUTION
According to Kennerley & Neely (2003)
“The design and use of performance measurement systems has received considerable attention in recent years. Many organisations have redesigned their measurement systems to ensure that they reflect their current environment and strategies. However, increasingly the environment in which organisations compete is dynamic and rapidly changing, requiring constant modification of strategies and operations to reflect these
changing circumstances. Despite this, few organisations appear to have systematic processes in place to ensure that their performance measurement systems continue to reflect their environment and strategies”.
It is evident in both business and academia that there is a need for a mechanism that reviews performance measurement systems due to the constantly changing modern markets (Najmi, Rigas and Fan, 2005). Eccles (1991) pointed out that an evolutionary process within measurement systems is non-existent. However, a performance measurement system is of no use if it is not capable of adjust to contextual change (Waggoner et al., 1999).
Gregory (1993) argues that the need for a dynamic approach within measurement systems is not generally addressed. Ghalayini and Noble (1996) also inquires a dynamic system that is able to cope with updating measures and measurement standards. Eccles (1991) concluded a non-existence of a predetermined process for changing measurement systems is clear.
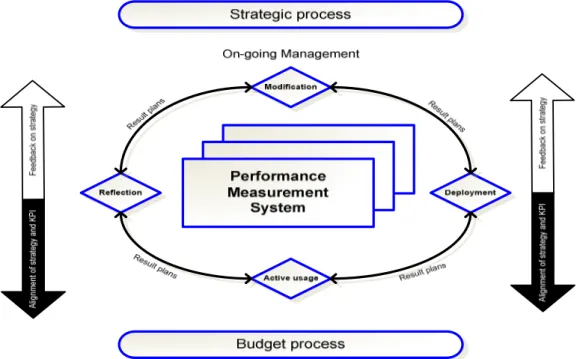
Kennerley and Neely (2003) suggest that the evolution of a system is possible through execution of three phases: Reflection, modification and deployment:
• Reflection on the existing performance measurement system to identify where it is no longer appropriate and where enhancements need to be made.
• Modification of the performance measurement system to ensure alignment to the organisation’s new circumstances.
• Deployment of the modified performance measurement system so that it can be used to manage the performance of the organisation. 3.6.3 ALIGNMENT
Monitoring indistinguishable metrics do not impact individuals will exacerbate the feeling that performance measures are not to work with, but only to report (Cokins, 2004). Employees need to able to directly affect monitored measures and control the outcomes. If this emphasis is reached then the higher focus will be generated towards finding the appropriate measures. In order to reach alignment the start off point