Open Access
Research
Quantitative detection of myocardial ischaemia by stress
echocardiography; a comparison with SPECT
Petri Gudmundsson
1, Kambiz Shahgaldi
2, Reidar Winter
2,3,
Magnus Dencker*
4, Mariusz Kitlinski
5, Ola Thorsson
4,
Ronnie B Willenheimer
6,7and Lennart Ljunggren
1Address: 1Department of Biomedical Laboratory Science, Malmö University, Malmö, Sweden, 2Department of Cardiology, Karolinska University
Hospital Huddinge, Stockholm, Sweden, 3Department of Clinical Physiology, Karolinska University Hospital Huddinge, Stockholm, Sweden, 4Department of Clinical Physiology, Lund University, Malmö University Hospital, Malmö, Sweden, 5Department of Cardiology, Lund University,
Malmö University Hospital, Malmö, Sweden, 6Department of Clinical Sciences, Medicine/Cardiology, Lund University, Malmö University
Hospital, Malmö, Sweden and 7Heart Health Group, Malmö, Sweden
Email: Petri Gudmundsson - petri.gudmundsson@mah.se; Kambiz Shahgaldi - kambiz.shahgaldi@karolinska.se;
Reidar Winter - reidar.winter@karolinska.se; Magnus Dencker* - magnus.dencker@skane.se; Mariusz Kitlinski - mariusz.kitlinski@skane.se; Ola Thorsson - ola.thorsson@skane.se; Ronnie B Willenheimer - ronnie.willenheimer@med.lu.se;
Lennart Ljunggren - lennart.ljunggren@mah.se * Corresponding author
Abstract
Aims: Real-time perfusion (RTP) adenosine stress echocardiography (ASE) can be used to visually evaluate myocardial ischaemia. The RTP power modulation technique angio-mode (AM), provides images for off-line perfusion quantification using Qontrast® software, generating values of peak signal intensity (A),
myocardial blood flow velocity (β) and myocardial blood flow (Axβ). By comparing rest and stress values, their respective reserve values (A-r, β-r, Axβ-r) are generated. We evaluated myocardial ischaemia by RTP-ASE Qontrast® quantification, compared to visual perfusion evaluation with 99mTc-tetrofosmin
single-photon emission computed tomography (SPECT).
Methods and Results: Patients admitted to SPECT underwent RTP-ASE (SONOS 5500) using AM during Sonovue® infusion, before and throughout adenosine stress, also used for SPECT. Visual myocardial
perfusion and wall motion analysis, and Qontrast® quantification, were blindly compared to one another
and to SPECT, at different time points off-line.
We analyzed 201 coronary territories (left anterior descendent [LAD], left circumflex [LCx] and right coronary [RCA] artery territories) in 67 patients. SPECT showed ischaemia in 18 patients and 19 territories. Receiver operator characteristics and kappa values showed significant agreement with SPECT only for β-r and Axβ-r in all segments: area under the curve 0.678 and 0.665; P < 0.001 and < 0.01, respectively. The closest agreements were seen in the LAD territory: kappa 0.442 for both β-r and Axβ-r; P < 0.01. Visual evaluation of ischaemia showed good agreement with SPECT: accuracy 93%; kappa 0.67; P < 0.001; without non-interpretable territories.
Conclusion: In this agreement study with SPECT, RTP-ASE Qontrast® quantification of myocardial
ischaemia was less accurate and less feasible than visual evaluation and needs further development to be clinically useful.
Published: 18 June 2009
Cardiovascular Ultrasound 2009, 7:28 doi:10.1186/1476-7120-7-28
Received: 1 May 2009 Accepted: 18 June 2009
This article is available from: http://www.cardiovascularultrasound.com/content/7/1/28 © 2009 Gudmundsson et al; licensee BioMed Central Ltd.
This is an Open Access article distributed under the terms of the Creative Commons Attribution License (http://creativecommons.org/licenses/by/2.0), which permits unrestricted use, distribution, and reproduction in any medium, provided the original work is properly cited.
Introduction
In low risk patients with suspected myocardial ischaemia, evaluation of ischaemia is generally recommended for opti-mal care and treatment [1,2]. Exercise ECG is considered the first line technique for assessment of ischaemia, whereas sin-gle-photon emission computed tomography (SPECT) or dobutamine atropine stress echocardiography (DSE) are sug-gested when exercise ECG are non-diagnostic or non-inter-pretable [3]. Both SPECT and DSE are well established and more accurate methods than exercise ECG [4-7], although more expensive. Adenosine stress echocardiography (ASE) can also be used for ischaemia evaluation, but demands eval-uation of myocardial perfusion to reach similar accuracy for detecting ischaemia and can not solely rely on wall motion assessment [8,9]. The use of second generation myocardial contrast agents enables real time myocardial perfusion (RTP) echocardiography. RTP combined with ASE has shown promising results in evaluating myocardial ischaemia in dif-ferent patient populations and settings [10-18]. RTP has one possible advantage comparing to all three mentioned tech-niques; the ability to follow replenishment of myocardial perfusion in real-time. Therefore, RTP has the ability to com-pare myocardial perfusion and replenishment rate at rest and stress, which could add valuable information and perhaps increase the sensitivity of myocardial ischaemia detection. One drawback is the subjectivity of visual myocardial per-fusion evaluation by echocardiography, which demands experienced interpreters and limits the use of RTP-ASE. Tech-niques for objective quantification of myocardial perfusion in echocardiography are evolving and software programs are now commercially available. The quantitative techniques have shown promising results in animal experiments [19,20] and in humans [21-25]. However, there are few studies from clinical settings and most of these have been done with different software. If a quantitative echocardio-graphic technique were to show equivalent results to SPECT in detecting myocardial ischaemia, it could be an alternative method, more available and without radiation compared to SPECT, more tolerable and swifter than DSE, and more accu-rate than exercise ECG.
Qontrast® (AMID®, Roma, Italy; Bracco™, Milan, Italy) is a
recently developed and commercially available software, with algorithms that automatically follow the left myocar-dium contours throughout the cardiac cycle and through-out the replenishment period of the RTP image loop. Qontrast® may provide a practical way to quantify
myocar-dial perfusion by contrast echocardiography, and has shown promising initial results in both animals and patients with acute myocardial infarction [20,26]. How-ever, it has not yet been investigated in patients with sus-pected stable myocardial ischaemia.
The aim of the present study was to examine if RTP-ASE Qontrast® quantification can be used to correctly evaluate
myocardial ischaemia in patients with known or sus-pected stable coronary artery disease, as compared with visual evaluation of ischaemia by RTP-ASE, as well as with SPECT.
Methods
Patient population
We prospectively asked 69 randomly selected patients, without prior knowledge of acoustic windows, admitted to adenosine SPECT evaluation of known or suspected stable coronary artery disease, to participate in the study. Part of the study population has been presented previ-ously [18]. Two of the included patients had visually non-interpretable echocardiography images and were, there-fore, excluded from the study. The institutional ethics committee of the Lund University, Sweden, approved the study. Written informed consent was obtained from all participating patients.
Study protocol
Myocardial contrast echocardiography
The echocardiographic equipment used was a Sonos 5500 (Philips, Andover, Massachusetts, USA) with S3 probe and RTP using the power modulation angio-mode. Patients were examined in a left lateral recumbent posi-tion. The second-generation contrast agent Sonovue® was
infused in the left decubital vein using an infusion pump dedicated for this purpose (VueJect® Esaote, Genova, Italy;
Bracco™, Milan, Italy), which automatically rotates the syringe to prevent sedimentation. The infusion rate of Sonovue was set between 1.0 and 1.3 ml/min [27]. Ade-nosine and echo contrast were infused in the same periph-eral venous catheter, using a separate infusion pump through a three-way tap. Adenosine was given at an infu-sion rate of 100 μg/kg/min during one minute, after which the infusion rate was increased to 140 μg/kg/min. All 67 patients underwent RTP imaging (mechanical index = 0.1) during infusion of echo contrast, at rest and after a minimum of one minute of hyperaemia during adenosine stress (at 140 μg/kg/min). Image acquisition was started after at least one minute of Sonovue infusion. RTP image loops containing 8–10 heartbeats were col-lected from the parasternal long-axis and apical four- and two-chamber views, respectively. At the beginning of each loop a destruction impulse of 10 high mechanical index frames (mechanical index = 1.5) were given to destroy all contrast micro bubbles in the myocardium [28].
During RTP the angio-mode gain was set between 60 and 70%, depending on what was suitable for the individual patient as judged by a visual on-line assessment, and 2D greyscale gain was set at zero. Focus was set close to the base of the left ventricle. All images were stored digitally for later off-line analysis.
Qontrast® evaluation
Qontrast® was used to produce parametric images of
con-trast replenishment values for the RTP loops collected from both rest and stress. Two points were manually placed in the left ventricular cavity of the perfusion images. The first point was placed in the centre of the cav-ity where the apex "half-circle" ends, i.e. approximately two thirds from the base of ventricle, where it was always inside the cavity (never in the myocardium) during the complete loop. The point was placed in a cavity area that was fully opacified directly after the destruction impulse in the beginning of the loop, as well as throughout the entire RTP-loop, since this formed the basis of the maxi-mum image contrast intensity reference-point. Any iso-lated frames not fulfilling these criteria were excluded from analysis. The second point was placed at the base of the ventricle, enabling the software to automatically out-line the complete left ventricle, including both cavity and myocardium, with dotted "M-mode" lines crossing per-pendicular through the myocardial wall (Figure 1). The first frame was selected to be the one directly after destruction impulse frames.
Automatic perfusion analysis was then started. Qontrast®
uses an advanced image processing technique that recog-nizes the coherence of the dynamic image sequence in a space-time domain. The technique enables tracking of the myocardial pixel movement throughout the cardiac cycle and the entire RTP-loop. This increases the accuracy of the perfusion evaluation compared to triggered imaging, due to the higher number of quantifiable frames.
Three parametric images were then automatically gener-ated from the perfusion analysis, displaying either the peak signal intensity (A), myocardial blood flow velocity (β) or myocardial blood flow (Axβ). These were generated for each pixel, from the replenishment curve of each pixel, according to the replenishment curve A = A(1-e-βt) [29].
These parametric images were generated from RTP images in apical four- and two-chamber and parasternal long-axis view, at rest and stress, respectively.
To acquire quantitative values of A, β and Axβ, region of interests were manually traced both at rest and stress, cor-responding to the distribution territories of the three main coronary arteries; left anterior descending (LAD), left cir-cumflex (LCx) and right coronary artery (RCA) (Figure 2). Since earlier studies indicated that β is the most sensitive quantitative parameter [24,30], special care was taken that the tracing would align correctly in the parametric β image, avoiding red areas. These either correspond to con-trast in the left ventricular cavity, are due to perfusion arte-facts originating from main coronary arteries, or are caused by mathematically generated high β-values due to very low A-values, which predominantly occur in rest images where the A-values are low for physiological rea-sons.
Comparing A, β and Axβ values at rest and stress (hyper-aemia), the corresponding reserve values (A-r; β-r and Axβ-r) were derived by dividing the stress value with the matching rest value, thus resembling invasive measure-ment of coronary flow reserve. Accordingly, this generated three A-r, β-r, and Axβ-r values from the LAD territory, originating from the three different echocardiographic views (four-chamber, two-chamber, and long-axis views), two reserve values each from the LCx territory (four-cham-ber and long-axis views) and two from the RCA territory (four- and two-chamber views). The lowest A-r, β-r and
Manually placed points to enable an automatic outline of the complete left ventricle, including both cavity and myocar-dium, before automated Qontrast® perfusion analysis Figure 1
Manually placed points to enable an automatic out-line of the complete left ventricle, including both cav-ity and myocardium, before automated Qontrast® perfusion analysis.
Tracings of coronary territories of interest in four-chamber (middle), two-chamber (left) and long-axis (right) views
Figure 2
Tracings of coronary territories of interest in four-chamber (middle), two-four-chamber (left) and long-axis (right) views. LAD, left anterior descending; LCx, left cir-cumflex; RCA, right coronary artery.
Axβ-r value from any of the views corresponding to a cor-onary territory was selected for the ischaemia comparison with SPECT, since the lowest reserve value should origi-nate from the most ischaemic or the least perfused terri-tory.
RTP-ASE visual ischaemia interpretation
Two separate visual image interpretation were performed with off-line analysis of myocardial perfusion and wall motion at RTP-ASE, using the EnConcert Image Diagnosis Application (Philips, Andover, Massachusetts, USA). The first visual analysis was a combined analysis of perfusion and wall motion. The second visual analysis, performed separately, was an analysis excluding wall motion to esti-mate the value of sole perfusion analysis. Visual and quantitative perfusion analyses were done on separate occasions, blinded to one another and blinded to the result of SPECT. Each segment of the left ventricular myo-cardium was attributed to the same coronary vessel terri-tory at all analyses. Myocardial ischaemia was visually evaluated comparing rest and stress images, using both perfusion and wall motion analysis in a complementary manner. A visually detected perfusion defect during stress was used as the principal marker of ischaemia. Thus, a myocardial segment was considered ischaemic if per-fusion was impaired in the stress images, compared to the rest images [8]. Perfusion defects were analyzed during the first four beats after the destruction impulse at rest and after two beats at peak stress. Wall motion was used in addition to reveal perfusion defect artefacts at rest and to evaluate segments with suspected perfusion artefacts at stress. Since wall motion should not be normal if a seg-ment has a true perfusion defect at rest, a perfusion defect at rest was considered to be an artefact when wall motion was normal in that segment. A perfusion defect at peak stress was considered to be an artefact if there was a suspi-cion of a perfusion artefact, such as lateral or anterior shadowing from ribs or lungs, or basal segments shad-owed by contrast. In such segments, the ischaemic evalu-ation was based on wall motion analysis alone. If wall motion decreased at stress compared to rest images, the segment was considered ischaemic. Since perfusion can be decreased without a decrease in wall motion at ASE, the use of solitary wall motion analysis in segments with per-fusion artefacts might decrease the sensitivity with regard to ischaemia. However, this complementary use of wall motion analysis increases the number of interpretable seg-ments without negatively affecting specificity [12,18]. If there was disagreement between readers with regard to one segment, this particular segment was re-assessed in a joint reading until consensus was reached.
SPECT
The rest and stress studies were performed using a 2-day protocol, starting with injection of 600 MBq 99m
Tc-tetro-ASE. Normal findings at stress were not followed by a rest study [31,32]. Pathological stress studies were followed by a rest study with injection of 800 MBq 99mTc-tetrofosmin.
Patients who had cardiac medications, which could inter-fere with the stress test, were informed to have their med-ication interrupted prior to the stress test. The decision whether to interrupt the drug administration was at the discretion of the referring physician. A five-minute adeno-sine infusion protocol was used. Starting the infusion with 100 μg/ml/min of adenosine for 1 minute, the dose was then increased to 140 μg/ml/min for two minutes before injecting 99mTc-tetrofosmin. Infusion of adenosine
was continued for 2 min after the injection of 99m
Tc-tetro-fosmin. The scintigraphic data were acquired one hour after the end of the stress test, using continuous SPECT over 180 degree elliptical rotation from the 45 degree right anterior oblique position, with a dual-head gamma camera (Siemens AG Medical Solutions, Erlangen, Ger-many). Low energy high-resolution collimator and a zoom factor of 1.0 were used. We obtained 64 projections in a 128 × 128 matrix, with an acquisition time of 20 s per projection. Tomographic reconstruction and calculation of short axis slice images were performed using Siemens software. A two-dimensional Butterworth pre-reconstruc-tion filter was used with critical frequency of 0.35, order 5. For each patient, the same sets of short axis slices were then processed with an automatic software package (4D-MSPECT) on a Siemens e.soft workstation. The software package defined apex and base and generated, coronal, longitudinal, sagital tomographic slices as well as polar maps with schematic map of the territories of the main coronary arteries used for scoring. Radiotracer uptake of the vascular segments were scored visually and stress images were compared with rest images regarding ischae-mia and infarct. The specialist in nuclear medicine who performed the scoring was blinded to the results of the RTP analysis.
Statistical analysis
Method of reference for the ischaemia evaluation in the study was the presence or absence of reversible ischaemia at the SPECT examination. Continuous variables are expressed as mean ± 1SD and as percent. P < 0.05 denoted significance. Receiver operating characteristic (ROC) curves were used to examine and compare predictive abil-ity of different parametric variables, by calculating sensi-tivity, specificity, accuracy, positive and negative predictive values (PPV, NPV) and area under the curve (AUC). Unpaired t-test was used to test for difference between patients. For intra-assay variability of quantita-tive measurements of A and β, coefficient of variation was used.
Results
sion had minor but significant effects on both heart rate and blood pressure, where heart rate increased from 72 ± 14 to 82 ± 14 (p < 0.001), systolic blood pressure decreased from 133 ± 20 to 127 ± 20 (p < 0.001) and pulse-pressure product increased from 9.65 ± 2.32 k to 10.44 ± 2.57 k (p < 0.001). Only minor side-effects occurred and no stress-test had to be interrupted due to side-effects. At SPECT 18 patients (27%) were ischaemic with a total of 19 ischaemic territories; 10 LAD territories, 5 LCx territories and 4 RCA territories.
Of the 201 coronary distribution territories, 28 (14%) could not be analyzed due to perfusion artefacts according to the visual perfusion analysis. These territories were still evaluated in the visual perfusion analysis with combined wall motion evaluation, since wall motion still could be analyzed in these territories. In the quantitative analysis two more territories were considered non-interpretable using the Qontrast® software due to low parametric image
quality, which made it too difficult to differentiate the left ventricular myocardium from the cavity. A summary of non-interpretable territories is presented in Table 2. In Table 3 the different results from both quantitative and visual interpretations are summarized. Quantitative reserve parameters β-r and Axβ-r showed significant AUC and kappa in all coronary territories. All quantitative reserve parameters expressed significant kappa values in the LAD coronary territory. Both visual analyses demon-strated higher kappa values and accuracy than any quanti-tative parameter.
From the ROC curves (Figure 3a-d) AUC is visualized and levels of sensitivity at different specificity values can be estimated. Despite the non-significant AUC for all reserve variables in the LCx and RCA territories, there is a notable level of sensitivity at preserved 100% specificity for β-r in both territories, and for Axβ-r in the RCA territory. Figure 4 represents a graph of accuracy between different modal-ities of RTP-ASE versus SPECT. When dividing the patient population into those without and those with ischemia at SPECT, there were significant differences for A-r, β-r and Axβ-r in the LAD territory and for β-r in the all-territory analysis. All variables and territory differences are given in Table 4.
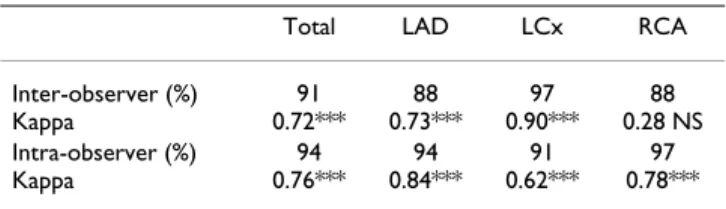
Intra-observer variability for A and β was assessed by a sec-ond blinded reading of 10 randomly selected patients from the study. Variability was 6.0% and 18% for A and β, respectively. Visual inter- and intra-observer variability is presented in Table 5.
Discussion
This agreement study indicates that Qontrast® could
possi-bly be used for quantitative measurements of myocardial ischaemia from RTP-ASE acquired images, but only in the LAD territory. All three quantitative parameters, A-r, β-r and Axβ-r showed significant agreement with SPECT in the LAD territory. Only β-r and Axβ-r showed significant agreement with SPECT in the all-territory analysis, but in the analyses by the specific coronary territories they only showed significant agreement with SPECT in the LAD ter-ritory. Qontrast® provides consistently high negative
pre-dictive values and reasonably high specificity at present cut off values, which is of importance for ruling out ischaemia. Sensitivity and positive predictive value could Table 1: Patient characteristics (n = 67 unless otherwise noted).
Age 68 (± 10) Male 33 % LVEF at rest 54 (± 11) % Previous AMI 40 % Previous PCI 19 % Previous CABG 13 % Heart failure 13 % Hypertension 48 % Valvular surgery 0 % Beta-blocker 57 % ACE inhibitor 28 % ARB 12 %
Nitro-glycerine (short acting) 57 %
Nitrates (long acting) 25 %
Diuretics 27 %
Calcium blocker 18 %
Sinus rhythm 93 %
Dilated left ventricle 13 %
Dilated left atrium (n = 43) 33 % Significant valvular disease (n = 43) 7 %
Regional WMA/PD at rest 60 %
LVEF, left ventricular ejection fraction; AMI, acute myocardial infarction; PCI, percutaneous coronary intervention, CABG, coronary artery bypass grafting; ACE, angiotensin converting enzyme; ARB, angiotensin-receptor blocker, WMA, wall motion abnormality; PD, perfusion defect.
Table 2: Non interpretable coronary territories for Qontrast® quantification and visual interpretation with complementary wall
motion analysis (Vis 1) and sole perfusion interpretation (Vis 2). All Territories (n = 201) LAD (n = 67) LCx (n = 67) RCA (n = 67) Patient (n = 67) Qontrast® (%) 30 (15) 12 (18) 16 (24) 2 (3) 15 (22) Vis 1 (%) 0 0 0 0 0 Vis 2 (%) 28 (14) 11 (16) 16 (24) 1 (1) 22 (33)
perhaps have been higher if the segments analyzed had been more detailed, i.e. following a 17 segment model. However, then there probably would have been a greater anatomical mismatch between echocardiography and SPECT. Visual evaluation of myocardial ischaemia showed better results than automated quantification using Qontrast®. The visual analysis using a combination
of perfusion and wall motion to increase the number of interpretable segments, as well as the sole perfusion anal-ysis, both showed excellent agreement with SPECT, which has been suggested previously [10,11,33,34]. It should be noted, however, that adenosine is a suboptimal stressor for wall motion analysis only [3].
There are of course differences between RTP-ASE and SPECT. The spatial resolution of echocardiography is higher than with SPECT, which might suggest missed minor ischaemic territories at SPECT. However, it is known that a SPECT image without signs of ischaemia is associated with few cardiac events [7]. Also, replenish-ment curves are not possible to produce using SPECT imaging, which might lead to differences between the two
have been partly elucidated if coronary angiography had been performed, and the lack of such examination. Fur-thermore, the fact that coronary angiography was not available in these patients prohibit us from separating per-fusion defects caused by macro-vascular or by micro-vas-cular disease this might be considered a limitation of the study. However, both SPECT and RTP-ASE assess myocar-dial perfusion, whereas coronary angiography presents a morphological image, which is the main reason why SPECT was chosen as reference method. A major disad-vantage of the quantitative detection of ischaemia, com-pared with visual interpretation, is the much lower feasibility, where the present study shows nearly 20% non-interpretable segments using Qontrast®. Visual
inter-pretation with complementary wall motion analysis could be performed in all of the included patients. The study findings only apply to patient groups with sus-pected myocardial ischaemia and, for example, not to patient populations with acute coronary syndrome. The results indicate that the quantification of myocardial ischaemia is still in need of improvement to be clinically Table 3: Results for the respective quantitative variables and visual interpretations (QV), A-reserve, (A-r), -reserve, ( -r) and Ax -reserve (Ax -r), visual RTP-ASE interpretation with complementary wall motion (Vis 1) and with sole perfusion interpretation (Vis 2).
QV Coronary Territory Acc (%) Sens (%) Spec (%) PPV (%) NPV (%) kappa AUC A All 43 39 75 11 94 NS 0.529 NS A LAD 67 66 75 27 94 0.237 * 0.705 NS A LCx 29 28 50 6 87 NS 0.229 NS A RCA 32 28 100 8 100 NS 0.518 NS All 80 83 56 25 95 0.249 *** 0.678 * LAD 82 83 75 43 95 0.442 ** 0.773 * β LCx 82 94 25 25 94 NS 0.590 NS β RCA 72 74 50 11 96 NS 0.666 NS Ax All 75 77 63 22 95 0.213 ** 0.665 * Ax LAD 82 83 75 43 95 0.442 ** 0.818 ** Axβ LCx 90 96 25 33 94 NS 0.404 NS Axβ RCA 58 57 75 10 97 NS 0.680 NS A Patient wise 35 11 100 29 11 NS NA Patient wise 60 53 79 38 87 0.233 * NA
Axβ Patient wise 47 38 73 31 79 NS NA
Vis 1 All 93 90 93 59 99 0.67 *** NA
Vis 1 LAD 87 90 86 53 98 0.59 *** NA
Vis 1 LCx 94 100 94 56 100 0.68 *** NA
Vis 1 RCA 96 75 100 100 98 0.85 *** NA
Vis 1 Patient wise 90 89 90 76 96 0.75 *** NA
Vis 2 All 92 94 92 55 99 0.67 *** NA
Vis 2 LAD 86 100 83 53 100 0.61 *** NA
Vis 2 LCx 94 100 94 57 100 0.68 *** NA
Vis 2 RCA 95 75 97 60 98 0.64 *** NA
Vis 2 Patient wise 89 91 88 71 97 0.73 *** NA A, peak signal intensity; β, myocardial blood flow velocity; Axβ, myocardial blood flow; Acc, accuracy; Sens, sensitivity; Spec, specificity; PPV, positive predictive value; NPV, negative predictive value; AUC, area under the curve; * = p < 0.05; ** = p < 0.01; *** = p < 0.001; NS, not significant; NA, not applicable. Bold indicates significance and italics indicates not significant or not applicable.
poor results are probably due to the high level of software automatic tissue recognition. However, this is expected to improve in the future, when both echocardiographic image quality and the algorithms for tissue or contrast rec-ognition are expected to improve, leading to higher signal to noise ratio[35]. So far in echocardiography, human brain capacity and experience seem to beat the computer in perfusion contrast echocardiography. Still, a combina-tion of visual and software-based analysis might be of interest [23,36]. Moreover, the justification of the cost of echo contrast and its real clinical additive value needs to be conclusively proven.
Contrast safety
The U.S. Food and Drug Administration issued on Octo-ber the 10th 2007 a "black box" warning for
perflutren-containing contrast agents, which caused considerable controversies within the echocardiography community [37]. This warning was later relaxed [38]. Three recent large retrospective studies have disputed the suggestion that using the current generation echo contrast would pose a hazard to the patient [38-40]. Kusnetzky and co-workers reported single-centre data on 18.671 consecutive studies and found no increased acute mortality in patients who had received a contrast agent [39]. Main et al. reported data from a multicenter registry that included 4.300.966 consecutive patients [38]. Their finding was that patients who had received echo contrast actually had a lower mortality rate compared to those who had not received contrast. Furthermore, Dolan et al. compared 23.659 patients from three U.S. medical centres who had received echo contrast, at a rest examination, with 5.900
a-d. Receiver operator characteristics curves of the quantitative perfusion measurements A-, β- and Axβ- reserve in all coro-nary territories (a), LAD territory (b), LCx territory (c) and RCA territory (d), as compared with ischaemia at SPECT
Figure 3
a-d. Receiver operator characteristics curves of the quantitative perfusion measurements A-, - and Ax - reserve in all coronary territories (a), LAD territory (b), LCx territory (c) and RCA territory (d), as compared with ischaemia at SPECT. LAD, left anterior descending; LCx, left circumflex; RCA, right coronary artery; A-r, peak signal intensity reserve; β-r, myocardial blood flow velocity reserve; Axβ-r, myocardial blood flow reserve.
A graph of accuracy between different modalities of RTP-ASE versus SPECT
Figure 4
A graph of accuracy between different modalities of RTP-ASE versus SPECT. Left anterior descending (LAD), left circumflex (LCx) and right coronary artery (RCA). Peak signal intensity (A), myocardial blood flow velocity (β), myocardial blood flow (Axβ).
Table 4: t-test for quantitative variables (QV) peak signal intensity (A), myocardial blood flow velocity ( ) and myocardial blood flow (Ax ) at rest, stress and their respective reserves, if no ischaemia or ischaemia at SPECT.
No Ischaemia at SPECT Ischaemia at SPECT
QV CA Rest Stress Reserve Rest Stress Reserve
A All 46.9 ± 14.6 55.7 ± 10.1 1.13 ± 0.60 44.3 ± 15.3 52.0 ± 9.6 1.33 ± 1.26 A LAD 48.7 ± 9.7 56.7 ± 11.7 1.05 ± 0.32 51.2 ± 7.9 51.3 ± 4.9 0.86 ± 0.20 * A LCx 37.1 ± 14.1 53.8 ± 6.5 1.48 ± 0.91 26.0 ± 12.4 46.7 ± 1.3 ** 2.78 ± 2.00 A RCA 54.9 ± 13.3 56.3 ± 10.9 0.92 ± 0.28 51.5 ± 13.5 57.2 ± 17.0 0.82 ± 0.34 β All 1.12 ± 0.41 4.7 ± 3.3 2.52 ± 1.98 1.26 ± 0.38 3.2 ± 1.6 ** 1.55 ± 0.87 * β LAD 1.15 ± 0.36 3.8 ± 1.6 1.77 ± 0.75 1.28 ± 0.25 2.7 ± 1.3 1.20 ± 0.59 * β LCx 1.16 ± 0.47 6.4 ± 4.3 3.58 ± 2.74 1.04 ± 0.26 3.9 ± 2.3 2.39 ± 1.14 β RCA 1.04 ± 0.40 4.1 ± 2.8 2.28 ± 1.59 1.51 ± 0.64 3.4 ± 1.8 1.41 ± 0.65 * Axβ All 55.7 ± 32.4 261 ± 18 3.54 ± 4.60 59.6 ± 31.5 172 ± 100 ** 2.87 ± 4.13 Axβ LAD 60.2 ± 26.9 222 ± 118 2.21 ± 1.38 68.0 ± 17.2 138 ± 58 ** 1.11 ± 0.71 * Axβ LCx 47.0 ± 34.5 346 ± 235 6.20 ± 7.24 28.5 ± 16.7 187 ± 111 7.91 ± 6.18 Axβ RCA 60.2 ± 33.7 232 ± 166 2.53 ± 2.17 79.7 ± 45.8 222 ± 147 1.35 ± 0.85 * CT, coronary territory; *, p < 0.05; **, p < 0.01 for level of significant difference between no ischaemia and ischaemia at SPECT.
controls who had not received contrast, and found no increased mortality or nonfatal myocardial infarct in patients who had received contrast [40]. Dolan and co-workers extended their analysis and compared 10.788 patients who had undergone stress echocardiography (DSE or exercise stress echocardiography) and received contrast with 15.989 who had not received contrast. No increased mortality or nonfatal myocardial infarct in patients who had received contrast could be found also in this cohort. These studies clearly show that using echo contrast in stable patients does not pose a significant risk. This knowledge must be weighted against the hazards of a non-diagnostic echocardiography examination, and the potential risks accompanied by alternative tests. The use of contrast in difficult to image patients has been proven cost effective [41], however cost effectiveness remains to be demonstrated in the setting of RTP-ASE.
Conclusion
The results of the present agreement study indicate that RTP-ASE Qontrast® quantification of myocardial
ischae-mia is less accurate than visual evaluation, as compared with SPECT. At present this method cannot be recom-mended for clinical use, but future development of echocardiographic image quality and software properties may improve the method.
Competing interests
The authors declare that they have no competing interests.
Authors' contributions
PG, RW, MD and RBW initiated the study. RW, MD and OT supervised the study and participated in the interpre-tation of the results and manuscript preparation. PG per-formed measurements, made all data conversions, plots and calculations from ultrasound data, and participated in the preparation of the manuscript. PG, KS, RW and MD participated in data collection, performed statistical anal-ysis and participated in the interpretation of the results. LL and RBW participated in the interpretation of the results, in the creation of plots and in the preparation of the man-uscript. MK participated in the interpretation of the results and preparation of the manuscript. All authors read and approved the final manuscript.
Acknowledgements
This study was supported by grants from University Hospital UMAS, Malmö and The Laerdal Foundation for Acute Medicine. We thank the personnel at the Department of Clinical Physiology and the Department of Cardiol-ogy, University Hospital UMAS, Malmö for their skilful assistance with and in conjunction to scintigraphic and echocardiographic examinations.
References
1. Erhardt L, Herlitz J, Bossaert L, Halinen M, Keltai M, Koster R, Mar-cassa C, Quinn T, van Weert H: Task force on the management
of chest pain. Eur Heart J 2002, 23(15):1153-1176.
2. Cardiology TFotESo: Management of stable angina pectoris.
Recommendations of the Task Force of the European Soci-ety of Cardiology. Eur Heart J 1997, 18(3):394-413.
3. Sicari R, Nihoyannopoulos P, Evangelista A, Kasprzak J, Lancellotti P, Poldermans D, Voigt JU, Zamorano JL: Stress echocardiography
expert consensus statement: European Association of Echocardiography (EAE) (a registered branch of the ESC). Eur J Echocardiogr 2008, 9(4):415-437.
4. Schinkel AF, Bax JJ, Geleijnse ML, Boersma E, Elhendy A, Roelandt JR, Poldermans D: Noninvasive evaluation of ischaemic heart
dis-ease: myocardial perfusion imaging or stress echocardiogra-phy? Eur Heart J 2003, 24(9):789-800.
5. Picano E: Stress echocardiography. Expert Rev Cardiovasc Ther 2004, 2(1):77-88.
6. Sozzi FB, Elhendy A, Roelandt JR, van Domburg RT, Schinkel AF, Vourvouri EC, Bax JJ, Rizzello V, Poldermans D: Long-term
prog-nosis after normal dobutamine stress echocardiography. Am J Cardiol 2003, 92(11):1267-1270.
7. Underwood SR, Anagnostopoulos C, Cerqueira M, Ell PJ, Flint EJ, Har-binson M, Kelion AD, Al-Mohammad A, Prvulovich EM, Shaw LJ, et al.:
Myocardial perfusion scintigraphy: the evidence. Eur J Nucl Med Mol Imaging 2004, 31(2):261-291.
8. Lafitte S, Matsugata H, Peters B, Togni M, Strachan M, Kwan OL, DeMaria AN: Comparative value of dobutamine and
adenos-ine stress in the detection of coronary stenosis with myocar-dial contrast echocardiography. Circulation 2001, 103(22):2724-2730.
9. Takeishi Y, Chiba J, Abe S, Ikeda K, Tomoike H:
Adenosine-echocardiography for the detection of coronary artery dis-ease. J Cardiol 1994, 24(1):1-7.
10. Mor-Avi V, Caiani EG, Collins KA, Korcarz CE, Bednarz JE, Lang RM:
Combined assessment of myocardial perfusion and regional left ventricular function by analysis of contrast-enhanced power modulation images. Circulation 2001, 104(3):352-357.
11. Gudmundsson P, Winter R, Dencker M, Kitlinski M, Thorsson O, Ljunggren L, Willenheimer R: Real-time perfusion adenosine
stress echocardiography versus myocardial perfusion adeno-sine scintigraphy for the detection of myocardial ischaemia in patients with stable coronary artery disease. Clin Physiol Funct Imaging 2006, 26(1):32-38.
12. Winter R, Gudmundsson P, Willenheimer R: Real-time perfusion
adenosine stress echocardiography in the coronary care unit: a feasible bedside tool for predicting coronary artery stenosis in patients with acute coronary syndrome. Eur J Echocardiogr 2005, 6(1):31-40.
13. Mulvagh SL: Advances in myocardial contrast
echocardiogra-phy and the role of adenosine stress. Am J Cardiol 2004, 94(2A):12D-17D.
14. Jeetley P, Hickman M, Kamp O, Lang RM, Thomas JD, Vannan MA, Vanoverschelde JL, Wouw PA van der, Senior R: Myocardial
con-trast echocardiography for the detection of coronary artery stenosis: a prospective multicenter study in comparison with single-photon emission computed tomography. J Am Coll Car-diol 2006, 47(1):141-145.
15. Korosoglou G, Dubart AE, DaSilva KG Jr, Labadze N, Hardt S, Hansen A, Bekeredjian R, Zugck C, Zehelein J, Katus HA, et al.: Real-time
myocardial perfusion imaging for pharmacologic stress test-ing: added value to single photon emission computed tomog-raphy. Am Heart J 2006, 151(1):131-138.
16. Tsutsui JM, Xie F, McGrain AC, Mahrous H, Hankins J, O'Leary EL, Porter TR: Comparison of low-mechanical index pulse
sequence schemes for detecting myocardial perfusion abnormalities during vasodilator stress echocardiography. Am J Cardiol 2005, 95(5):565-570.
Table 5: Agreement of visual myocardial contrast echocardiography ischaemia interpretation (n = 33).
Total LAD LCx RCA
Inter-observer (%) Kappa 91 0.72*** 88 0.73*** 97 0.90*** 88 0.28 NS Intra-observer (%) Kappa 94 0.76*** 94 0.84*** 91 0.62*** 97 0.78*** LAD, Left anterior descending coronary artery; LCx, Left Circumflex artery; RCA, Right posterior descending coronary artery; **, p < 0.01; ***, p < 0.001, NS, not significant.
Publish with BioMed Central and every scientist can read your work free of charge "BioMed Central will be the most significant development for disseminating the results of biomedical researc h in our lifetime."
Sir Paul Nurse, Cancer Research UK
Your research papers will be:
available free of charge to the entire biomedical community peer reviewed and published immediately upon acceptance cited in PubMed and archived on PubMed Central yours — you keep the copyright
Submit your manuscript here: BioMedcentral
17. Wasmeier GH, Asmussen S, Voigt JU, Flachskampf FA, Daniel WG, Nixdorff U: Real-time myocardial contrast stress
echocardi-ography using bolus application. Ultrasound Med Biol 2008, 34(11):1724-1731.
18. Gudmundsson P, Shahgaldi K, Winter R, Dencker M, Kitlinski M, Thorsson O, Ljunggren L, Willenheimer R: Head to head
compar-isons of two modalities of perfusion adenosine stress echocardiography with simultaneous SPECT. Cardiovasc Ultra-sound 2009, 7:19.
19. Lafitte S, Higashiyama A, Masugata H, Peters B, Strachan M, Kwan OL, DeMaria AN: Contrast echocardiography can assess risk area
and infarct size during coronary occlusion and reperfusion: experimental validation. J Am Coll Cardiol 2002, 39(9):1546-1554.
20. Agati L, Tonti G, Pedrizzetti G, Magri F, Funaro S, Madonna M, Celani F, Messager T, Broillet A: Clinical application of quantitative
analysis in real-time MCE. Eur J Echocardiogr 2004, 5(Suppl 2):S17-23.
21. Bekeredjian R, Hilbel T, Filusch A, Hansen A, Benz A, Zehelein J, Kuecherer HF: Fourier phase and amplitude analysis for
auto-mated objective evaluation of myocardial contrast echocar-diograms. Int J Cardiovasc Imaging 2003, 19(2):117-128.
22. Peltier M, Vancraeynest D, Pasquet A, Ay T, Roelants V, D'Hondt AM, Melin JA, Vanoverschelde JL: Assessment of the physiologic
sig-nificance of coronary disease with dipyridamole real-time myocardial contrast echocardiography. Comparison with technetium-99m sestamibi single-photon emission com-puted tomography and quantitative coronary angiography. J Am Coll Cardiol 2004, 43(2):257-264.
23. Korosoglou G, da Silva KG Jr, Labadze N, Dubart AE, Hansen A, Rosenberg M, Zehelein J, Kuecherer H: Real-time myocardial
contrast echocardiography for pharmacologic stress testing: is quantitative estimation of myocardial blood flow reserve necessary? J Am Soc Echocardiogr 2004, 17(1):1-9.
24. Malm S, Frigstad S, Torp H, Wiseth R, Skjarpe T: Quantitative
ade-nosine real-time myocardial contrast echocardiography for detection of angiographically significant coronary artery dis-ease. J Am Soc Echocardiogr 2006, 19(4):365-372.
25. Bierig SM, Mikolajczak P, Herrmann SC, Elmore N, Kern M, Labovitz AJ: Comparison of myocardial contrast echocardiography
derived myocardial perfusion reserve with invasive determi-nation of coronary flow reserve. Eur J Echocardiogr 2008.
26. Agati L, Tonti G, Galiuto L, Di Bello V, Funaro S, Madonna MP, Gar-ramone B, Magri F: Quantification methods in contrast
echocardiography. Eur J Echocardiogr 2005, 6(Suppl 2):S14-20.
27. Becher H, Burns P: Handbook of Contrast Echocardiography.
Left ventricular function and myocardial perfusion. Frankfurt
and New York: Springer Verlag; 2000.
28. Bahlmann EB, McQuillan BM, Handschumacher MD, Chow CM, Guerrero JL, Picard MH, Weyman AE, Scherrer-Crosbie M: Effect of
destructive pulse duration on the detection of myocardial perfusion in myocardial contrast echocardiography: In vitro and in vivo observations. J Am Soc Echocardiogr 2002, 15(12):1440-1447.
29. Wei K, Jayaweera AR, Firoozan S, Linka A, Skyba DM, Kaul S:
Quan-tification of myocardial blood flow with ultrasound-induced destruction of microbubbles administered as a constant venous infusion. Circulation 1998, 97(5):473-483.
30. Moir S, Haluska BA, Jenkins C, McNab D, Marwick TH: Myocardial
blood volume and perfusion reserve responses to combined dipyridamole and exercise stress: a quantitative approach to contrast stress echocardiography. J Am Soc Echocardiogr 2005, 18(11):1187-1193.
31. Hesse B, Tagil K, Cuocolo A, Anagnostopoulos C, Bardies M, Bax J, Bengel F, Busemann Sokole E, Davies G, Dondi M, et al.: EANM/ESC
procedural guidelines for myocardial perfusion imaging in nuclear cardiology. Eur J Nucl Med Mol Imaging 2005, 32(7):855-897.
32. Henzlova MJ, Cerqueira MD, Mahmarian JJ, Yao SS: Stress
proto-cols and tracers. J Nucl Cardiol 2006, 13(6):e80-90.
33. Sieswerda GT, Yang L, Boo MB, Kamp O: Real-time perfusion
imaging: a new echocardiographic technique for simultane-ous evaluation of myocardial perfusion and contraction. Echocardiography 2003, 20(6):545-555.
34. Olszowska M, Kostkiewicz M, Tracz W, Przewlocki T: Assessment
of myocardial perfusion in patients with coronary artery dis-ease. Comparison of myocardial contrast echocardiography
and 99mTc MIBI single photon emission computed tomog-raphy. Int J Cardiol 2003, 90(1):49-55.
35. Yoshifuku S, Chen S, McMahon E, Korinek J, Yoshikawa A, Ochiai I, Sengupta PP, Belohlavek M: Parametric detection and
measure-ment of perfusion defects in attenuated contrast echocardi-ographic images. J Ultrasound Med 2007, 26(6):739-748.
36. Yu EH, Skyba DM, Leong-Poi H, Sloggett C, Jamorski M, Garg R, Iwan-ochko RM, Siu SC: Incremental value of parametric
quantita-tive assessment of myocardial perfusion by triggered Low-Power myocardial contrast echocardiography. J Am Coll Car-diol 2004, 43(10):1807-1813.
37. Main ML, Goldman JH, Grayburn PA: Thinking outside the
"box"-the ultrasound contrast controversy. J Am Coll Cardiol 2007, 50(25):2434-2437.
38. Main ML, Ryan AC, Davis TE, Albano MP, Kusnetzky LL, Hibberd M:
Acute mortality in hospitalized patients undergoing echocardiography with and without an ultrasound contrast agent (multicenter registry results in 4,300,966 consecutive patients). Am J Cardiol 2008, 102(12):1742-1746.
39. Kusnetzky LL, Khalid A, Khumri TM, Moe TG, Jones PG, Main ML:
Acute mortality in hospitalized patients undergoing echocardiography with and without an ultrasound contrast agent: results in 18,671 consecutive studies. J Am Coll Cardiol
2008, 51(17):1704-1706.
40. Dolan MS, Gala SS, Dodla S, Abdelmoneim SS, Xie F, Cloutier D, Bierig M, Mulvagh SL, Porter TR, Labovitz AJ: Safety and efficacy of
commercially available ultrasound contrast agents for rest and stress echocardiography a multicenter experience. J Am Coll Cardiol 2009, 53(1):32-38.
41. Mulvagh SL, Rakowski H, Vannan MA, Abdelmoneim SS, Becher H, Bierig SM, Burns PN, Castello R, Coon PD, Hagen ME, et al.:
Amer-ican Society of Echocardiography Consensus Statement on the Clinical Applications of Ultrasonic Contrast Agents in Echocardiography. J Am Soc Echocardiogr 2008, 21(11):1179-1201.