High disaccharide intake associates with atherogenic lipoprotein profile
Emily Sonestedt
1*, Elisabet Wirfa¨lt
1, Peter Wallstro
¨m
1, Bo Gullberg
1, Isabel Drake
1, Joanna Hlebowicz
1,
Gunilla Nordin Fredrikson
1, Bo Hedblad
1, Jan Nilsson
1, Ronald M. Krauss
2and Marju Orho-Melander
11Department of Clinical Sciences – Malmo¨, Lund University, SE-205 02 Malmo¨, Sweden 2Children’s Hospital Oakland Research Institute, Oakland, CA 94609, USA
(Submitted 10 August 2010 – Final revision received 19 May 2011 – Accepted 16 June 2011 – First published online 20 October 2011)
Abstract
Increased plasma concentrations of small LDL particles denote an atherogenic lipoprotein phenotype (ALP) that is correlated with increased circulating TAG and reduced HDL-cholesterol. Principal component analyses of subfraction concentrations have previously been used in the Swedish population-based Malmo¨ Diet and Cancer (MDC) cohort to identify three independent components, one pattern representing the ALP. The aim of the present study was to examine the associations between macronutrient intakes and the principal component representing the ALP. We examined 4301 healthy subjects (46 – 68 years old, 60 % women) at baseline in the MDC cohort. Dietary data were collected using a modified diet history method. Plasma lipoprotein subfractions were measured using a high-resolution ion mobility method. The principal component corresponding to the ALP was significantly associated with a higher intake of disaccharides, and inversely related to protein and alcohol consumption (P, 0·001 for all). The present findings indicate that the ALP may be improved by a low intake of disaccharides, and moderate intakes of protein and alcohol.
Key words:Macronutrients: Atherogenic lipoprotein phenotype: Lipoprotein subfractions: Epidemiology
The majority of prospective epidemiological studies have shown that plasma levels of lipids and lipoproteins predict CVD(1). However, there is considerable heterogeneity among lipoproteins in terms of size and density(2), and some studies have indicated that specific lipoprotein subfractions are more predictive of CVD than others(3). For example, small and medium LDL particles showed strong positive associations with CVD, whereas concentrations of large LDL particles were not significantly associated with CVD in the Malmo¨ Diet and Cancer (MDC) study(4). However, it is unclear whether measure-ment of the total number of LDL particles or the concentration of specific subfractions is more predictive of CVD(5). The athero-genic lipoprotein phenotype (ALP), which comprises a higher proportion of small LDL particles, reduced HDL-cholesterol (HDL-C) and increased TAG, is associated with substantially higher CVD risk(4,6). By using a principal component analysis, a data-driven unsupervised statistical procedure designed to capture independent clusters of lipoprotein subfractions that can reflect the underlying mechanistic pathways, we have earlier in the MDC cohort demonstrated that one of the com-ponents closely matching the ALP was associated with 22 % increased risk for CVD per standard deviation(4).
Numerous studies have examined the effect of short-term diet interventions on LDL-cholesterol (LDL-C) and HDL-C
concentrations. For example, high intakes of saturated fat increase LDL-C(7,8); however, saturated fat seems to be mainly associated with the large, less atherogenic, LDL particles(9,10). On the other hand, there are indications that carbohydrates, particularly simple sugars and starches, are major determinants of small LDL particle concentrations(11). The overall aim of the present study was to examine the association between dietary macronutrient intakes and lipo-protein subfractions in an observational setting. Since there are strong correlations among various lipoprotein subfrac-tions(4), we specifically examined dietary factors associated with the lipoprotein pattern corresponding to the ALP.
Subjects and methods Subjects and data collection
The MDC study is a prospective population-based cohort (n 30 447) with baseline examinations conducted between 1991 and 1996. Women born between 1923 and 1950 and men born between 1923 and 1945 and living in Malmo¨ were invited to participate. The examination included was as follows: assessment of dietary habits using a modified diet history method; assessment of socio-economic, demographic
* Corresponding author: E. Sonestedt, fax þ 46 40 39 13 22, email emily.sonestedt@med.lu.se
Abbreviations: ALP, atherogenic lipoprotein phenotype; E%, percentage of energy; HDL-C, HDL-cholesterol; LDL-C, LDL-cholesterol; MDC, Malmo¨ Diet and Cancer; PC, principal component.
qThe Authors 2011
British
Journal
of
and lifestyle factors; medication and diet supplement use; previous and current diseases using an extensive self-administered questionnaire. Medication use was also reported during seven consecutive days. Leisure-time physical activity was obtained from a list of different physical activities in the questionnaire (eighteen items) that were adapted from the Minnesota Leisure Time Physical Activity Instrument(12). The subjects were asked to estimate the number of minutes per week, and for each of the four seasons, they spent performing eighteen different physical activities. The duration of each activity was multiplied by an intensity factor, creating a leisure-time physical activity score. The ability of the physical activity questionnaire to rank individuals was examined among 369 subjects against an accelerometer. Spearman’s correlation coefficients between the two methods were 0·35 in men and 0·24 in women(13). Nurses conducted anthropo-metric measurements, measured blood pressure and collected blood (non-fasting samples). Weight was measured to the nearest 0·1 kg by trained project staff members using a balance beam scale, with subjects wearing light clothing and no shoes; height was measured with a fixed stadiometer calibrated in centimetres. BMI was defined as the weight (kg) divided by the square of height (m2).
Between 1991 and 1994, 6103 subjects were randomly selected from the cohort to participate in a cardiovascular subcohort where additional examinations of cardiovascular risk factors were performed, including fasting lipid levels according to the standard procedures. Fasting plasma samples were obtained from 5540 subjects and stored at 2 808C. Of these individuals, 4751 had information for all lipoprotein subfractions. After excluding individuals using lipid-lowering therapy (n 116), those with a history of myocardial infarction or stroke identified through local and national registries (n 99), those with a history of diabetes (self-reported diagnosis or use of diabetes medication) (n 131) and those without dietary data (n 130), 4301 subjects remained and constituted the study sample of the present study. The MDC study was conducted according to the guidelines laid down in the Declaration of Helsinki and were approved by the ethics committee at Lund University. Written informed consent was obtained from all participants.
Dietary data
The modified diet history method specifically designed for the MDC study(14)is a combination of the following: (1) a 7 d food diary that collected information on cooked lunches and dinner meals, cold beverages, and diet supplements and (2) a 168-item dietary questionnaire covering foods regularly consumed during the past year. The subjects estimated frequencies of food intake, and usual portion sizes were assessed using a booklet of photographic aids. During a 1 h interview, the subjects were asked questions about food choices, food preparation practices and portion sizes of the foods collected in the food diary (using a more extensive book of photos). The interviewer also checked the food diary and dietary questionnaire for overlapping information, as well as for very high reported intakes. The average daily
intake of foods was calculated based on the information available in the food diary (and interview) and the question-naire. The average daily food intake was converted to nutrient intake data using the MDC food and nutrition database specifi-cally developed for the MDC study and originating from PC KOST2-93 of the Swedish National Food Administration, Uppsala, Sweden.
The dietary variables (both from diet and supplements) examined in the present study were as follows: total energy (kJ/d; including energy from fat, carbohydrates, protein, alcohol and dietary fibre); percentage of energy (E%; from non-alcohol and non-fibre energy intake) from fat, protein, carbohydrates, monosaccharides, disaccharides, complex carbohydrates, SFA, MUFA, PUFA, n-3 PUFA and n-6 PUFA; fibre density (g/1000 kJ); cholesterol intake (mg/1000 kJ); alcohol intake (energy percentage from total energy intake). Complex carbo-hydrates were calculated from total carbohydrate intake minus monosaccharides and disaccharides; n-3 PUFA were calcu-lated as the sum of a-linolenic, eicosapentaenoic, docosahex-aenoic and docosapentdocosahex-aenoic acid; n-6 PUFA were calculated as the sum of linoleic and arachidonic acid. The relative validity of the dietary method has been presented earlier(15) and was examined among 105 women and 101 men; 18 d of weighed food records (3 d every second month) collected over 1 year was used as the reference method. In summary, energy-adjusted Pearson’s correlations were in the range of 0·53 – 0·80, except for PUFA among men with a correlation of 0·26.
We identified individuals who potentially reported non-adequate energy intake by comparing the individually estimated physical activity level (total energy expenditure divided by BMR), with energy intake divided by BMR. This procedure has been described in detail elsewhere(16). Total energy expenditure was calculated from self-reported information on physical activity at work, leisure-time physical activity, household work, estimated sleeping hours, self care and passive time; BMR was calculated from age, weight and height as recommended by the WHO(17). Non-adequate energy reporters were defined as those with a ratio of reported energy intake to BMR outside the 95 % confidence limits of the calculated physical activity level(18).
Ion mobility measurement of lipoprotein subfractions
An ion mobility method was used to directly quantify the full spectrum of lipoprotein subfraction particles, from the small, dense HDL particles to the large, buoyant VLDL particles, in archived baseline plasma samples. This method uses an ion separation/particle detector system that separates ions by size and which can count lipoprotein particles over a wide range of sizes. A full description of this technique has been published elsewhere(19,20). For the present analyses, HDL particles were divided into small (7·7 – 10·5 nm) and large (10·6 – 14·5 nm) subfractions. LDL particles were divided into very small (18·0 – 20·8 nm), small (20·9 – 21·4 nm), medium (21·5 – 22·0 nm) and large (22·1 – 23·3 nm) subfractions. Intermediate-density lipoprotein particles were divided into small (23·4 – 25·0 nm) and large (25·1 – 29·6 nm) subfractions.
British
Journal
of
VLDL particles were divided into small (29·7 – 33·5 nm), medium (33·6 – 42·4 nm) and large (42·5 – 52·0 nm) subfrac-tions. Particle diameter of the major LDL peak was also determined.
Statistical analyses
All statistical analyses were performed using the Statistics Package for Social Sciences (version 16.0; SPSS, Chicago, IL, USA). Dietary factors and lipoprotein subfractions were trans-formed logarithmically to normalise the distributions. Partial correlations between dietary factors, conventional lipid measures (LDL-C, HDL-C and TAG) and lipoprotein subfrac-tions were computed. Sex-specific analyses were performed due to known large differences in subfraction levels between men and women(21). In the multivariate model, we adjusted for age, total energy intake, smoking (yes/no), leisure-time physical activity (sex-specific quartiles) and BMI. Correlations with P, 0·01 were considered significant.
We used principal component analysis to capture indepen-dent clusters of lipoprotein subfractions; the calculation has been described in detail earlier(4). The principal component vectors were used to calculate values for each individual from the sum of weighted terms for each lipoprotein or lipid, with each term being the product of the vector-derived weighting and the particle concentrations minus subfraction mean, divided by the standard deviation from the subfraction. The principal component (PC) corresponding to the ALP, PC2, was divided into sex-specific quartiles. ANOVA was used to test mean differences in dietary intakes. In the multivariate model, we adjusted for age, sex, total energy intake, smoking habits, leisure-time physical activity and BMI. All analyses were repeated excluding potential misreporters, i.e. individ-uals who were classified as non-adequate energy reporters.
Results
Participant characteristics for males and females are shown in Table 1. Tables 2, 3 and Tables S1 and S2 (supplementary material for this article can be found at http://www.journals. cambridge.org/bjn) show the correlations between each dietary factor and the specific lipoprotein subfractions in men and women after adjusting for age, energy intake, BMI, smoking and leisure-time physical activity.
Concerning LDL, a positive correlation was observed between fat intake and LDL-C in men (Table 2). Total fat, satu-rated and n-3 polyunsatusatu-rated fat intake were significantly positively correlated with large LDL particles, but not with other LDL fractions. Carbohydrate intake was negatively associated with large LDL particle concentrations, but no significant correlations were observed for other LDL fractions, although a tendency of positive correlation was observed between intake of disaccharides and small (r 0·04, P¼ 0·10) and medium LDL particle concentrations (r 0·05, P¼ 0·05). In addition, fibre density was inversely correlated with very small, small and medium LDL particles in men (Table 2). In women, neither LDL-C nor any of the LDL subfractions were significantly correlated with fat or carbohydrate intakes.
However, we observed a positive association between LDL particle peak diameter and fat intake (especially SFA and MUFA) and an inverse association with disaccharide intake (Table 3).
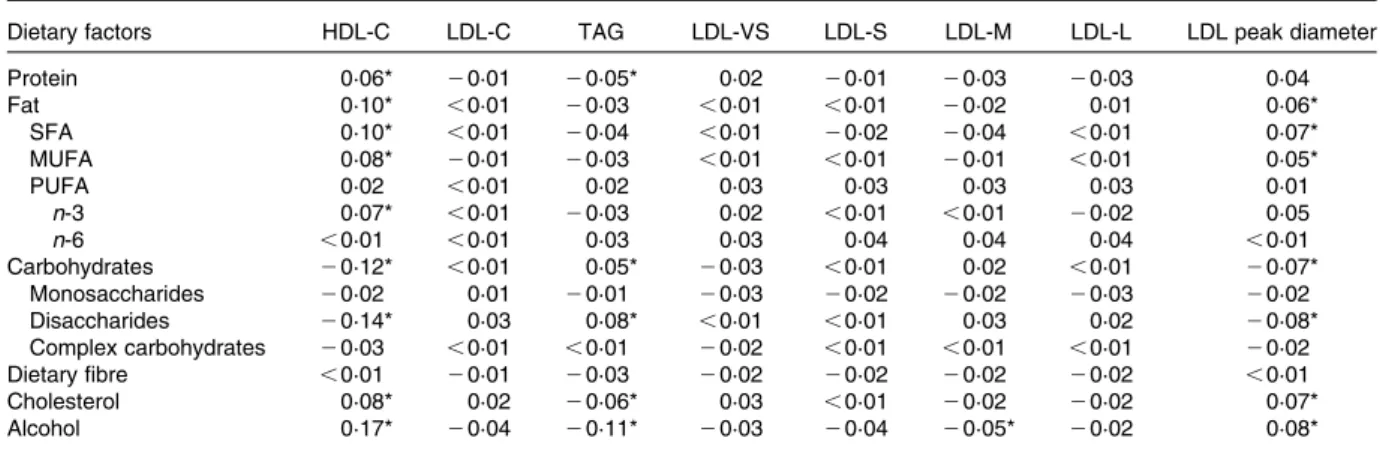
For HDL, we observed similar results for men and women. Fat intake (particularly SFA, MUFA and n-3 PUFA) was posi-tively correlated with HDL-C, while disaccharide intake was negatively correlated with HDL-C. The other carbohydrates (monosaccharides and complex carbohydrates) showed no significant correlation with HDL-C. While alcohol was posi-tively correlated with both HDL-C, and small and large HDL particles among men, we observed a positive correlation only with HDL-C and large HDL particles among women. The correlation coefficients were almost identical when excluding suspected non-adequate reporters of energy or in models without adjusting for BMI and leisure-time physical activity (data not shown).
By using principal component analysis, we have earlier identified three independent components that explained 76 % of the variance among the subfractions(4). The first component (PC1), with LDL and VLDL subfractions as the strongest contri-butors and marginal association with CVD risk(4), showed no clear association with dietary factors between sexes (see Table S1 of the supplementary material, available online at http://www.journals.cambridge.org/bjn). The third com-ponent (PC3), with HDL as the strongest contributor and significantly associated with decreased CVD risk only among men(4), was associated with a lower intake of disaccharides in both men and women. In addition, PC3 was associated with significantly higher protein and alcohol intake among men (see Table S1 of the supplementary material, available online at http://www.journals.cambridge.org/bjn).
The PC corresponding to the ALP (PC2) in sex-specific quar-tiles is shown in Table 4. This pattern was characterised by higher concentrations of very small, small and medium LDL particles, and TAG, and lower concentration of HDL particles. On average, BMI was higher among those in the highest quar-tile compared with those in the lowest quarquar-tile (26·8 v. 24·6 kg/m2; P for trend, 0·001). PC2 was significantly inver-sely associated with intakes of fat (39·2 v. 38·6 E% for the lowest and highest quartiles, respectively; P for trend¼ 0·01), protein (16·0 v. 15·5 E%; P, 0·001), cholesterol (37·8 v. 36·5 mg/1000 kJ; P for trend¼ 0·002) and alcohol (3·9 v. 2·9 E%; P for trend, 0·001), but positively associated with intake of disaccharides (12·1 v. 13·1 E%; P for trend, 0·001). To identify those dietary factors that show independent associ-ation with the ALP, we adjusted for protein, disaccharides or alcohol intake. The association with fat was no longer signifi-cant when adjusted for disaccharide intakes (P¼ 0·93), and the association with cholesterol became attenuated when taking protein (P¼ 0·08) or disaccharide intake (P¼ 0·07) into account. The associations between PC2 and protein, disac-charide, and alcohol intake remained significant even after these adjustments. Associations were similar for men and women with significant differences across quartiles of the ALP pattern for protein, disaccharides and alcohol observed for both sexes.
British
Journal
of
Discussion
In the present large Swedish cohort study, subjects with a lipo-protein pattern corresponding to the ALP had higher intakes of disaccharides and lower intakes of protein and alcohol. Moreover, the present results show that in men, fat intake was positively correlated with large LDL particles, but not with other LDL fractions, and that a high fat intake was associ-ated with an on average greater LDL particle size in women.
Overall, we observed low correlations between dietary variables and lipoprotein subfractions (r , 0·19). The stron-gest correlation was observed for alcohol intake and HDL-C. This is in line with established dose-dependent effects of alcohol on HDL-C that have consistently been observed in both experimental and observational studies(22). Both lipoprotein subfraction concentrations and the self-reported dietary intakes are prone to measurement errors. The ion mobility method for measuring lipoprotein subfraction concentrations
is unique in its capability of directly determining concen-trations of the full spectrum of lipoprotein particles, from small HDL to large VLDL, as a function of their particle size(19,23); however, lipoprotein concentrations were based on a single blood sample. The correlation between self-reported dietary intakes and blood measurements seems to depend on the type of dietary assessment method used and its quality(24). Bingham et al.(24) compared dietary intakes from different diet methods with biomarkers, including LDL-C and HDL-C, and observed a lower correlation with the FFQ than with food records. However, timing of blood samples and diet assessment is critical if the biomarker is sensitive to recent intake(25). In the MDC study, median time between diet assessment and the collection of fasting blood samples was 0·7 years (with a maximum of 2·9 years). Although diet history methods are proposed to reflect usual diet, we would expect the correlations to be higher if the time of diet assessment and blood samples were nearer in
Table 1. Participant characteristics of men and women in the Malmo¨ Diet and Cancer-cardiovascular subcohort (Mean values and standard deviations)
Men Women n Mean SD n Mean SD Age (years) 1678 57·4 6·0 2623 57·4 5·9 BMI (kg/m2) 1676 26·0 3·4 2622 25·3 4·2 LDL-C (mmol/l) 1614 4·13 0·90 2564 4·18 1·03 HDL-C (mmol/l) 1646 1·22 0·30 2588 1·51 0·37 TAG (mmol/l) 1662 1·49 0·91 2609 1·23 0·65 Subfractions (nmol/l) VLDL 1678 96·8 35·2 2623 100 39 IDL-L 1678 180 93 2623 241 112 IDL-S 1678 117 42 2623 119 44 LDL-L 1678 448 178 2623 423 164 LDL-M 1678 148 87 2623 104 70 LDL-S 1678 98 77 2623 67 53 LDL-VS 1678 119 63 2623 100 50 HDL-L 1678 1206 871 2623 1936 1113 HDL-S 1678 2793 1693 2623 3061 1694 LDL peak diameter (nm) 1678 218 6 2623 222 5 Energy intake (kJ/d) 1678 11431 2896 2623 8643 2097
Protein intake (E%) 1678 15·4 2·4 2623 15·9 2·6
Fat intake (E%) 1678 39·8 6·2 2623 38·2 6·1
SFA 1678 16·8 3·9 2623 16·4 3·9
MUFA 1678 14·0 2·3 2623 13·2 2·2
PUFA 1678 6·51 1·65 2623 6·08 1·52
n-3 1678 1·02 0·29 2623 0·99 0·30
n-6 1678 5·31 1·50 2623 4·92 1·36
Carbohydrate intake (E%) 1678 44·8 6·2 2623 45·9 6·0
Monosaccharides 1678 6·59 2·50 2623 8·26 2·91
Disaccharides 1678 12·2 3·9 2623 13·3 3·7
Complex carbohydrates 1678 26·1 4·9 2623 24·3 4·2
Dietary fibre (g/1000 kJ) 1678 2·03 0·6 2623 2·37 0·7
Cholesterol intake (mg/1000 kJ) 1678 36·3 10·2 2623 38·1 11·0
Alcohol intake (E%) 1678 4·03 3·97 2623 2·43 2·70
Smoking status (%) 1678 2621 Non-smokers 31 47 Ex-smokers 41 27 Current smokers 28 26 Energy reporting (%) 1678 2623 Under 12 18 Adequate 84 79 Over 4 3
LDL-C, LDL-cholesterol; HDL-C, HDL-cholesterol; IDL-L, large intermediate-density lipoprotein; IDL-S, small intermediate-density lipo-protein; LDL-L, large LDL; LDL-M, medium LDL; LDL-S, small LDL; LDL-VS, very small LDL; HDL-L, large HDL; HDL-S, small HDL; E%, percentage of energy.
British
Journal
of
time. The concentrations of lipoproteins clearly differ between sexes, as well as the dietary intake levels, but the relative validity and reproducibility of diet data was generally higher for women compared with men(15,26).
By using a principal component analysis, a data-driven unsupervised statistical procedure designed to capture inde-pendent clusters of lipoprotein subfractions, we have earlier demonstrated in the present cohort that one of the com-ponents (PC2) closely matching the ALP was associated with a 22 (95 % CI 8, 36) % increased risk for CVD per standard deviation(4). Although the diet method did not permit determi-nation of the usage of sweeteners in cakes, candies and some beverages, or the varying amounts of sugars in jam, marmalade and desserts, compared with the other examined macronutrients, we found a relatively strong association between disaccharide intake and the atherogenic lipoprotein profile (12·1 and 13·1 E% in the lowest v. highest quartile of
the ALP; P for trend, 0·001). Sucrose, composed of half fructose and half glucose, is the main disaccharide in the Swedish diet(27), and probably the main source of fructose in Sweden. Fructose has been shown to have an adverse effect on the lipoprotein profile(28). For example, an experi-mental study by Stanhope et al.(28)that compared diets with 25 % of energy from fructose or glucose during 8 weeks demonstrated that only fructose increased small LDL particle concentrations. We also observed a significant inverse associ-ation between protein intakes and the ALP. This is in line with the results from several weight-loss intervention trials where high-protein diets compared with low-protein diets generated better lipoprotein patterns despite similar weight loss(29,30).
Previous analyses in the MDC cohort showed highly signifi-cant associations between small/medium LDL particles and CVD, whereas large LDL particles showed no relationship with CVD risk(4). These findings are consistent with the results
Table 3. Partial correlations† between dietary factors‡, conventional lipid measures and lipoprotein subfractions among women in the Malmo¨ Diet and Cancer-cardiovascular subcohort
Dietary factors HDL-C LDL-C TAG LDL-VS LDL-S LDL-M LDL-L LDL peak diameter
Protein 0·06* 20·01 20·05* 0·02 20·01 20·03 20·03 0·04 Fat 0·10* ,0·01 20·03 ,0·01 ,0·01 20·02 0·01 0·06* SFA 0·10* ,0·01 20·04 ,0·01 20·02 20·04 ,0·01 0·07* MUFA 0·08* 20·01 20·03 ,0·01 ,0·01 20·01 ,0·01 0·05* PUFA 0·02 ,0·01 0·02 0·03 0·03 0·03 0·03 0·01 n-3 0·07* ,0·01 20·03 0·02 ,0·01 ,0·01 20·02 0·05 n-6 ,0·01 ,0·01 0·03 0·03 0·04 0·04 0·04 ,0·01 Carbohydrates 20·12* ,0·01 0·05* 20·03 ,0·01 0·02 ,0·01 20·07* Monosaccharides 20·02 0·01 20·01 20·03 20·02 20·02 20·03 20·02 Disaccharides 20·14* 0·03 0·08* ,0·01 ,0·01 0·03 0·02 20·08* Complex carbohydrates 20·03 ,0·01 ,0·01 20·02 ,0·01 ,0·01 ,0·01 20·02 Dietary fibre ,0·01 20·01 20·03 20·02 20·02 20·02 20·02 ,0·01 Cholesterol 0·08* 0·02 20·06* 0·03 ,0·01 20·02 20·02 0·07* Alcohol 0·17* 20·04 20·11* 20·03 20·04 20·05* 20·02 0·08*
HDL-C, HDL-cholesterol; LDL-C, LDL-cholesterol; LDL-VS, very small LDL; LDL-S, small LDL; LDL-M, medium LDL; LDL-L, large LDL. * P , 0·01.
† Adjusted for age, energy, BMI, smoking (yes/no) and leisure-time physical activity (sex-specific quartiles).
‡ Dietary variables are expressed as percentage of energy from non-alcohol and non-fibre energy intake (protein, fat and carbohydrate), g/1000 kJ (fibre), mg/1000 kJ (cholesterol) or percentage of energy from total energy intake (alcohol).
Table 2. Partial correlations† between dietary factors‡, conventional lipid measures and lipoprotein subfractions among men in the Malmo¨ Diet and Cancer-cardiovascular subcohort
Dietary factors HDL-C LDL-C TAG LDL-VS LDL-S LDL-M LDL-L LDL peak diameter
Protein 0·12* ,0·01 ,0·01 0·02 20·01 ,0·01 ,0·01 0·02 Fat 0·11* 0·10* 20·02 0·02 ,0·01 ,0·01 0·08* 0·06 SFA 0·06 0·08* 20·02 ,0·01 0·01 0·02 0·09* 0·05 MUFA 0·11* 0·10* 20·01 0·02 ,0·01 ,0·01 0·06 0·06 PUFA 0·08* 0·05 20·02 0·03 20·02 20·03 ,0·01 0·03 n-3 0·11* 0·10* 20·04 0·03 20·02 20·02 0·07* 0·08* n-6 0·05 0·04 20·01 0·03 20·02 20·03 20·02 0·02 Carbohydrates 20·15* 20·09* ,0·01 20·04 ,0·01 20·01 20·08* 20·06 Monosaccharides 20·06 20·06 20·02 20·06 20·02 20·02 20·05 20·01 Disaccharides 20·17* 20·04 0·05 20·02 0·04 0·05 ,0·01 20·07* Complex carbohydrates 20·02 20·07* 20·04 20·02 20·04 20·06 20·08* ,0·01 Dietary fibre 20·05 20·04 20·06 20·07* 20·07* 20·07* 20·04 0·03 Cholesterol 0·10* 0·04 20·01 ,0·01 20·02 20·02 0·02 0·05 Alcohol 0·19* 0·06 0·02 0·05 0·03 0·04 0·01 ,0·01
HDL-C, HDL-cholesterol; LDL-C, LDL-cholesterol; LDL-VS, very small LDL; LDL-S, small LDL; LDL-M, medium LDL; LDL-L, large LDL. * P , 0·01.
† Adjusted for age, energy, BMI, smoking (yes/no) and leisure-time physical activity (sex-specific quartiles).
‡ Dietary variables are expressed as percentage of energy from non-alcohol and non-fibre energy intake (protein, fat and carbohydrate), g/1000 kJ (fibre), mg/1000 kJ (cholesterol) or percentage of energy from total energy intake (alcohol).
British
Journal
of
of other large prospective cohort studies(31 – 36). The convin-cing evidence that increased saturated fat consumption raises LDL-C levels(37)has contributed to the conclusion that diets high in saturated fat are atherogenic. However, direct evidence for the contribution of saturated fat per se to CVD risk is inconclusive(38). The present findings indicating that dietary saturated fat selectively increases the levels of large, more cholesterol-enriched LDL particles are in line with earlier observations(9). For example, in the context of a carbohydrate-reduced diet (26 % of the energy from carbohydrates), the increased level of LDL-C induced by higher v. lower dairy fat intake was primarily due to an increase in large, buoyant LDL particles with no increase in small, dense LDL particles(39). However, it has to be kept in mind that the impacts of different fat types are difficult to separate as they are found in the same foods. For example, intakes of saturated and mono-unsaturated fats are highly correlated in the MDC cohort.
Trans-fatty acids, i.e. unsaturated fatty acids with at least one double bond in the trans configuration, are known to increase LDL-C concentrations(40), and one limitation of the present study is that we have no information on intake of trans-fatty acids. The major part of trans-fatty acids are 18 : 1 and thus here included in the group of MUFA. By grouping them together, the putative beneficial effects of MUFA on lipid levels previously observed(7) can be expected to be counteracted by the harmful effect of trans-fatty acids.
We could not confirm the hypothesis that simple carbo-hydrates would be the main determinants of small LDL particle concentrations, although the negative association between disaccharides and LDL peak size indicates a shift to smaller LDL particles with a high intake of disaccharides. Carbo-hydrates, in particular sugars and rapidly metabolised starches, promote both increased hepatic secretion and reduced peripheral clearance of large, TAG-rich lipoproteins that are
Table 4. Characteristics* and dietary composition† (mean or frequency) according to the atherogenic lipoprotein phenotype (ALP) pattern among men and women in the Malmo¨ Diet and Cancer-cardiovascular subcohort
Sex-specific quartiles of the ALP pattern‡
Variables 1 2 3 4 P for trend
Age (years) 57·4 57·1 57·4 57·7 0·20 BMI (kg/m2) 24·6 25·2 25·9 26·8 ,0·001 LDL-C (mmol/l) 4·0 4·1 4·2 4·3 ,0·001 HDL-C (mmol/l) 1·7 1·4 1·3 1·1 ,0·001 TAG (mmol/l) 1·1 1·2 1·4 1·8 ,0·001 HDL-S (nmol/l) 4249 2917 2511 2032 ,0·001 HDL-L (nmol/l) 2762 1656 1163 704 ,0·001 LDL-VS (nmol/l) 105 101 102 130 ,0·001 LDL-S (nmol/l) 63 65 75 127 ,0·001 LDL-M (nmol/l) 98 106 125 175 ,0·001 LDL-L (nmol/l) 437 442 452 412 0·008 IDL-S (nmol/l) 280 232 192 139 ,0·001 IDL-L (nmol/l) 124 118 116 115 ,0·001 VLDL (nmol/l) 103 99 97 95 ,0·001 Smoking status (%) 0·84 Smokers 25 28 27 27 Ex-smokers 32 33 32 33 Non-smokers 43 40 41 40
Leisure-time physical activity (%) 0·008
Quartile 1 23 23 26 29 Quartile 2 23 26 26 24 Quartile 3 26 26 25 23 Quartile 4 28 26 23 23 Protein (E%) 16·0 15·8 15·8 15·5 ,0·001 Fat (E%) 39·2 39·0 38·8 38·6 0·01 SFA 16·7 16·6 16·5 16·4 0·09 MUFA 13·7 13·7 13·6 13·5 0·04 PUFA 6·3 6·3 6·2 6·2 0·10 n-3 1·02 1·00 1·01 1·00 0·02 n-6 5·1 5·1 5·0 5·1 0·23 Carbohydrates (E%) 44·8 45·2 45·4 45·9 ,0·001 Monosaccharides 7·4 7·4 7·4 7·4 0·97 Disaccharides 12·1 12·5 13·0 13·1 ,0·001 Complex carbohydrates 25·2 25·3 25·1 25·3 0·77 Dietary fibre (g/1000 kJ) 2·22 2·20 2·20 2·19 0·17 Cholesterol (mg/1000 kJ) 37·8 38·1 37·8 36·5 0·002 Alcohol (E%) 3·9 3·4 3·2 2·9 ,0·001
LDL-C, LDL-cholesterol; HDL-C, HDL-cholesterol; HDL-S, small HDL; HDL-L, large HDL; LDL-VS, very small LDL; LDL-S, small LDL; LDL-M, medium LDL; LDL-L, large LDL; IDL-S, small intermediate-density lipoprotein; IDL-L, large intermediate-density lipoprotein; E%, percentage of energy.
* Adjusted for age and sex.
† Adjusted for age, sex, total energy intake, smoking habits, leisure-time physical activity (sex-specific quartiles) and BMI. ‡ The ALP pattern was divided into sex-specific quartiles and then combined.
British
Journal
of
thought to generate small, dense LDL particles(41). In the present study, complex carbohydrate intake showed no adverse association with lipoprotein concentrations. In addi-tion, fibre intake was associated with lower levels of small/ medium LDL particles in men, which is interesting as intake of soluble fibre, for example b-glucans, is known to decrease LDL-C levels(42). Small LDL particle concentration was not associated with large differences in dietary intakes in the pre-sent study. This is in contrast to another cross-sectional study comprising seventy-seven sedentary but healthy men where for example PUFA and fibre intakes (estimated using 3-d dietary records) correlated negatively and cholesterol intake positively with small, but not with large, LDL particles(43).
Both genetic and environmental factors are involved in the development of dyslipidaemia. However, studies examining the interaction between diet and specific genetic variants on lipids and lipoprotein subfraction levels are limited, with most of them only focusing on a small number of genes(41,44). Recent genome-wide association studies have identified numerous gene regions contributing to dyslipidaemia and the risk of CVD(45 – 47). The major challenge and opportunity in the future is to utilise such genetic information and their inter-actions with dietary factors to further understand predisposi-tion to atherogenic dyslipidaemia and ultimately to CVD risk. In conclusion, the present study shows that a diet limited in disaccharides and with a moderate alcohol and protein intake is associated with a less atherogenic lipoprotein profile. In order to fully understand the observed associations, exam-ination of food groups and food patterns is needed. The use of a so-called dietary portfolio (i.e. food with plant sterols, soluble fibres, soya protein, and almonds) has been particu-larly successful in lowering cholesterol levels, including small LDL particles(48,49), and points towards a focus on foods instead of nutrients. In addition, it is important to directly examine the influence of these dietary factors on the risk of diseases, such as CVD, because the dietary influ-ence on disease development is more complex than simply affecting blood lipids.
Acknowledgements
The present study was supported by the Lund University Diabetes Center (LUDC), the Swedish Medical Research Council, the Swedish Heart and Lung Foundation, the Region Ska˚ne, the Malmo¨ University Hospital, the Albert Pa˚hlsson Research Foundation and the Crafoord foundation. The authors’ responsibilities were as follows: E. S. conducted the statistical analysis and wrote the manuscript; B. G. assisted with the statistical analyses; all authors contributed to the analytic design, data interpretation, revision of the manuscript and final approval of the manuscript. R. M. K. is co-inventor on a licensed patent for ion mobility analysis of lipoproteins. None of the other authors had any conflict of interest.
References
1. ATP III Final Report PDF (2002) Third Report of the National Cholesterol Education Program (NCEP) Expert Panel on
Detection, Evaluation, and Treatment of High Blood Cholesterol in Adults (Adult Treatment Panel III) final report. Circulation 106, 3143 – 3421.
2. Krauss RM & Burke DJ (1982) Identification of multiple subclasses of plasma low density lipoproteins in normal humans. J Lipid Res 23, 97 – 104.
3. Ip S, Lichtenstein AH, Chung M, et al. (2009) Systematic review: association of low-density lipoprotein subfractions with cardiovascular outcomes. Ann Intern Med 150, 474 – 484.
4. Musunuru K, Orho-Melander M, Caulfield MP, et al. (2009) Ion mobility analysis of lipoprotein subfractions identifies three independent axes of cardiovascular risk. Arterioscler Thromb Vasc Biol 29, 1975 – 1980.
5. Krauss RM (2010) Lipoprotein subfractions and cardio-vascular disease risk. Curr Opin Lipidol 21, 305 – 311. 6. Austin MA, King MC, Vranizan KM, et al. (1990) Atherogenic
lipoprotein phenotype. A proposed genetic marker for coronary heart disease risk. Circulation 82, 495 – 506. 7. Sacks FM & Katan M (2002) Randomized clinical trials
on the effects of dietary fat and carbohydrate on plasma lipoproteins and cardiovascular disease. Am J Med 113, Suppl. 9B, 13S – 24S.
8. Kris-Etherton PM & Yu S (1997) Individual fatty acid effects on plasma lipids and lipoproteins: human studies. Am J Clin Nutr 65, 1628S – 1644S.
9. Dreon DM, Fernstrom HA, Campos H, et al. (1998) Change in dietary saturated fat intake is correlated with change in mass of large low-density-lipoprotein particles in men. Am J Clin Nutr 67, 828 – 836.
10. Campos H, Blijlevens E, McNamara JR, et al. (1992) LDL particle size distribution. Results from the Framingham Offspring Study. Arterioscler Thromb 12, 1410 – 1419. 11. Siri PW & Krauss RM (2005) Influence of dietary
carbo-hydrate and fat on LDL and HDL particle distributions. Curr Atheroscler Rep 7, 455 – 459.
12. Taylor HL, Jacobs DR Jr, Schucker B, et al. (1978) A question-naire for the assessment of leisure time physical activities. J Chronic Dis 31, 741 – 755.
13. Li C, Aronsson CA, Hedblad B, et al. (2009) Ability of physical activity measurements to assess health-related risks. Eur J Clin Nutr 63, 1448 – 1451.
14. Callmer E, Riboli E, Saracci R, et al. (1993) Dietary assess-ment methods evaluated in the Malmo food study. J Intern Med 233, 53 – 57.
15. Riboli E, Elmstahl S, Saracci R, et al. (1997) The Malmo Food Study: validity of two dietary assessment methods for measuring nutrient intake. Int J Epidemiol 26, Suppl. 1, S161 – S173.
16. Mattisson I, Wirfalt E, Aronsson CA, et al. (2005) Misreport-ing of energy: prevalence, characteristics of misreporters and influence on observed risk estimates in the Malmo Diet and Cancer cohort. Br J Nutr 94, 832 – 842.
17. World Health Organization (1985) Energy and Protein Requirements: Report of a Joint FAO/WHO/UNU Expert Consultation. Geneva: WHO.
18. Black AE (2000) Critical evaluation of energy intake using the Goldberg cut-off for energy intake:basal metabolic rate. A practical guide to its calculation, use and limitations. Int J Obes Relat Metab Disord 24, 1119 – 1130.
19. Caulfield MP, Li S, Lee G, et al. (2008) Direct determination of lipoprotein particle sizes and concentrations by ion mobi-lity analysis. Clin Chem 54, 1307 – 1316.
20. Caulfield MP, Li S, Lee G, et al. (2008) Concerns regarding lipoprotein particle measurement by ion mobility analysis. In reply. Clin Chem 54, 2088 – 2089.
British
Journal
of
21. Williams PT, Vranizan KM & Krauss RM (1992) Correlations of plasma lipoproteins with LDL subfractions by particle size in men and women. J Lipid Res 33, 765 – 774.
22. Rimm EB, Williams P, Fosher K, et al. (1999) Moderate alcohol intake and lower risk of coronary heart disease: meta-analysis of effects on lipids and haemostatic factors. BMJ 319, 1523 – 1528.
23. Otvos JD, Rudel LL & McConnell JP (2008) Concerns regarding lipoprotein particle measurement by ion mobility analysis. Clin Chem 54, 2086 – 2087; author reply 2088 – 2089. 24. Bingham S, Luben R, Welch A, et al. (2008) Associations between dietary methods and biomarkers, and between fruits and vegetables and risk of ischaemic heart disease, in the EPIC Norfolk Cohort Study. Int J Epidemiol 37, 978 – 987. 25. Willett WC (2008) Commentary: flawed study designs are not
salvaged by large samples. Int J Epidemiol 37, 987 – 989. 26. Elmstahl S, Gullberg B, Riboli E, et al. (1996) The Malmo
Food Study: the reproducibility of a novel diet history method and an extensive food frequency questionnaire. Eur J Clin Nutr 50, 134 – 142.
27. Becker W & Pearson M (2002) Riksmaten 1997 – 98: kostva-nor och na¨ringsintag i Sverige: metod-och resultatanalys (Riksmaten 1997 – 98: Diet and Nutrition in Sweden: Methodological and Analytical Results). Uppsala: Livsme-delsverket.
28. Stanhope KL, Schwarz JM, Keim NL, et al. (2009) Consuming fructose-sweetened, not glucose-sweetened, beverages increases visceral adiposity and lipids and decreases insulin sensitivity in overweight/obese humans. J Clin Invest 119, 1322 – 1334.
29. Lasker DA, Evans EM & Layman DK (2008) Moderate carbo-hydrate, moderate protein weight loss diet reduces cardiovascular disease risk compared to high carbohydrate, low protein diet in obese adults: a randomized clinical trial. Nutr Metab (Lond) 5, 30.
30. Farnsworth E, Luscombe ND, Noakes M, et al. (2003) Effect of a high-protein, energy-restricted diet on body composition, glycemic control, and lipid concentrations in overweight and obese hyperinsulinemic men and women. Am J Clin Nutr 78, 31 – 39.
31. Rosenson RS, Otvos JD & Freedman DS (2002) Relations of lipoprotein subclass levels and low-density lipoprotein size to progression of coronary artery disease in the Pravastatin Limitation of Atherosclerosis in the Coronary Arteries (PLAC-I) trial. Am J Cardiol 90, 89 – 94.
32. St-Pierre AC, Cantin B, Dagenais GR, et al. (2005) Low-density lipoprotein subfractions and the long-term risk of ischemic heart disease in men: 13-year follow-up data from the Quebec Cardiovascular Study. Arterioscler Thromb Vasc Biol 25, 553 – 559.
33. Mora S, Szklo M, Otvos JD, et al. (2007) LDL particle subclasses, LDL particle size, and carotid atherosclerosis in the Multi-Ethnic Study of Atherosclerosis (MESA). Athero-sclerosis 192, 211 – 217.
34. Arsenault BJ, Lemieux I, Despres JP, et al. (2007) Cholesterol levels in small LDL particles predict the risk of coronary heart
disease in the EPIC-Norfolk prospective population study. Eur Heart J 28, 2770 – 2777.
35. Blake GJ, Otvos JD, Rifai N, et al. (2002) Low-density lipo-protein particle concentration and size as determined by nuclear magnetic resonance spectroscopy as predictors of cardiovascular disease in women. Circulation 106, 1930 – 1937.
36. Kuller L, Arnold A, Tracy R, et al. (2002) Nuclear magnetic resonance spectroscopy of lipoproteins and risk of coronary heart disease in the cardiovascular health study. Arterioscler Thromb Vasc Biol 22, 1175 – 1180.
37. Mensink RP & Katan MB (1992) Effect of dietary fatty acids on serum lipids and lipoproteins. A meta-analysis of 27 trials. Arterioscler Thromb 12, 911 – 919.
38. Siri-Tarino PW, Sun Q, Hu FB, et al. (2010) Meta-analysis of prospective cohort studies evaluating the association of saturated fat with cardiovascular disease. Am J Clin Nutr 91, 535 – 546.
39. Krauss RM, Blanche PJ, Rawlings RS, et al. (2006) Separate effects of reduced carbohydrate intake and weight loss on atherogenic dyslipidemia. Am J Clin Nutr 83, 1025 – 1031; quiz 1205.
40. Mozaffarian D, Aro A & Willett WC (2009) Health effects of trans-fatty acids: experimental and observational evidence. Eur J Clin Nutr 63, Suppl. 2, S5 – S21.
41. Krauss RM (2005) Dietary and genetic probes of atherogenic dyslipidemia. Arterioscler Thromb Vasc Biol 25, 2265 – 2272. 42. Brown L, Rosner B, Willett WW, et al. (1999) Cholesterol-lowering effects of dietary fiber: a meta-analysis. Am J Clin Nutr 69, 30 – 42.
43. Williams PT, Krauss RM, Kindel-Joyce S, et al. (1986) Relationship of dietary fat, protein, cholesterol, and fiber intake to atherogenic lipoproteins in men. Am J Clin Nutr 44, 788 – 797.
44. Wu K, Bowman R, Welch AA, et al. (2007) Apolipoprotein E polymorphisms, dietary fat and fibre, and serum lipids: the EPIC Norfolk study. Eur Heart J 28, 2930 – 2936.
45. Kathiresan S, Willer CJ, Peloso GM, et al. (2009) Common variants at 30 loci contribute to polygenic dyslipidemia. Nat Genet 41, 56 – 65.
46. Saxena R, Voight BF, Lyssenko V, et al. (2007) Genome-wide association analysis identifies loci for type 2 diabetes and triglyceride levels. Science 316, 1331 – 1336.
47. Kathiresan S, Melander O, Guiducci C, et al. (2008) Six new loci associated with blood low-density lipoprotein choles-terol, high-density lipoprotein cholesterol or triglycerides in humans. Nat Genet 40, 189 – 197.
48. Jenkins DJ, Kendall CW, Faulkner DA, et al. (2006) Assess-ment of the longer-term effects of a dietary portfolio of cholesterol-lowering foods in hypercholesterolemia. Am J Clin Nutr 83, 582 – 591.
49. Lamarche B, Desroches S, Jenkins DJ, et al. (2004) Combined effects of a dietary portfolio of plant sterols, vegetable protein, viscous fibre and almonds on LDL particle size. Br J Nutr 92, 657 – 663.