IN
DEGREE PROJECT MEDICAL ENGINEERING, SECOND CYCLE, 30 CREDITS
,
STOCKHOLM SWEDEN 2020
Investigation of the effects of
Cannabidiol on sleep-like states
and memory-associated brain
events
TUGDUAL ADAM
KTH ROYAL INSTITUTE OF TECHNOLOGY
SCHOOL OF ENGINEERING SCIENCES IN CHEMISTRY, BIOTECHNOLOGY AND HEALTH
Investigation of the effects of
Cannabidiol on sleep-like
states and
memory-associated brain
events
TUGDUAL ADAM
Master in Medical Engineering Date: September 24, 2020 Supervisor: Lisa Genzel Examiner: Arvind Kumar
School of Engineering Sciences in Chemistry, Biotechnology and Health
Host company: Genzel Lab
Swedish title: Undersökning av effekten av Cannabidiol på sömnliknande tillstånd och minnesassocierade hjärnhändelser
iii
Abstract
A growing interest for Cannabidiol (CBD), a component of Cannabis Sativa, has occurred over the past years. The medical potential of the component is yet to be better characterized, as its effects on sleep, and in particular memory, are to date not well understood or consistently characterized. This master the-sis project focuses on analysing the effect of CBD on an anaesthesia-induced sleep-like state in rats, and its effects on the hippocampal sharp-wave-ripples, which have been shown to be associated with memory replay during sleep, and hence system consolidation. The hippocampus and prefrontal cortex, the two structures involved in memory consolidation, were recorded in 19 rats, split in two groups (CBD and vehicle). From these recordings, an automated sleep scorer using principal component analysis was developed to obtain the ani-mals’ hypnograms, which were analysed to study sleep-like structure. From the recordings of the hippocampal pyramidal layer, and an additionnal layer deeper under it, respectively ripples and sharp waves were detected in all an-imals, and characterized for each group. We observed and demonstrated that CBD changes the sleep-like structure by shortening both REM and NREM bouts, resulting in an increase in transitions between both states. Addition-ally, we observed that, although ripples are not significantly different between both groups, sharp waves tend to be smaller among CBD animals. Lastly we noticed that both sharp wave and ripple activity, after increasing upon transi-tion to NREM, decreases as the bout last. This finding suggests that vehicle animals, who have longer bouts and less transitions, would display less sharp wave and ripple activity, although we found no significant difference in the amount of both brain events. This paradox suggests that there is still more to characterize in order to understand if CBD enhances or not memory consol-idation. In sum, CBD changes anaesthesia-induced sleep by shortening the duration of both NREM and REM bouts, resulting in an increase in transitions between both state. As for sleep events, sharp waves appeared shorter among CBD animals, although the same difference was not observed for ripples. Fi-nally, sharp wave and ripple activity appear to peak upon transition from REM to NREM sleep, and decreases as the NREM bout lasts longer, however, no ef-fect of CBD on this observation was highlighted.
Sammanfattning
Under de senaste åren har det förekommit ett växande för intresse för Canna-bidiol (CBD), en del av textit Cannabis Sativa. Ämnets medicinska potential är ännu inte väl kartlagt, då dess effekter på sömn, och minne i synnerhet, hittills inte är väl förstått eller konsekvent karaktäriserade. Det här examens-arbetet fokuserar på att analysera effekten av CBD på ett anestesi-inducerad sömnliknande tillstånd hos råttor, och dess effekter på det hippocampala skarp-vågkrusningkomplex, som har visat sig vara förknippade med minnesuppspel-ning under sömn, och därmed systemkonsolidering. De två strukturerna invol-verade i minneskonsolidering, hippocampus och prefrontalcortex, registrera-des i 19 råttor, uppdelade i två grupper (CBD och kontroll). Från registrera-dessa re-gistreringar utvecklades ett automatiserat sömnbetyg med hjälp av principal-komponentanalys för att erhålla djurens hypnogram, som analyserades för att studera sömnliknande uppbyggnad. Från registreringarna av det hippocampala pyramidala lagret, och ett ytterligare lager djupare under det, upptäcktes krus-ningar och skarpa vågor hos alla djur och kännetecknades för varje grupp. Vi observerade och demonstrerade att CBD förändrar den sömnliknande struktu-ren genom att förkorta både REM- och NREM-anfall, vilket resulterade i ett utbrott i övergångar mellan dem båda tillstånden. Dessutom observerade vi att även om krusningar inte signifikant skiljer sig mellan båda grupperna, tende-rar skarpa vågor att vara mindre bland CBD-djur. Slutligen märkte vi att både skarp våg- och krusningsaktivitet, efter utbrott vid övergången till NREM, av-tar under anfallets gång. Denna upptäckt tyder på att kontrolldjur, som slår längre och har färre övergångar, skulle uppvisa mindre skarp våg- och krus-ningsaktivitet, även om vi inte hittade någon signifikant skillnad i mängden av båda hjärnhändelserna. Denna paradox antyder på att det fortfarande finns mer att karaktärisera för att förstå om CBD förbättrar minneskonsolidering el-ler inte. Sammanfattningsvis förändrar CBD anestesi-inducerad sömn genom att förkorta varaktigheten av både NREM- och REM-anfall, vilket resulterar i ett utbrott i övergångar mellan båda tillstånden. När det kommer till sömn-aktiviteter förefaller det att skarpa vågor är kortare bland CBD-djur, även om samma skillnad inte observerades för krusningar. Slutligen verkar skarp våg-och krusningsaktivitet toppas vid övergången från REM till NREM-sömn, våg-och avta när NREM-anfallet varar längre, däremot framhävs ingen effekt av CBD i denna observation.
Preface
The following document constitutes my master research project as the conclu-sion of my Master in Medical Engineering at the Royal Institute of Technology (KTH), Stockholm, Sweden.
The project was conducted at the Genzel Lab, Radboud University, Nijmegen, Netherlands, from the 2nd of february 2020 to the 30th of June 2020, and was supervised by Lisa Genzel, PI of the laboratory, as well as Adrian Aleman, junior researcher.
I chose, during my studies, to specialize in various fields, among which was neuroscience. With the precious help of Arvind Kumar, responsible for the course DD2401 Neuroscience, I contacted Lisa and found a project about the neuroscience of sleep, for which I have always felt a strong interest.
The following report presents my research project at the Genzel Lab, the meth-ods I developed for tackling the main issues, the results I obtained as well as a critical discussion regarding the latter.
Tugdual Adam
ing this project possible, and for being patient and of precious help, especially when it came to providing neuroscientific background to the data and results, as I arrived with only little knowledge about the specifics of sleep and memory neuroscience.
I would then like to thank Arvind Kumar, professor at KTH, and also my own reviewer, who made all of this possible by giving me the contact of Lisa Gen-zel. I moreover learned a lot about neuroscience thank to him during the course at KTH DD2401 Neuroscience. He gave me the basics to start this master the-sis.
I would also like to thank Adrian Aleman, junior researcher at Genzel Lab, who introduced me to the laboratory when I arrived, and was of precious help for the statistical aspect of the project, and Anumita Samanta, in charge of the project I am working on, for her enthusiasm and great help for the neuroscien-tific background of the project. More generally, I thank all of the researchers and students at the Genzel Lab for sharing their different experiences, back-grounds, for being of help and keeping each other distracted via our Slack platform during this covid-19 quarantine, which lasted most of my time in the Netherlands. Finally, a big thank to my family for being of moral support dur-ing my time away workdur-ing from my student room as my workplace was closed due to the pandemic.
Contents
1 Introduction 2
1.1 Comprehensive framework . . . 2
1.1.1 Role of sleep in memory consolidation . . . 2
1.1.2 Sleep disorders and cannabis . . . 4
1.2 Project objectives and hypotheses . . . 5
2 Material and methods 7 2.1 Material and experiments . . . 7
2.2 Channel selection . . . 9
2.3 Data preprocessing . . . 10
2.4 Sleep classification . . . 10
2.5 Automatic scoring assessment . . . 12
2.6 Event detection . . . 12
2.6.1 Ripples detection . . . 13
2.6.2 Sharp waves detection . . . 13
2.7 Statistical analysis . . . 13
2.7.1 Processing of the data . . . 13
2.7.2 Two sample Student’s test . . . 13
2.7.3 Repeated measure analysis of variance . . . 14
3 Results 15 3.1 Automated sleep scorer . . . 15
3.1.1 Analysis of the PCA weights . . . 17
3.1.2 Scorer accuracy . . . 17
3.2 Effect of cannabidiol on sleep . . . 19
3.3 The effect of cannabidiol on memory-associated events . . . . 25
3.3.1 Sharp waves and ripples characterization . . . 25
3.3.2 Sleep events in long bouts . . . 30
4 Discussion 32
5 Conclusion 38
Bibliography 39
A Additional figures and tables 44
Glossary and abbreviations
• BW - Brief wake • CBD - Cannabidiol • EEG - Electroencephalogram • EMG - Electromyogram • HPC - Hippocampus • LFP - Local field potential• NREM(S) - Non rapid eye movements (sleep) • OST - Object space task
• PFC - Prefrontal cortex
• PCA - Principal component analysis
• PC1 (or PC2) - First (respectively second) principal component • (R)ANOVA - (Repeated measures) Analysis of variance
• REM(S) - Rapid eye movements (sleep) • SW(s) - Sharp Wave(s)
• SWR(s) - Sharp-wave-ripple(s) • SWS - Slow wave sleep
• THC - Δ-9-tétrahydrocannabinol • VEH - Vehicle
Introduction
1.1
Comprehensive framework
Sleep is a vital function that can be found in most animals on earth. Its func-tions are numerous and it plays a crucial role in cognition, immunity, brain waste clearance, performance and energy conservation [1]. Sleep goes back as far as the appearance of a central nervous system in evolution, and evidence even show that sleep may have existed prior to the emergence of brains [2]. Humans sleep for about a third of their lifespan [3], and every night undergo several sleep cycles, characterized by repetitive patterns of rapid eye movement sleep (REMS) and non-rapid eye movement sleep (NREMS), each associated with their own brain activity patterns [4][5].
Rodents, and especially rats, are commonly used as an animal model in sleep research [6]. Contrary to humans, rats are polyphasic sleepers, meaning that they sleep several times over the course of a day. These episodes, in a study from Simasko and Mukherjee [6], were found to last between roughly 18 min-utes in the dark period and around 120 minmin-utes during the light period (which should not come as a surprise as rats are nocturnal animals). When sleeping, they cycle between states of brief wake (BW), NREM sleep, and REM sleep. However,contrary to humans, where a sleep cycle is usually measured as the time from an REM sleep period to the next one, rats can cycle through NREM sleep and BW without REM sleep (humans can also skip REM, especially amongst older individuals, early in the night).
1.1.1
Role of sleep in memory consolidation
Sleep is intrinsically associated with memory consolidation: during sleep, memory is thought to be reprocessed, and shifts from an ephemeral form, or
"episodic" form, to a long lasting one, or "semantic" form [7]. Two brain
CHAPTER 1. INTRODUCTION 3
tures are involved in this system consolidation, the hippocampus (HPC), as-sociated with short-term memory, and the neocortex, outer layer of the brain, associated with long-term memory [8]. To briefly explain: when learning something new during awake state, neurons in the cortex (sensory neurons as-sociated with the experience) and in the hippocampus (acting as an index to the cortical neurons) are activated. These cells in the hippocampus are nec-essary for retrieval of these new memory, therefore during training, connec-tions among the activated hippocampal cells are strengthened. However, at this point, we believe that synapses in the hippocampus are strong, but corti-cal synapses are weak. Therefore, a system consolidation is necessary, which happens during sleep. Note that this is the classical view of memory consolida-tion and recent studies have shown that episodic memories remain dependent on the hippocampus across time and do not undergo systems consolidation [9]. In NREM sleep, the prefrontal cortex (PFC) cycles between periods of ele-vated activity, UP states, and periods of low activity, DOWN states, resulting in characteristic slow oscillations in the LFP, whose DOWN states are often followed by sleep spindles [7]. A very characteristic brain pattern in the hip-pocampus, called sharp-wave-ripples (SWRs), occur shortly before the spin-dles. Appearance of the SWRs is associated with a burst of activity in the CA3 region of the HPC (caudal part of the hippocampus, see figure 1.1 for a schema of the HPC) that lasts for a few milliseconds [8]. The excitation spreads to the rest of the hippocampus, and causes in the CA1 field (supe-rior part of the hippocampus) a deflection of the local field potential, called sharp wave, and high frequency oscillations called ripples (150-200Hz). A phenomenon called neural replay occur during these SWRs, it consists in the reactivation of hippocampal memory, sending a signal back to neurons in the cortex. During this replay, PFC neurons are allocated in the semantic storage, and cortical synapses strengthen: as a result memory can now be retrieved from the PFC. Therefore, in theory, hippocampal cells are no longer activated, and their synapses weaken. Hence a form of ’transfer’ of information, called memory consolidation, from the hippocampus to the PFC happened.
To date, We only have a grasp of the function of SWRs, but the in-terest in these patterns has constantly grown over the last years. Peyrache et al. [11] showed that hippocampal SWR-activity is also associated with tran-sient activity in many cortical areas, but mainly in PFC, highlighting the high connectivity between the structures and their mutual involvement in memory consolidation. In another study, Valero et al. [12] investigated the single-cell response to SWRs and showed that epileptic rats with distorted SWRs showed
Figure 1.1: Schema of a slice of hippocampus [10]
lower memory performances in memory tasks. Similarly, Buzsáki [13] and Girardeau [14] explain that selective disruption of SWRs is associated with memory interference, but more characterization is still necessary. Beyond SWRs, HPC and cortex are coupled probably in more ways than we know today, cortical replays were for example found in 2002 [15], and evidence of a link with hippocampal replays was later discovered [16]. While early studies show that HPC cortical activity, recent evidence show that cortical states also module hippocampus, showing that it is a two-ways communication. Isomura et al. [17] reported that hippocampus activity was influenced by cortical UP-DOWN transitions, possibly triggering the hippocampal SWRs. More recently in 2016, Maingret et al. [18] proved the causal role of the dialog between both areas in memory consolidation, and in particular the coordination between SWRs, spindles and delta waves.
1.1.2
Sleep disorders and cannabis
As previously said, sleep is a vital function, yet sleep disorders are com-mon, and one of the most widespread health condition: a cross-national study [19] conducted in Europe in 2015 showed that one in four individuals reported having symptoms of sleep disorders over the past 6 months, and when it comes to the USA, 50 to 70 millions citizen have a sleep disorder, and around 30% of american adults report having insomnia with short term issues [20]. Typ-ical medications for sleep disorders are often associated with adverse effects [21], and a growing non-pharmalogical practise against insomnia is the use of cannabis [22], often without full knowledge of its actual effects, and potential negative ones, on sleep. That is why more research on the effects of cannabis and its different components on sleep is necessary.
CHAPTER 1. INTRODUCTION 5
components, the two major ones being Δ-9-tetrahydrocannabinol (THC), and Cannabidiol (CBD). These two phytocannabinoids have the particularity to be able to act on the receptors of the endocannabinoid system, a neuromodula-tory system involved in several functions such as sleep, fertility, memory or appetite. Two specific receptors are involved in this system, CB1 and CB2. While the former is located mainly in the central nervous system, the latter is located majorly in the peripheral nervous system. CBD and THC mainly tar-gets the CB1 receptors, as they are located in the brain, although studies have shown that CBD has a low affinity to these receptors comparatively to THC [23]. While THC has often been the focus of studies related to cannabis in the past [24][25], CBD was often set aside. However, studies showed lately that CBD has a therapeutic potential: some results show that CBD could lead to an increase in total sleep time with a reduced REM sleep time [26], or that it has a sedating effect and would promote sleep maintenance in rats [27]. Con-versely, Nicholson et al. [28] demonstrated that low dosage of CBD could significantly increase awake time in humans, hence highlighting the biphasic, dose-dependent effect of CBD. Other studies show that it acts on the synaptic plasticity in the hippocampus [29] and could thus have an effect of memory, as its consolidation involves hippocampal synapses. Pertwee et al [30] demon-strated that CBD displayed potential for antagonizing CB1 receptors agonist, and recent results showed that the activation of CB1 receptors were associated with a disruption of SWRs patterns [31], suggesting that CBD would promote SWRs, and hence memory consolidation, by preventing their potential disrup-tion.
1.2
Project objectives and hypotheses
The effects of CBD on the structure of sleep and memory consolidation are still not well described, but the neuroscientific community believes that there is potential to be found. This project is an attempt at better characterizing the effects of acute intake of CBD on sleep and memory consolidation. The objectives are as follow:
• Analysing the effect of CBD on sleep stages under urethane anaesthesia, especially on the structure of REM and NREM sleep and their transitions in rats.
• Investigating the effect of CBD on sleep-related brain events under ure-thane anaesthesia, especially the occurrence of SWRs, associated with
memory consolidation.
We will test the prevailing assumption that the intake of CBD decreases the amount of REM sleep in animals (and an REM rebound as the drug washes off from their system), and improves the consolidation of memory by preventing the disruption of SWRs. Note that urethane anaesthesia mimics a sleep-like state, hence referring to the sleep stages under anaesthesia as REM-like and NREM-like would be more accurate, but for simplification purposes, we will refer to these stages as REM and NREM.
Chapter 2
Material and methods
2.1
Material and experiments
We used in this project data from 30 Lister hooded rats. They were first trained and studied in a behavior experiment, which is the object of a sepa-rate project which I did not work on. About an hour before surgery, animals were blindly fed with either CBD (120mg/kg in 300 μL flavoured oil) or a control food(300 μL flavoured oil). After roughly 30 minutes, they were given a fast-acting inhalation anaesthetic gas, isoflurane, and were intraperitoneally injected with urethane upon effect of isoflurane (1.4g/kg in a 0.28g/ml concen-tration saline. Rats were about 600g at the time of the surgery). Urethane is known to induce a sleep-like state, unlike most anaesthetic drugs [32]. While urethane became effective, the rats were applied an anaesthetic cream (Lido-caïne) in the ears, as they are head-fixed at the basis of the ears during the surgery, and on the scalp where the incisions for surgery are made. They were finally injected with an additional drug (Rymadyl) to reduce the bleeding and pain from the skin cut. Once the rats showed no reaction to external stimuli, meaning the urethane came into effect, they were placed in a stereotaxic frame in preparation for surgery.
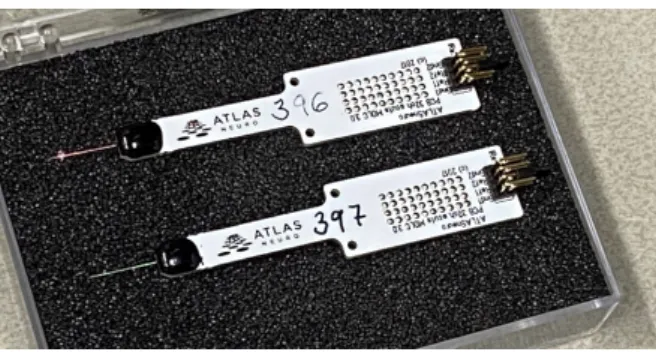
The surgery consisted of removing the scalp skin layers to expose the skull. Then two craniotomies were performed (locations of these were calculated as offset in millimeters from the bregma, intersection of the coronal suture and the sagittal suture of skull, on the medio-lateral -ML, left to right-, anterior-posterior -AP, head to feet- and dorso-ventral -DV, depth from dorsal dural surface- axes). The locations, in our case, were the CA1 of dorsal hippocam-pus and the prefrontal cortex (coordinates are 3.5 AP, 0.5 ML, 3.5 DV for PFC, 3.2 AP, 2 ML, 1.8 DV for HPC). Once the holes were drilled, silicone probes (32 channels, linear, 50m spacing thus 1.6mm recording from Atlas neuroengineering) were inserted into place, and coated in dye, before begin lowered to the desired calculated depth. The fluorescent dye enables to check
for correct probe placement later on during histology. The electrodes and the experimental setup can be observed on images 2.1 and 2.2.
From then, the probes were connected to an Open Ephys acquisiton box [33] and the local field potential around the probes were recorded for about 6 hours. CBD is hypothesized to act roughly 5h after intake, as there is evidence in the literature that plasma levels of CBD are highest around 4-5h after oral admin-istration [34]. By recording for 6 hours, we could theoretically observe the build up phase of the drug, the effect peak, and part of the flush out phase. Heat pads were in addition placed under the animals and replaced roughly ev-ery 1h30 to keep them warm.
Figure 2.1: Electrodes, by Atlas neuroengineering. Only the metal tip is in-serted into the brain.
The experiments were separated in two batches, the first one was con-ducted in april/may 2019 and included 16 animals (of which 4 animals were operated later in july 2019), and the second one, including 14 animals, was conducted in april 2020. Note that the experiments were done at the rate of an animal a day, and surgeries were performed by expert experimentalists (Lisa Genzel and Anumita Samanta).
Each probe includes 32 channels along its length, enabling to record differ-ent differdiffer-ent local field potdiffer-entials (50m between each channel, hence recording on roughly 1.6mm of length). After all recordings 11 animals were excluded of the study (2 animals died, 6 animals were missing a brain recording, the pilot animal was removed, 1 animal had abnormally short recordings and 1 animal showed abnormal reaction to the drug and abnormal brain recordings). In the end, a total of 19 animals were kept for the data analysis (10 CBD, 9 vehicles). A more extensive description of the animals can be found in table A.1 in Appendix A.
CHAPTER 2. MATERIAL AND METHODS 9
Figure 2.2: Experimental setup. The rat is head-fixed in the stereotaxic frame. The skull is exposed, and electrodes lowered into the drilled holes.
2.2
Channel selection
The first step was the channel selection. As previously mentioned, each probe recorded the LFP in 32 locations (or channels) along its length. Not every channel was relevant for the data analysis. Channel selection was espe-cially important for the hippocampus because, being a small structure, differ-ent parts of the hippocampus were recorded simultaneously. The criteria for channel selection were the following.
For the HPC the probe was applied in the CA1 region. The middle layer of this field is called the pyramidal layer, as it is composed of pyramidal cells (excitatory neurons). Ripples in the hippocampus are characterized by a fast oscillation in this layer. Above the pyramidal layer, a positive deflection of the LFP is observed, while a negative deflection is observed below it (See figure 2.3). Recordings were observed and checked for ripples, and a channel in the pyramidal layer was manually selected or each animal.
For the PFC, the differences between the channels were not as substantial as for the hippocampus. A superficial channel showing slow oscillations of large amplitudes was selected.
Figure 2.3: Extracted signal from rat 209, CBD. A ripple can be observed in the pyramidal layer associated with the characteristic positive deflection above the pyramidal layer, and negative deflection below it.
2.3
Data preprocessing
The LFP data was acquired at a frequency of 30kHz, resulting in voluminous files. The data was first low-pass filtered with a zero-phase Butterworth filter of 3rd order to 300Hz and then downsampled by a factor 50. The data was then filtered for artifacts by applying an amplitude detector (outliers above the 99.5th percentile to reduce false positives, as artifacts are usually characterized by high amplitude, but are not so frequent).
2.4
Sleep classification
The first step of the project was to classify the sleep-like structure of the recordings. This process is called sleep scoring and is usually done manu-ally, which is highly time-consuming. In rats, sleep is usually divided in REM sleep, NREM sleep and brief wake periods. Occasionally, intermediate sleep is added when the time window characterized show features of both REMS and NREMS. In our case, rats were anaesthetized, reducing the stages to REMS and NREMS (as there can be no wakeful state).
In order to avoid the long process of manual scoring, an automatic scorer was set up. For each brain area, the spectral power of the signal was esti-mated with a multitaper filter with a time-bandwidth product of 4 in epochs of 10 seconds and for frequencies from 0-300Hz. The sleep scoring was based on Principal Component Analysis (PCA). PCA is a unsupervised dimension reduction method that transforms redundant variables into uncorrelated new
CHAPTER 2. MATERIAL AND METHODS 11
ones. The motivation behind this is that the use of urethane anaesthesia is poorly characterized, and how it affects the structure of sleep is not well known, hence relevant parameters for sleep classification in natural sleep might not be as relevant in a urethane-induced sleep-like state. In addition to this, differ-ent papers in the literature use differdiffer-ent parameters as a basis to discriminate sleep stages between REMS and NREMS ([35], ratio of delta to theta power, and high frequency to low frequency EEG power, [36], heuristic ratio, slow oscillations-delta power over slow oscillations-theta power, and ratio of low frequency to high frequency powers). By using PCA, one can input many pa-rameters and let the algorithm find the ones that explain the most difference within the data, and hence differentiate the sleep stages.
Various parameters were therefore used as input to the PCA: slow oscilla-tions (0.1-1Hz), delta power (1-3Hz), theta power (3-6Hz), low beta power (10-20 Hz), low gamma power (30-45Hz), high gamma (55-80 Hz), ripples (90 - 300 Hz), ratio of theta power to slow oscillations as well as the ampli-tude of every epoch (an epoch being a 10 second signal window). Note that these frequency ranges are lower than the ones usually found in the literature: urethane anaesthesia was shown to slow down brain patterns [37], and a direct observation of the spectrograms confirmed this, hence the frequency ranges were set heuristically.
The PCA returns a matrix of coefficients, or weights, for each of the parame-ters. Each column of the matrix represent a principal component and explains a given fraction of the variability between the datapoints (where each point is associated with the values of the parameters for a 10sec epoch). The two principal components that explained most of the variability were kept, and a k-means algorithm was performed in the PC1-PC2 2D space in order to sepa-rate the data into two or three clusters based on the squared Euclidean distance (REMS, NREMS and intermediate sleep when a third cluster would appear). The selection between either two or three clusters was based on a silhouette analysis [38]. A silhouette analysis computes how far the points from a cluster are from the other clusters, being assigned a value ranging within [-1 1], where 1 means that the point is far away from the other clusters, 0 means that it is onto another cluster, and negative values means that it is probably assigned to the wrong cluster. The mean of silhouettes value for each point was computed in both 2 clusters and 3 clusters scenario, and the situation with highest score was kept.
2.5
Automatic scoring assessment
To assess the accuracy of the automatic scoring, some animals from batch 1 were manually scored on a 1 second basis by an expert (Lisa Genzel), and each of their PCA-scoring was given an overall accuracy score based on the ground truths, as well as a REM and NREM score. If we use the notation from the below confusion matrix (Table 2.1):
Ground truth
REM NREM
PCA-scored REM A B
NREM C D
Table 2.1: Example of a confusion matrix between ground truth and automatic scoring.
The overall score is computed as the fraction of correctly scored states, or: Soverall =
A + D
A + B + C + D; (2.1)
In addition, a REM and a NREM scores were computed to further investigate which state is more poorly characterized.
SREM = A A + B + C (2.2) SN REM = D B + C + D (2.3)
These scores take into account the false positive and the false negative rates, and equal 1 in an ideal case (without false positives and false negatives).
2.6
Event detection
The sleep events we are interested in here, as previously introduced, are the sharp-wave-ripples, as they are associated with memory consolidation. A SWR is the co-occurrence of two patterns: a short and acute deflection of the LFP in the CA3 field of the hippocampus (sharp wave), and a fast oscillation (80-200Hz) in the CA1 field (ripple) that lasts around 200 ms. As these com-plexes are yet not fully comprehended, it is only for now assumed that they
CHAPTER 2. MATERIAL AND METHODS 13
co-occur. We chose to look into these events separately, in order to understand if there could be ripples occurring without sharp waves, or inversely, and the type of information that could be carried by these different events.
2.6.1
Ripples detection
The ripple detection is done using a script previously written by a colleague (Adrian Aleman). A pyramidal layer channel of the hippocampus is bandpass filtered to 90-299Hz, then an amplitude threshold is set to 5 standard deviations of the signal amplitude around the mean value of the signal, and oscillations whose envelope exceeds the threshold for longer than 30 ms are counted as ripples.
2.6.2
Sharp waves detection
The sharp wave (SW) detection is done using a channel below the pyramidal layer, in order to better observe a negative deflection of the LFP, as the deeper you are, the more of a deflection you can observe. The signal is filtered to 1-20 Hz, and patterns of amplitude lower than a threshold of 5 standard deviations below the signal’s average are counted as sharp waves. The local minimum of each SW is retrieved automatically.
2.7
Statistical analysis
2.7.1
Processing of the data
In order to compare both vehicles versus CBD animals, a processing of the data was necessary. As explained earlier, we want to capture the general effect of cannabidiol, without it being influenced too much by the individual variability. First of all, the data was aligned on the feeding time, in order to synchronize the hypothetical effective time of the drug in the CBD animals. The data was then separated in bins of 45 minutes, as a trade-off between individual variability and general effect, and averaged over time. Statistical tests were then performed on the processed data.
2.7.2
Two sample Student’s test
A two sample Student’s t-test tests if the difference between the means of two groups is significant or due to random chance. The null hypothesis is here that
animals from both groups come from the same population, i.e. that there is no difference in mean between both groups for a given parameter (for example the amount of REM sleep). The test assumes that the data is normally distributed, and returns a p-value, probability of observing such or more extreme result given that the null hypothesis is true. A p-value will be considered significant if it is lower than 0.05. Two sample t-tests were performed on time- and animal-averages in each group for every parameters (REM and NREM amounts, bouts counts and durations, transitions, number of ripples and sharp waves, theta and delta powers, ripples and sharp waves features). Data was normalized when the criteria for normal distribution was not met.
2.7.3
Repeated measure analysis of variance
The limitation of the previous Student’s t-test is that it compares means, and hence does not take into account the time. However, the CBD drug has a build up phase to full effect, and a wash off phase, and therefore the time dimen-sion plays a significant role. Hence, another model was needed. A repeated measure model is suitable in studies that investigates changes in a parameter over three or more time points, or under three or more conditions [39]. In the present situations, animals belong to either one or the other group, which is called the between-subjects factor, and measures are repeated as we have several successive 45-minute bins, which are called the within-subject
fac-tors. Therefore, a repeated measure ANOVA is suitable in this case. Such test
is commonly used in analysis of drugs over time as it supposedly analyse the effect of drug while excluding the individual variability at the beginning of the trial.
Chapter 3
Results
In this section will be presented the main results from the study, first re-garding the effects of CBD on sleep-like stages, then the effect of CBD on memory-associated sleep events. These results will be later discussed.
3.1
Automated sleep scorer
A pipeline was developed to automatically score the data using a PCA based algorithm. The pipeline is adaptable depending on the data available, and the idea is that it can be used for various datasets. The script takes as an input a HPC channel and/or a PFC channel. When the rats are not anaesthetized, EMG or accelerometer data is also relevant to detect wakeful states and can be loaded as well. The scorer returns an interactive Matlab image with the following outputs.
Spectrograms
The spectral power for a given frequency range is computed as the area under the multitaper power density curve for this frequency range. The spec-trograms of HPC and/or PFC are shown (depending on the input channels), with the possibility to adjust the window to the desired frequency range (Fig-ure 3.1). Note that, for a given frequency range, here 0-300Hz, there is a trade off between temporal and frequency resolution. The finer the temporal reso-lution, the rougher the frequency resoreso-lution, and vice versa. In order to reach sufficient accuracy in low frequency, as low frequency bands regroup vari-ous different characteristic oscillations very close in frequency, epochs of 10 seconds had to be used.
Figure 3.1: Spectrograms for the HPC and PFC of rat 209, CBD. Spectral power is color coded from blue (low power) to yellow (high power) for fre-quencies ranging from 0 to 300 Hz throughout the signal, in bins of 10 sec-onds.
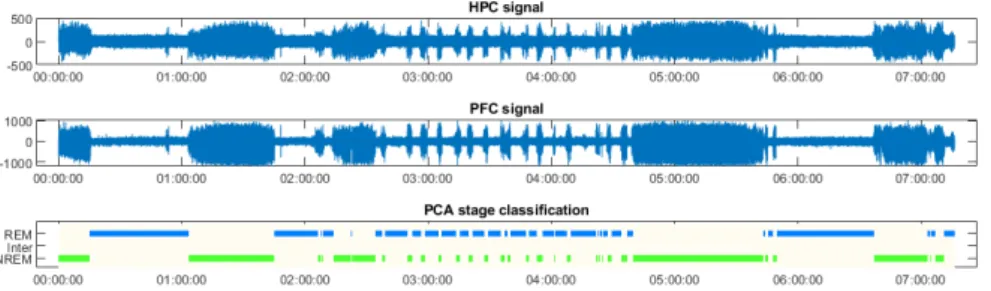
Filtered signals and PCA scored sleep states
The brain signals used in the PCA are shown in the output, as well as the PCA scored sleep states. The sleep states are aligned on the channel signals and the spectrograms to better visualize the correlation between sleep state, signal and spectral power (Figure 3.2).
Clustering output and PCA weights
The result of the clustering in the 2D space composed of the two first com-ponents of the PCA is shown in the ouput. This enables us to visually assess that the number of clusters is correct, and that they are well defined. In ad-dition, the weights of the parameters involved in the two first components of the the PCA are displayed and color coded. This, alongside with the previous cluster plot of the data, allows us to visualize which parameters are mainly involved in the discrimination between the different sleep-like stages (Figure 3.3).
CHAPTER 3. RESULTS 17
Figure 3.2: From top to bottom: HPC signal, PFC signal and PCA-scored sleep stages (the plot showing the different sleep stages and their duration is usually called a hypnogram) for rat 209, CBD. HPC and PFC signals were beforehand filtered for artifacts. The hypnogram is on a 10 seconds basis.
3.1.1
Analysis of the PCA weights
The weights obtained from the PCA are typically assigned a value between 1 and -1. The closer to 1 in absolute value the weight is, the more "important" the parameter when it comes to discriminating between REM sleep and NREM sleep. We looked at the weights in the first component of each animal, as they explained most of the variance (mean variance across all animals explained by the first components was 71.6± 10.6%, so we can confidently assume that weights involved in the first component were the weights involved in most of the discrimination between the sleep stages). Analysis of these weights showed that the dominant parameters for distinguishing sleep stages were the raw (after pre-processing) signal amplitude of each 10 seconds epochs (weights 0.60± 0.09 for the PFC, 0.45±0.07 for the HPC), the slow oscillations power (weights 0.32± 0.09 for the PFC, 0.33 ± 0.05 for the HPC) and the ratio of theta power to slow oscillations power (weights−0.17 ± 0.07 for the PFC, −0.24 ± 0.07 for the HPC).
3.1.2
Scorer accuracy
To assess the accuracy of the scorer, manual scoring was performed on parts of the recordings for 4 rats from batch 1 (rat 5 CBD, rat 9 VEH, rat 10 -CBD, rat 11 - CBD). Each manual scoring was made on a 1 second basis (while the PCA scorer is made on a 10 seconds basis), so the PCA-scored output was expanded ten times to fit the manual scoring in size, and global accuracy, REM accuracy and NREM accuracy were computed for each manually scored ani-mal. Results are found in Table 3.1
Figure 3.3: Output of the PCA scorer for rat 209, CBD. Top: clustered data in the PC1-PC2 space. Bottom: weights of the parameters involved in PC1, PC2. Weights are values between -1 and 1, the closer to 1 in absolute value, the greater the weight of the associated parameter.
Global accuracy REM accuracy NREM accuracy
Rat 5 0.896 0.668 0.868
Rat 9 0.995 0.977 0.994
Rat 10 0.927 0.826 0.889
Rat 11 0.932 0.808 0.906
Table 3.1: Accuracy scores of the PCA scorer for the 4 manually scored rats.
We could see that overall, we have very good accuracy scores, close to the one we usually find in the literature ([35], interestingly, in this study, REM accuracy was also significantly lower; [40], they obtain slightly better
accu-CHAPTER 3. RESULTS 19
racy scores, around 96%). When looking closer to REM and NREM accuracy scores, it appeared that REM sleep has a lower accuracy. Looking at the in-dividual confusion matrices (table A.2), we noticed that the false positive rate of REM is rather high (especially in rat 5), i.e. real NREMS was quite often scored as REMS. Interestingly, the rat showing almost perfect scores, rat 9, was the only vehicle animal of these four, while the CBD ones showed lower scores, but other manually scored vehicles would have been necessary to con-firm the trend.
3.2
Effect of cannabidiol on sleep
As previously introduced, after scoring every rat, the data was aligned on the feeding time (either vehicle or CBD), separated in bins of 45 minutes and averaged over time for each group. Various parameters were observed and the introduced statistical tests were performed.
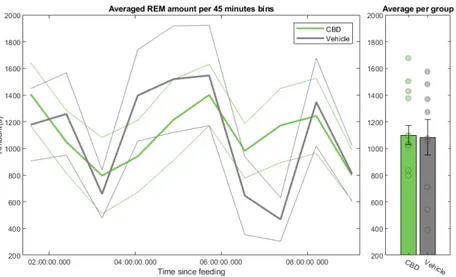
REM and NREM amounts are not significantly affected
A quick look at the proportions of each stage in every animal (Figure A.2 in appendix A) did not show any trend between groups. The results are summa-rized in table 3.2. The very high standard deviations we could observe account for the diversity within groups, and the necessity to therefore average over an-imals in order to reduce this individual variability and reveal the underlying possible effect of cannabidiol.
NREM proportion REM proportion CBD 57.04(18.07) 42.96(18.07) VEH 58.00(18.97) 42.00(18.97)
Table 3.2: Proportion of NREMS and REMS in both groups. Results are presented as mean±std.
Looking at figures 3.4 and 3.5 confirmed the absence of a significant effect of CBD on the amount of REMS and NREMS. When we examined the amount of REM or NREM sleep across time, we noticed that they both os-cillate over time. Interestingly, these oscillations appeared smaller among the CBD animals when the drug came into effect. Both the amounts of REMS and NREMS appeared significant across time in a RANOVA (F(9,153) = 3.232, p-value = 0.0163 for REM, F(9,153) = 8.059, p-p-value = 1.16e-5 for NREM. All
Figure 3.4: Temporal evolution of the amount of REM sleep per group, with Standard Error of the Mean (SEM). Right barplot is the mean value in each group, with individual values per animal displayed as dots to visualize the distribution of individuals.
Figure 3.5: Temporal evolution of the amount of NREM sleep per group, with Standard Error of the Mean (SEM). Right barplot is the mean value in each group, with individual values per animal displayed as dots to visualize the distribution of individuals.
CHAPTER 3. RESULTS 21
statistics can be found in table A.3), suggesting that these oscillations could be related to a "sleep cycle" under anaesthesia. Note that CBD did not signif-icantly affect the temporal evolution of REMS and NREMS in the RANOVA, and the amount of both REMS and NREMS was not significant through a 2-sample t-test or an ANOVA.
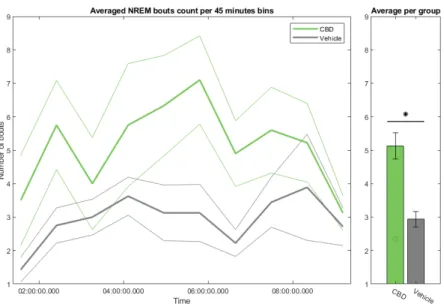
VEH sleep bouts are longer but less numerous compared to CBD ones
Next we examined the REM and NREM bouts, in terms of number and du-ration. First of all, figure 3.6 showed that the CBD animals have more bouts than vehicles ones, and notably more NREM bouts than REM bouts. A sec-ond observation was that these bouts are also shorter (less than 10 minutes), while vehicle animals showed in comparison notably longer bouts. In terms of average, CBD animals had a mean duration of 3min 48sec for NREM bouts and 4min 08sec for REM bouts, while vehicle animals had respectively 6min
11sec for NREM and 6min 39sec for REM bouts.
Figure 3.6: Distributions of the REM (left) and NREM (right) bouts durations for both groups. Only bouts longer than 20 seconds were taken into account. Rat 2 from batch 1 was not taken into account in the distribution, resulting in 9 animals in each group. The dashed line is the mean duration for each group.
(a) Averaged number of NREM bouts in both groups.
(b) Averaged number of REM bouts in both groups
Figure 3.7: Temporal evolution of the number of sleep bouts longer than 20 seconds per group, with SEM. Significance with t-test and ANOVA is repre-sented with a star. Right barplot is the mean value in each group with individ-ual values per animal displayed to visindivid-ualize the individindivid-ual distribution.
CHAPTER 3. RESULTS 23
(a) Average duration of NREM bouts in both groups
(b) Average duration of REM bouts in both groups
Figure 3.8: Temporal evolution of the duration of sleep bouts per group, with SEM. Right barplot is the mean value in each group with individual values per animal displayed to visualize the individual distribution.
When we looked at the number of bouts across time (figure 3.7) and their duration (figure 3.8), the first notable observation was the increase in both sleep-like bouts from 3h30 post feeding to 8h post feeding in the CBD, coinciding with the hypothesised effect window of the CBD (build-up, peak and wash off). Both the number of REM and NREM bouts showed a significant difference between CBD and VEH animals, through the t-test as well as the ANOVA (table A.3 For the number of REM bouts, T(17) = 2.813, p-value = 0.012 for Student’s test, F(1,17) = 6.539, p-value = 0.0204 for the ANOVA. For the number of NREM bouts, T(17) = 3.001, p-value = 0.008 for Student’s test, F(1,17) = 7.796, p-value = 0.0125 for the ANOVA). We could notice an interesting global transient decrease in both bouts for both groups around 6h to 7h30 post feeding. This period was also associated with notably longer NREM bouts (figure 3.8a). The duration of bouts appeared generally longer among vehicle animals, although statistical tests did not yield significance at the 5% threshold. These increases in duration coincides with (and explain) the REM-NREM oscillations we previously observed.
More transitions in between states in rats with CBD
The most prominent effect of cannabidiol, which relates to the previous ob-servation of shorter and more numerous bouts in CBD animals, is the great increase in transitions between REM and NREM stages. Indeed, in figure 3.9, the increase in transitions started around 4h post feeding and ended around 7h30 post feeding. This difference was moreover significant at the 5% thresh-old for the t-test and the ANOVA (table A.3. T(17) = 2.468, p-value = 0.0304 for Student’s test, F(1,17) = 5.923, p-value = 0.0461 for the ANOVA). The sleep-like state appeared more "disturbed" with periods of fast transitions be-tween REM and NREM. Note that these periods of fast transitions can also be witnessed in VEH animals (figure A.1, animals 203, 210, 211), but they are more frequent and last longer in CBD animals. The underlying mechanism explaining this increase in transitions is not yet understood, but could be re-lated to the underlying sleep associated events, or brain patterns, which is the focus of the second part of this project.
CHAPTER 3. RESULTS 25
Figure 3.9: Temporal evolution of the number of transitions per group, with SEM. Right barplot is the mean value in each group with individual values per animal displayed to visualize the individual distribution. Significance with t-test and ANOVA is represented with a star.
3.3
The effect of cannabidiol on memory-associated
events
The neural activity events we are interested in here are the sharp waves and ripples, as they form SWRs complexes, thought to be at the basis of memory consolidation during sleep.
3.3.1
Sharp waves and ripples characterization
We first of all looked at the amount of sharp waves and ripples averaged across time in both groups (figure 3.10). No significant difference could be noticed between VEH and CBD animals, and two peaks could be observed (especially for the sharp waves - for the ripples, the first peak is much smaller) that coincide with the peaks of the NREM "oscillation". This is not a surprise as these activity patterns are mainly observed during NREM sleep, which is known to be the sleep stage during which most memory consolidation happen. This observation does not seem a priori to support the hypothesis that CBD improves memory consolidation throught the promotion of SWRs, and closer look needs to be brought to the individual rats.
(a) Averaged number of ripples in both groups.
(b) Averaged number of sharp waves bouts in both groups
Figure 3.10: Bin-averaged number of sleep events per group, with SEM. Right barplot is the mean value in each group with individual values per animal displayed to visualize the individual distribution.
CHAPTER 3. RESULTS 27
In figure 3.11 we show the number of sharp waves and ripples for rat 209 batch 2 (CBD animal, a vehicle can be observed in Appendix A, figure A.4, to notice that is it not an effect of CBD), the hypnogram is displayed as a background to better visualize the incidence of sleep events during the differ-ent stages. Several observations were made from this: first of all, some evdiffer-ents surprisingly happened during periods scored as REM, this is most probably due to very short NREM-like bouts wrongly scored as REM (note that there is also mention in the literature of SWRs happening on rare occasions during REM [13]). Set aside this point, the most interesting observations were that, when NREM bouts last longer, the amount of sharp waves and ripples seems to gradually diminish across the bout (figure 3.11, one especially "long" NREM bout is highlighted in red, from 4h23 to 5h28 - time since beginning of record-ing). In addition, every transition into NREM is marked by a spiking activity in both ripples and SWs, but a better characterization needs to be done as the spike is not of consistent amplitude.
Figure 3.11: PCA scored sleep stages superimposed with the amount of ripples (top) and sharp waves (bottom) per bins of 30 seconds in rat 209, CBD. A notably long NREM bout is highlighted in red.
signif-(a) Distribution of the normalized ripples’ amplitudes in both groups
(b) Distribution of the ripples’ duration in both groups
(c) Distribution of the ripples’ mean frequency in both groups
Figure 3.12: Histograms of ripples features (amplitude, duration, mean fre-quency) for both groups. Amplitude is computed as the peak to trough dif-ference of the event, normalized by the interquantile gap (5th-95th quantiles) of the REM periods ofthe HPC signal from which the ripples are detected, to prevent bias due to inherent variability in the recorded signals amplitudes.
CHAPTER 3. RESULTS 29
icant difference can be observed regarding their amplitude. As for their du-rations, both distributions are very much alike, although CBD ripples seem slightly shorter (T(21554) = -2.071, p-value = 0.0384 for Student’s test), but a more in depth analysis of this would be necessary to confirm this. The mean frequency of the ripples does not differ significantly between groups, but it is interesting to note the tendency of the parameter to follow a bimodal distri-bution, although this latter speculation was not confirmed through a statistical test.
As for the sharp waves, their amplitude is shown in figure 3.13, and we observed that sharp waves are overall smaller in amplitude amongst the CBD animals (T(18810) = -29.04, p-value = 2.105e-181 for Student’s test). Surprisingly, the same shift was not observed for the amplitude of the ripples, which are supposed to be the consequence of the propagation of sharp waves toward the CA1 field of the hippocampus, suggesting a possible decorrelation between sharp wave and ripple amplitude, or at least the existence of different subtypes of SWRs, which would not be equally affected by CBD.
Figure 3.13: Normalized sharp wave amplitude in both group. The amplitude is computed as the difference between the whole signal’s average, and the local minima of the sharp wave, and is normalized by the interquantile gap (5th-95th quantiles) of the REM portion of the signal used for sharp wave detection (channel below the pyramidal layer), to prevent bias due to inherent variability in the recorded signals amplitudes. REM portions were used since it is a rather steady signal in amplitude, and reflects the overall recording’s amplitude.
3.3.2
Sleep events in long bouts
To better observe in all rats the observations made in rat 209, we decided to observe all the long NREM bouts, i.e. longer than 15 minutes, and compare the mean number of SWs/ripples on a given portion at the start and at the end of the bout. We chose here to take the first and the last 10% of each long bout, and to normalize over the resulting duration the number of SW and ripples. The results are displayed in figure 3.14.
We can undeniably see a trend here: the amount of both sleep events are decreasing toward the end of the bout (T(55) = 6.012, p-value = 1.5401e-07 for Student’s test for ripples, T(55) = 6.489, p-value = 2.5814e-08 for Student’s test for sharp waves). In order to ensure that the difference is not due to one abnormal animal, animal-averaged amount of events at the start/end of long NREM bouts were computed, and significance was kept (figure A.5). There is however no clear effect of CBD on this difference in sleep events amount between start and end of long bouts, if not that CBD animals have less long bouts (56 NREM bouts longer than 15 minutes for vehicle animals, against 28 for CBD animals).
CHAPTER 3. RESULTS 31
(a) Normalized amount of ripples at the start/end of long NREM bouts
(b) [Normalized amount of SW at the start/end of long NREM bouts
Figure 3.14: Each point represent one long NREM bout, color coded if they come from a CBD animal (green) or a vehicle one (grey). Left hand column is the normalized amount of the sleep event across the first 10% of the bout, right hand column if across the last 10%. Pairs of data from the same bout are linked with a dotted line.
Discussion
This project aimed at analysing the effects of cannabidiol on a sleep-like state induced by urethane anaesthesia. Brain recordings from the PFC and HPC of 19 rats were acquired and analysed. Using PCA, we successfully ob-tained the hypnograms of our 19 animals. Analysis of these hypnograms re-vealed no significant effect of CBD on the overall amount of REMS or NREMS, but highlighted a substantial decrease in the duration of both REM bouts, re-sulting in more transitions between states in the CBD group. The study of hippocampal ripples and sharp waves revealed that CBD has no effect on the former but significantly reduces the amplitude of the latter, but didn’t alter the overall amount of either event. Besides, we highlighted that both sharp wave and ripple activity peaks upon transition from NREM to REM, and diminishes as the NREM bout lasts, although this effect is not affected by CBD.
The PCA scorer separated the data in two clusters for all animals but 2. Interestingly, these 2 animals were from the vehicle group, and showed a dis-tinct third cluster. This third cluster was manually assessed as either REM or NREM, and we did not investigate if this additional cluster was an artifact cre-ated by the PCA, or if it reveals a true distinct sleep-like state. Some studies distinguish two NREMS subtypes [41][42], or even add a transitional state be-tween NREM and REM: further investigation could have highlighted that our occasionnal third cluster was one of these. The data was separated in epochs of 10 seconds for the PCA, as it is the window commonly used in manual scoring, and a smaller window caused the slowed down UPs and DOWNs in the PFC to be seen as two different oscillations. The PCA determined that the main discriminating factors between REMS and NREMS are the signal amplitude, the slow oscillation power, and the ratio of theta to slow oscillation powers. In a review by Claude Robert et al. [43], they analysed over 20 papers using auto-mated sleep scoring. Most papers were using EEG and EMG, the latter being used for detecting wake. Most papers scored sleep in epochs of 10 seconds and based the discrimination between REMS and NREMS on a predominant
CHAPTER 4. DISCUSSION 33
theta-activity during REMS (6-12Hz), while NREMS was dominated by high delta activity (0.5-4Hz). In addition to this, 8 of the reviewed papers used EEG amplitude as a discrimination parameter. In our case, because of anaesthesia, no EMG is necessary as there is no wake. Apart from this, our parameters turn out to be similar: REMS is dominated by theta oscillations slowed down by the anaesthesia (3-6Hz), while NREMS shows a prevalence of “slow oscilla-tions” (0.1-1Hz), which could be regarded as anaesthesia-slowed down delta oscillations, and higher amplitudes both in the HPC (due to the presence of sharp waves) and the PFC. Note that this review is quite old, and none of the papers included in it used LFP, but recent studies show that the same parame-ters are still used nowadays (Yaghouby et al.[35], 2016, EEG, Wei et al.[42], 2019, EEG and LFP), and are also used for LFP: Lacroix et al. [44] used LFP from both PFC and HPC, and parameters for discriminating REM from NREM were the same, i.e. theta power during REMS and delta power during NREMS.
We assessed the performance of the scorer using manual scoring from 4 rats. We obtained high scores, comparable with PCA scorer found in the literature [45] [46]. Interestingly, we found REM scores to be lower than the NREM ones, a tendency observed as well in the literature [47][48][45][46]. In our case, REMS tends to be harder to classify, especially in CBD animals, as the fast transitions between REMS and NREMS causes the REM bouts to be noisy, without settlement of regular theta oscillations as can be seen during longer REM bouts.
The subsequent analysis of the hypnograms revealed no major difference in the amount of REMS and NREMS between CBD and VEH animals, while, on av-erage, animals from both groups display roughly as much REMS as NREMS. However, we observed a strong effect of CBD with a significant increase in the number of transitions between REMS and NREMS as well as a reduction in the duration of both REM and NREM bouts. These results are not in accordance with our hypotheses, as we were expecting to observe a deeper sleep, meaning more NREMS and less REMS, as can be found in the literature. Chagas et al. [49] for instance reported that a systemic administration of CBD causes an overall increase in sleep time and slow wave sleep, although they did not report any decrease in REMS, while Murillo-Rodriguez [50] highlighted that an icv (intracerebroventricular) injection of CBD in rats caused a reduction in REMS. There are not many studies investigating the effect of CBD on sleep in rodents or humans, and the conclusions vary as much as the experimental designs (CBD dose, location of the injection, pure CBD or combined with THC. . . ). For example, Linares et al. [51] demonstrated that a systemic high
dose administration of CBD did not significantly alter the ratio of REMS to NREMS, as we observed in our case, but did not report more frequent switches between states. Some studies support that CBD is sleep inducing: Hsiao et al. [52] reported that CBD suppresses anxiety-induced REM reduction, Chagas et al. [49], as previously mentioned, supported that it increases the amount of NREMS, and Carlini et al. [26] demonstrated that CBD in sleep induc-ing in insomnia patients. Converse to this, many studies support that CBD is wake-inducing. Nicholson et al. [28] for example highlighted that a greater amount of CBD in a THC/CBD mix was associated with a higher awake time during sleep in rodents, but didn’t notice any increase in the number of awaken-ings of transitions between states. Murillo-Rodriguez studied in several papers [50][53][54][55] the wake-inducing effects of CBD and exhibited increases in neural activity of wake-inducing brain areas during sleep in rodents under CBD, such as hypothalamus or dorsal raphe nucleus. This alertness inducing effect is supported by the fact that CBD works as a CB1 receptor antagonist [56][29], a receptor which has been shown to be sleep inducing. Antagonism of these receptors suppresses the sleep promoting effects of an acute accumu-lation of endocannabinoids [57]. The diversity of results and experimental de-signs suggest that CBD underlies a complex mechanism, with dose-dependent and location-dependent effects. Yet, no study of our knowledge has investi-gated the effect of CBD in an anaesthesia-induced sleep-like state, and neither did any study highlight a significant increase in transitions between stages, which is the main effect we notice in this project. These observations might suggest that it is a combined effect of CBD and anaesthesia. An hypothesis would be that CBD induces a wake pressure, as suggested by the literature, but since awakening is prohibited by anaesthesia, the animals would rapidly transition from NREM to REM, as REM, from a brain perspective, is closer to wake than NREM, which is why it is sometimes called paradoxical sleep. This would also explain why, in CBD animals, short REM bouts are very noisy, and not as regular as long REM bouts in vehicles, and would further support the reduced performance of the PCA-scorer for classifying REMS, since there would be two “types” of REM bouts, the ones created under urethane anaes-thesia, and the ones driven by the wake pressure. This doesn’t however explain why CBD animals switch back to NREM so quickly.
In a second phase, we studied hippocampal ripples and sharp waves. It is known that the reactivation of hippocampal place cells happen during ripples, making them suited for memory consolidation [58][59][60]. Further evidence states that the number of ripples following learning predicts the memory per-formance [61]. In this project, no significant difference was observed in terms
CHAPTER 4. DISCUSSION 35
of quantity or temporal evolution of either event between CBD and VEH ani-mals. This does not, a priori, support the hypothesis that CBD enhances mem-ory performance through an increase in ripple activity, as no such increase was observed. However, in the present experimental design, the rats did not neces-sarily learn anything new the day prior to the surgeries, which could motivate why there would not be any particular increase in ripple activity to observe in the first place.
We further characterized that hippocampal ripples are similar in both groups in terms of amplitude, mean frequency and duration. Interestingly, we high-lighted a significant decrease in the sharp waves’ amplitude in the CBD group. It was shown that CBD is associated with an increase in levels of anandamide, the main endocannabinoid, and a CB1 receptors agonist: CBD indeed blocks its hydrolysis by the fatty acid amide hydrolase enzyme [49][62], leading to the accumulation of the endocannabinoid. Maier et al. [31] demonstrated in a study that the administration of a CB1 receptor agonist had for primary effect to reduce the amplitude and frequency of SWRs, leading to a form of SWRs disruption. Put together, these observations could explain the CBD-induced reduction in sharp waves’ amplitude that we notice. We also highlighted that this reduction in sharp waves’ amplitude was not associated with a signifi-cant alteration of the ripples’ amplitude: this finding suggests that there could be different subtypes of SWRs that could be differentially affected by CBD. Another interesting observation which could support the hypothesis of sub-types is the apparent bimodal distribution of the ripples’ durations, although, as we said, we did not confirm this through a statistical analysis. Logothetis et al. [63] already investigated this question: they discovered different SWRs subtypes associated with different brain activity, these subtypes were char-acterized mainly by the synchronisation between the sharp wave and the as-sociated ripple, but exhibited variations in many other parameters, including sharp wave amplitude. The apparent reduction in sharp wave amplitude in CBD animals could be related to the predominance of a certain SWR subtype, associated with a certain brain activity, and a better characterization of this could help understand how CBD affects brain-wide dynamics.
Lastly, we highlighted how both sharp wave and ripple activity peaks upon transition from REMS to NREMS, and their activity gradually decreases as the subsequent NREM bout lasts. Surprisingly, we would expect that, the more transitions there are, the more SWR activity there is, since this activ-ity is “degraded” in long NREM bouts, but not in short bouts. This is however not the case, as CBD animals clearly exhibits more transitions, but the same amount of sharp waves or ripples. Ponomarenko et al. [64] showed using
wake-inducing drugs that the occurrence of ripples during NREMS was cor-related to the time of wake preceding sleep. They also demonstrated that, if the ripple activity reaches a baseline level at the end of a NREM bout, the du-ration of the subsequent REM bout will be positively correlated with the peak in ripple activity at the beginning of the next NREM bout. In other words, the longer the REM bout, the more ripple activity is observed at the start of the subsequent NREM bout. Although this study was conducted in natural sleep, their findings strongly support of our own observations, suggesting that CBD animals do not exhibit higher ripple activity, despite showing more transitions, because their REM bouts are particularly short, hence they do not trigger a ripple-activity peak upon transition as high as in VEH animals, which show longer REM bouts.
Limitation and future work
This project has however some limitations. First, the whole study was based on brain recordings from rodents in an anaesthesia-induced sleep-like state. For obvious ethical reasons, the use of anaesthesia also permits to re-use the expensive probes, and to obtain cleaner recordings. Anaesthesia is not typically supposed to induce a sleep-like state, and even if urethane proved to reach a state close to natural sleep with low interactive potential with other drugs [32], it still includes a background effect which is difficult to account for. In other words, the rats were not in natural sleep, and we have to be aware of this: the sleep stages were not real REMS and NREMS, but sleep-like stages. The first issue with this was that our animals "slept" longer than they sleep on a regular basis: they indeed "slept" for 7 hours under anaesthesia, while, as polyphasic sleepers, they normally sleep up to 2 hours [6]. This resulted in a different sleep structure that is normally observed, also in terms of durations of REM and NREM bouts, as our typical bouts in VEH animals lasted longer than they do in natural sleep. Brief wakes were also suppressed by anaesthesia, yet they are an inherent part of rodents’ sleep cycle (Sismako et al. [6] reported that BW accounts for roughly 37% of a rat’s sleep cycle). Replicating the re-sults in natural sleep would be an interesting continuation of the project and would help better understand the effect of CBD on features such as arousals, sleep latency, sleep and wake onset, etc.
Secondly, regarding the detection of memory-associated events, sharp waves and ripples, we merely described them, and our results already open up for many possibilities of further research. For example, we only looked at sharp waves and ripples in the hippocampus. But evidence of cortical ripples has been made, and some studies seem to highlight a form of coupling between
hippocampal and cortical ripples [65]. Furthermore, the PFC and the HPC are both involved in memory consolidation, but it is unclear how activity in the PFC reacts with ongoing activity in the HPC [66], especially with regards to hippocampal SWRs. We did not, in this project, consider specific memory-associated patterns in the PFC, but this could be a continuation of the work conducted here. It could also relate to the aforementioned SWRs subtypes that we only briefly highlighted. There is a lot to unravel regarding this HPC-PFC communication during sleep, but I believe one needs to better characterize it in controls before examining the effect of CBD on it. Therefore such investi-gation did not have its place in the current project, but could be the object of future research.
Lastly, this study was conducted on brain recording from rats, and on the analysis of these only. However, to better characterize if CBD influences mem-ory consolidation, the best way would be to submit CBD animals to memmem-ory exercises and analyse their results. Such study was conducted in parallel of mine. Prior to the surgeries, the animals were trained during several weeks before carrying out the Object Space Task (OST). The OST consist in expos-ing animals to multiple sample trials in which they explore objects under dif-ferent conditions (objects are presented to the animals under successive trials, and objects as well as their location can change in each trial). Such task is meant to trigger memory as animals may retain the information of a certain object in a certain location, and hence spend less time exploring it. Analysis of the OST results was performed in a separate study, and evidence of long-term memory enhancement in the CBD group was exhibited, but more investigation needs to be done. Nevertheless, looking at SWRs for memory consolidation is still relevant, as these patterns could be involved in more than just memory, and the results obtained opened to more questions and lines of research for the future. Note that there are, in the literature, studies investigating the be-havioral effects of CBD in rodents. Schleicher et al. [67] recently showed no significant improvement, in CBD animals, of spatial memory or motor perfor-mance in the Plus Maze, or memory in a Novel Object Recognition test, but showed reduction in anxiety, confirming the anxiolytic properties of CBD that were already highlighted in the past [68][69][70]. Another study [71] demon-strated, by place-conditioning rats with addictive drugs, that CBD prevented the consolidation of drug-related events, and rats did not subsequently show preference to places where the addictive drugs were presented, suggesting here a disruption of memory consolidation. The diversity of results reaffirms the aforementioned complexity of CBD, either for sleep or for memory, and sup-port the idea that more research is still necessary to unravel its full potential.