Future Assembly Layout Design
for assembly of large robots
A state-of-the-art literature review and a Fuzzy AHP analysis for ABB values
Master thesis
Advanced level, 30 credits
Product and process development
Production and Logistics
Vanessa Karlqvist
2020
Tutor, company: Andreas Larsson, Simon Gräsberg Tutor, Mälardalens högskola: Anna Granlund Examiner: Antti Salonen
ABSTRACT
Global competition is growing for companies everywhere and the demand for new and improved products are rising for each day that passes. The globalization brings new opportunities as well as new challenges since companies need to stay up to date and implement new technologies to stay competitive. Not only do customers want up to date products, they also want high quality, low price and individualized products, customized for their needs. This puts high demand on manufacturing companies to adapt their businesses, increase product diversity and to being able to introduce new variations and new products quickly. Since the drastic evolution of technology has increased the competitiveness of industrial companies, and the mass customization demands have increased, the necessity to investigate potential system alternatives towards improving production processes, with the help from the new technology, is required. One way of doing this is
to revaluate one's assembly layouts since the layout design decision is highly connected to the product portfolio and the production volumes.
The specific objective of this thesis is to broaden the case company’s, ABB, knowledge on ways their assembly of large robots can be improved with the focus on potential future assembly solutions. The overall aim of this thesis work is toidentify state-of-the-art possible layout design alternatives, evaluate their performances and finding a method of choosing the final layout approach. This is answered by research questions connected to plant layout selection methodology, plant layout options and finally recommendations for the case company.
The methodology chosen for deciding the recommended layout is the fuzzy Analytical Hierarchy Process which is a multi-criteria decision-making tool suitable for decision
problems with a hierarchical structure, having main attributes and sub attributes connected to each main attribute. Twenty-four attributes were created and ten layouts based on company observations and a literature study. The layout with the highest score was a layout based on a modernized version of the common fixed position layout. The overall
recommendation for the case company was to focus on having a layout in the future with focus on a high technology level as well as high flexibility, for also receiving high
ACKNOWLEDGEMENTS
After five years of studying, I have now come to the end of my journey at Mälardalen
University. I have worked with this master thesis for the last 18 weeks of this last semester. I got a lot of support during the writing process of this thesis and would like to address some grateful thanks to certain people.
First of all, this thesis could not be written without Erik Flores, the initiator of the master thesis collaboration between the case company and Mälardalen University. Without his help to match the case company looking for an engaged student, with me, the engaged student, this thesis would not exist.
I would like to secondly give a big thanks to my School supervisor, Anna Granlund who have help me a lot from ide bursting to thesis improvement. She has always been approachable and understanding, which has helped me a lot with writing this thesis.
Thirdly I would like to thank my supervisors at the case company for all their support and knowledge that led me in the right direction. Their time put down and engagement in the project has inspired me.
I would also like to give thanks to Erik Andersen. Who I was supposed to write this thesis with from the beginning, but has written his thesis on the same department at the case company, giving us the opportunity to discuss and study together. He has been a great support both before the thesis started and during the process.
Lastly, I would like to thank the teachers at Mälardalen University for not only making me grow as a person but inspiring me and genuinely teaching classes with engagement, making these five years a lot of fun while learning so much.
Eskilstuna Maj 2020
LIST OF TABLES
Table 1 Search terms ________________________________________________________ 23 Table 2 Literature study search limitations _______________________________________ 24 Table 3 Screening stages _____________________________________________________ 24 Table 4 Model construction ___________________________________________________ 28 Table 5 Sub attribute weighting template ________________________________________ 29 Table 6 Sub attribute total weight calculation _____________________________________ 34 Table 7 Layout final score calculation template ___________________________________ 35 Table 8 Results of weighting workshop one. ______________________________________ 53 Table 9 Results of weighting workshop two. ______________________________________ 53 Table 10 Sub attribute weighting results. ________________________________________ 54 Table 11 Mean value creation _________________________________________________ 56 Table 12 Mean value calculation part 1 __________________________________________ 57 Table 13 Fuzzification. _______________________________________________________ 58 Table 14 Weight calculation for main attributes. __________________________________ 59 Table 15 Fuzzy weight and center of area calculation _______________________________ 60 Table 16 Center of area normalized _____________________________________________ 61 Table 17 Weights calculation for sub attributes ___________________________________ 62 Table 18 Weighting of layouts _________________________________________________ 63 Table 19 Super matrix creation. ________________________________________________ 64 Table 20 Final layout scores ___________________________________________________ 65 Table 21 Initial layout scores summarized ________________________________________ 66 Table 22 Final main attributes weightings sorted __________________________________ 69 Table 23 Sub assembly weightings sorted ________________________________________ 69
LIST OF FIGURES
Figure 1 Plant layout design ____________________________________________________ 2 Figure 2 Research outline______________________________________________________ 5 Figure 3 Different layout types ________________________________________________ 10 Figure 4 Process layout ______________________________________________________ 11 Figure 5 Product layout ______________________________________________________ 12 Figure 6 Hierarchal structure of the attribute selection methodology __________________ 27 Figure 7 Pair-wise comparison _________________________________________________ 28 Figure 8 Membership function_________________________________________________ 31 Figure 9 Fuzzy numbers ______________________________________________________ 31 Figure 10 Fuzzy scale of relative importance ______________________________________ 32 Figure 11 Reciprocal values ___________________________________________________ 32 Figure 12 Calculating fuzzy geometric values _____________________________________ 32 Figure 13 Example of calculation _______________________________________________ 33 Figure 14 Calculating fuzzy weight ______________________________________________ 33 Figure 15 Center of area calculation ____________________________________________ 33 Figure 16 Full product layout __________________________________________________ 40 Figure 17 Cellular product layout _______________________________________________ 41 Figure 18 Current layout simplified _____________________________________________ 42 Figure 19 Sandwich layout ____________________________________________________ 43 Figure 20 Big Mac layout _____________________________________________________ 44 Figure 21 Cellular product layout with 2 subassemblies _____________________________ 45 Figure 22 Cellular product layout with 6 subassemblies _____________________________ 46 Figure 23 Flow shop layout ___________________________________________________ 47 Figure 24 Fitting room layout __________________________________________________ 48 Figure 25 Matrix layout ______________________________________________________ 49 Figure 26 Performance indicators ______________________________________________ 50
DEFENITION OF KEY TERMS & ABBRIVATIONS
Assembly systems:
An assembly system is generally referred to as a collection of assembly resources and the assembly line on which assembly operations occur. In this thesis, these resources are the assembler, equipment, tools, material supply system etc.Assembly solutions:
In this thesis, assembly solutions are referring to solutions to improve one’s assembly system, in this case mainly how layout selection solutions can improve the assembly system.Plant Layout design:
In this thesis, plant layout design is referring to how the space within a manufacturing facility is formed with machines, stations, material flows etc.Assembly line:
In this thesis, an assembly line is a number of manual or automated stations where a product follows a flow with only one single way to go after each process step.Attributes:
In this thesis, the attributes are referring to qualities that each layout design solution has that can be judged on its performance.Product variety:
In this thesis, product variety refers to the range of products or product variants that can be produced within a certain amount of time.Product volume:
In this thesis, product volume refers to the number of products that can be produced within a certain amount of time.Fuzzy AHP:
Fuzzy AHP (Fuzzy analytic hierarchal process) is the methodology used for analysing the empirical findings in this thesis. It is a tool for collecting qualitative data in a quantified way. In this thesis, that data are collecting opinions on what attributes are most important from key decision makers.Table of Contents
1. INTRODUCTION __________________________________________________________ 1 1.1BACKGROUND _____________________________________________________________ 1 1.2PROBLEM FORMULATION ______________________________________________________ 3 1.3AIM AND RESEARCH QUESTIONS _________________________________________________ 4 1.4RESEARCH OUTLINE __________________________________________________________ 5 1.5LIMITATIONS AND DELIMITATIONS ________________________________________________ 6 2 THEORETICAL FRAMEWORK __________________________________________________ 7 2.1ASSEMBLY SYSTEM DESIGN _____________________________________________________ 7 2.2ASSEMBLY LAYOUTS _________________________________________________________ 9 2.3ATTRIBUTES ______________________________________________________________ 15 2.4DATA ANALYSIS ____________________________________________________________ 17 2.4.1DECISION ANALYSIS _______________________________________________________ 17 2.4.4FUZZY ANALYTIC HIERARCHICAL PROCESS ________________________________________ 19 3 RESEARCH METHODOLOGY__________________________________________________ 21 3.1RESEARCH DESIGN _________________________________________________________ 21 3.2RESEARCH PROCESS ________________________________________________________ 22 3.2.1THE PRE-STUDY -IDENTIFYING THE PROBLEM FORMULATION ___________________________ 22 3.2.2LITERATURE REVIEW AND CONSTRUCTION OF THEORETICAL FRAMEWORK ___________________ 23 3.2.3CREATION OF LAYOUTS _____________________________________________________ 26 3.2.4SELECTION OF ATTRIBUTES ___________________________________________________ 25 3.2.5SELECTION OF DECISION-MAKING MODEL _________________________________________ 25 3.2.6THE FUZZY ANALYTICAL HIERARCHAL PROCESS _____________________________________ 26 3.3RESEARCH QUALITY _________________________________________________________ 35 3.3.1VALIDITY ______________________________________________________________ 35 3.3.2RELIABILITY _____________________________________________________________ 36 4. EMPIRICAL FINDINGS ______________________________________________________ 37 4.1COMPANY INFORMATION _____________________________________________________ 37 4.2LAYOUT CREATION _________________________________________________________ 39 4.3ATTRIBUTE SELECTION AND WEIGHTING ___________________________________________ 50 4.3.1STEP 1.ATTRIBUTE SELECTION ________________________________________________ 50 4.3.2MODEL CONSTRUCTION ____________________________________________________ 52
4.3.3PAIRWISE COMPARISON WEIGHTING OF MAIN ATTRIBUTES. _____________________________ 52 4.3.4STEP 4:SUB ATTRIBUTE WEIGHTING ____________________________________________ 54 5. ANALYSIS _______________________________________________________________ 55 5.1STEP 5:MEAN VALUE CREATION. ________________________________________________ 55 5.2STEP 6:FUZZIFICATION. ______________________________________________________ 58 5.3STEP 7:WEIGHT CALCULATION FOR MAIN ATTRIBUTES. _________________________________ 58 5.4STEP 8:WEIGHTS CALCULATION FOR SUB ATTRIBUTES. _________________________________ 61 5.6STEP 10.SUPER MATRIX CREATION ______________________________________________ 64 6. CONCLUSIONS AND FURTHER RESEARCH ______________________________________ 68 6.1CONCLUSION AND DISCUSSION _________________________________________________ 68 6.1.1RQ1. ________________________________________________________________ 68 6.1.2RQ2. ________________________________________________________________ 68 6.1.3RQ3. ________________________________________________________________ 70 6.3.4AIM AND OBJECTIVE _______________________________________________________ 70 6.2CONTRIBUTION OF THE RESEARCH _______________________________________________ 72 6.3FUTURE RESEARCH _________________________________________________________ 72 7. REFERENCES _____________________________________________________________ 73
1
1. Introduction
This chapter explains the background to the problem at hand as well as a problem formulation. Leading to the aim of the thesis described, followed by the research questions and the delimitations of the thesis work. At the end of this chapter, the thesis outline is presented for a better guidance to the reader.
1.1 Background
Global competition is growing for companies everywhere and the demand for new and improved products are rising for each day that passes (Hozdić, 2015). The globalization brings new opportunities as well as new challenges since companies need to stay up to date and implement new technologies to stay competitive. (Hozdić, 2015). Not only do customers want up to date products, they also want high quality, low prices and individualized products, customized for their needs. (Lucke, 2008) (Riedel, 2013). This puts high demand on manufacturing companies to adapt their businesses, increase product
diversity and to produce more complex products. (Lucke, 2008) (Riedel, 2013). Therefore, many companies are striving towards having a mass customized production where they produce a high variation of products within the same production area. Mass customized production has during the last decades been a topic of interest since the companies that are able to manage it with the right strategy gains success and a market growth (Lander, 2007). The product variety has increased massively, especially for some manufacturing industries, for example the automotive industry. The 7 series for BMW cars is claimed to have 10^17 available variants (Hu, 2013). Another example of this is Volvo trucks that have more than 10^70 number of options which also indicates that a high product variety has become a high priority for manufacturing systems (Elmaraghy, 2016).
One way of handling these product variations is to revaluate one's assembly layouts since the layout design decision is highly connected to the products variety and the production volumes.
Research within the area of facility layouts has been carried out greatly during the last decades. A few surveys have been published to review the different trends and research directions in this area. However, these surveys are either not recent (Hassan, 1994; Kusiak & Heragu, 1987; Levary & Kalchik, 1985) or focus on a very specific aspect of layout design (Amine, 2007). The different configurations of an assembly layout can consist of an assembly line, a combination of several lines or isolated
workstations (De Lit, 2003). In general, the number of configurations given a certain number of
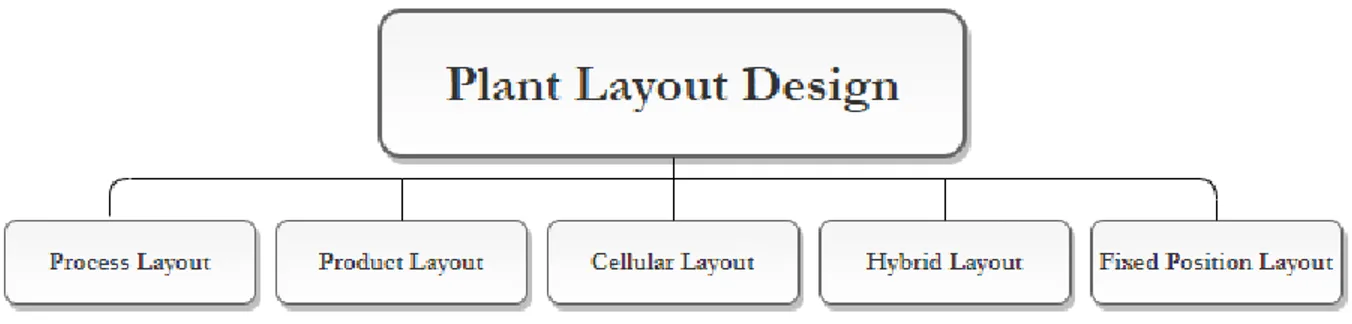
machines can be quite high. For example, given six machines, there can be 170 different configurations, including serial, parallel and hybrid configurations (Koren, 2010). Four types of layouts are referred to in existing articles, these are process layout, product layout, cellular layout and fixed position layout (Dilworth, 1996). These can also be combined, making hybrid layout solutions.
2
Figure 1 Plant layout design
New technology developments has taken place, such as Internet of things, cloud computing, edge computing, digital twins, advanced sensing technology, service-oriented technology as well as all new technologies related to “smart” factories (Cheng, 2018). This has led to a new era of manufacturing where key words are information, communication and digitalization (Hozdić, 2015). Both companies and governments worldwide has identified the need for focusing on these three key words. Global industrial initiatives have been announced to collaborate and aim towards digitalization within the manufacturing industry (Cheng, 2018), such as “the US National Strategic Plan for Advanced Manufacturing”
(technology, 2018), “Production 2030,” (Produktion2030, 2018) and “Made-in-China 2025” (Chinadaily, 2015), as well as the recently very discussed “Industry 4.0” that originated 2011 from the German government. Industry 4.0 is also known as the fourth industrial revolution (Anderl, 2015). Industry 4.0 is a new flexible way of manufacturing, where the physical and virtual world coexist to support people and machines to perform their tasks in an optimal way (Anderl, 2015). With Industry 4.0, technologies have made it possible for machines to become connected in the factories. The machines can exchange
information with each other and send out information about equipment, materials and the environment to a virtual space, where humans can control the processes (Tao, 2017). Sometimes these machines can be smart enough to regulate values themselves without human interactions (Tao, 2017). Wired or wireless sensors can be connected to machines to measure machine speed, energy consumption and tool wear for example and RFIDs can be used for collecting data about specific products (Tao, 2017). When these machines collaborate with each other, a production system becomes more adaptable, flexible and more robust (Tao, 2017). This has led to new assembly system solutions being available and has perhaps changed what assembly layout design that is preferable for certain attributes.
Since the drastic evolution of technology has increased the capacities of assembly systems and
the mass customization demands have increased, the necessity to investigate potential system
alternatives towards improving production processes, with the help from the new
3
1.2 Problem formulation
The companies that have an interest in mass customized production, where they produce a high variation of products within the same production area, need to handle a higher complexity with
controlling the production than with companies that only produce a few standardized products (Lander, 2007). Developing and maintaining a good layout is a common problem for all companies, regardless of the business being conducted. What you want to achieve with an improved layout varies from case to case, and it is not always the same goals that needs to be reached at different companies (Andreasson, 1997). There is no specific method for arriving at a good layout. Even when it is known which items to place, they can be placed in many different ways (Andreasson, 1997). When trying to have a high product variation and minimize production costs without changing production lines, products can be divided into groups of similar characteristics, also called product families, that can be assembled within the same assembly line. That means that the product variations may have different assembly times and different components needed in the line. The lead time and number of produced products will vary from day to day depending on the amounts produced, which can be negative for the assembly process. Therefore, the problem of having variations in the assembly process is more of an issue for companies that strive toward a mass customized production than lines with few standardized products. (Lander, 2007). Because of the variations in production time and components when producing in family groups, companies face the problem of balancing the lines. (Lander, 2007). One specific solution is just about impossible to solve the takt balancing for the goal of a mass customized production. There are also other problems connected when producing several variants in the same line, like material storage and supply (Lander, 2007), which makes it worthwhile to revaluate the assembly layout and determine which assembly layout that fits best for one's companies' prioritizations.
4
1.3 Aim and research questions
The specific objective of this thesis is to broaden the case company’s, ABB, knowledge on ways their assembly of large robots can be improved with the focus on potential future assembly solutions. The overall aim of this thesis work is toidentify state-of-the-art possible layout design alternatives, evaluate their performances and finding a method of choosing the final layout approach. To fulfil the aim and address the objective of the thesis, three research questions have been posed:
RQ1. How can a new layout solution for an assembly system be decided?
RQ2. What possible future plant layouts are there and what are their
advantages and disadvantages considering selected attributes based on company prioritization, state of the art technology development and mass customization requirements?
RQ3. What plant layout is recommended for the case company with future available layout solutions considered?
5
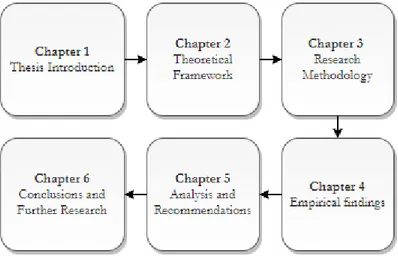
1.4 Research outline
This section will provide guidance by presenting the upcoming chapters and what they entail. Chapter 2: Explains the theoretical framework including information about assembly system design, assembly layouts, attributes, data analysing with further descriptions of decision analysis and the fuzzy AHP methodology.
Chapter 3: Explains the chosen methodology for this thesis work, the research process and the validity and reliability of the study.
Chapter 4: Presents empirical findings from the case study.
Chapter 5: Presents the analysis of the empirical findings presented in chapter 4 as well as recommendations for the case company.
Chapter 6: Concludes the report and includes a discussion and proposals for further research.
6
1.5 Limitations and delimitations
Firstly, since the future demand is concerned, the thesis will be highly conceptual and the
recommendations will be based only on theory and industrial thoughts, no implementation or validation will take place to prove or test the recommendations in this study. Some assembly solutions might also be more likely and more beneficial to implement in a future state rather than in the currents state at the case company. Based on the prioritizing of the case company, security, environmental impact and quality have had the main focus, and therefore, have been excluded from the layout weighting in this study. The future state offered product selection of the company are not “set in stone” yet, which means that the exact current state of the assembly may be wrong, which may affect the preciseness of the assembly suggestions proposed at the end of this study. The quality problems of products or components that exist in mass customized production are not included in this research because this issue contains many factors where the researcher does not have time to further study because of time limitations.
Because of geographical restrictions, this thesis was conducted from the Mälardalen region, all empirical data is therefore conducted at the specific production plant in Västerås and not from other global production sites where a more modularized production process may already be implemented.
7
2 Theoretical Framework
The theoretical framework consists of descriptions of assembly system design, assembly layouts,
attributes, data analysing with further descriptions of decision analysis and the fuzzy AHP methodology. The information was gathered from the literature study conducted.
2.1 Assembly system Design
An assembly system can be described in many ways. Bellgran and Säfsten (2010) referred to a system as a collection of different components, such as people and machines, that are interrelated in an organized way and work together towards a purposeful goal. The assembly system can also be described as an assembly system being a transformation system in which preassembled parts or modules are gradually transformed into the final products through the final assembly operations performed by the operators (Hubka, 1988). The parts of an assembly system are commonly assemblers, tools and equipment, material supply, assembly work instructions and procedures, assembly plans, supporting technology, and management of assembly operations. In this thesis, the components referred to are the collection of products and assembly resources (assembler, equipment, tools, material supply system etc.) on the assembly line, by and on which assembly operations occur.
The different configurations of an assembly line can consist of an assembly line, a combination of several lines, or isolated workstations (De Lit, 2003). An assembly line typically consists of a number of
workstations that are connected by transportation links, which move a product between stations in a specific flow. In an assembly line, the assembled product gradually takes shape as additional parts are attached at various workstations that the product visits (De Lit, 2003). The order of assembly operations to produce the final product is specified in the assembly sequence plan.
Most research conducted on assembly system design has been conducted within the area of sequential organization of stations on the line while only relatively few works are dedicated to alternative
configurations such as parallel stations or hybrid forms (Bukchin and Rubinovitz, 2003), in other words, layout configurations. In the context of the increasingly required volume flexibility of an assembly system, the lack of integration of the layout design with assembly line balancing is still an open research question (Hu et al, 2011), especially regarding the scalability of the assembly system. There have been huge efforts made in history for addressing scalability and flexibility. For example, in the 1990’s by Flexible Assembly and Manufacturing Systems, followed by Holonic systems (Van Brussel, 1998) in the late 1990’s-early 2000s and Reconfigurable Systems (Elmaraghy, 2006) in the last decade. Another more recent trend is the scenario of evolvable assembly systems that have self-organization capabilities and are able to cope with ever-changing requirements as an outlook on the future of assembly automation (Semere et al, 2008; Onori and Oliveira, 2010). Although these great efforts, achieving a cost-effective and high-variant assembly remains elusive.
Recently, the technological advances in the research era of the Internet of Things (Xu, 2014), Cloud Computing (Xu, 2012) and the industrial practices in the assembly scheduling systems have provided a
8
solid foundation to implement real-time monitoring and optimizations in assembly systems, including improving the data collection of manufacturing resources (Ren, 2019), introducing real-time monitoring of the assembly execution systems (Muñoz, 2005), using dynamic optimizations for the manufacturing processes (Tang, 2016), etc.
These new technology developments have provided the technological basis for the intelligent assembly systems that will change the way assembly systems are designed. (Qian, 2020).
Other technology improvements that have led to an improved assembly system design are technology developments within the areas of modelling and simulation. They are also becoming increasingly important in decision-making processes for the selection of suitable assembly system design. (Heilala et al, 2007, 2008).
9
2.2 Assembly layouts
Research within the area of facility layouts has been carried out greatly during the last decades. A few surveys have been published to review the different trends and research directions in this area. However, these surveys are either not recent (Hassan, 1994; Kusiak & Heragu, 1987; Levary & Kalchik, 1985), or focus on a very specific aspect of layout design. (Amine, 2007)
Developing and maintaining a good layout is a common problem for all companies, regardless of the business being conducted. What you want to achieve with an improved layout varies from case to case, and it is not always the same goals that needs to be reached at different companies. (Andreasson, 1997). There is no specific method for arriving at a good layout. Even when it is known which items to place, they can be placed in many different ways. (Andreasson, 1997). In general, the number of configurations given a certain number of machines can be quite high. For example, given six machines, there can be 170 different configurations, including serial, parallel and hybrid configurations (Koren, 2010). Because of these difficulties, people often rely on intuition and experience when developing a new layout (Andreasson, 1997). A holistic approach is an important concept when it comes to designing assembly systems. Therefore, it is important to gather as much information as possible that is available. This information can be found on paper but also from people with experience. The information can be obtained from the people working with the current production but as well with the personal in functions around. By utilizing knowledge within the company and working in a methodical way, the best layout will emerge (Andreasson, 1997).
Five types of layouts tend to appear in the literature: fixed position layout, process layout, product layout, cellular layout, and hybrid cellular layout (Dilworth, 1996, Shambu and Suresh, 2000). Even though these are distinct groupings some variations in definitions do exist (Drira et al, 2007). Dilworth (cited in Drira, 2007, p 256) explains the five types of layouts as follows:
“In Fixed product layout, the products generally circulate within the production facilities (machines, workers, etc.); in this particular type of layout, the product does not move, it is the different resources
that are moved to perform the operations on the product. This type of layout is commonly found in industries that manufacture large size products, such as ships or aircrafts. Process layout groups facilities
with similar functions together (resources of the same type). This organization is often reported to be suited when there is a wide variety of product. Product layout is used for systems with high production
volumes and a low variety of products. In Cellular layout, machines are grouped into cells, to process families of similar parts.”
The different layouts mentioned in the literature have different terms for the same type of layouts. Producing products towards mass production with high volume and very low variety can be called Product layout (Dilworth, 1996), serial lines(Hu, 2011), flow layout (Hu, 2011), production-line layout (Drira et al, 2007) or flow oriented layout (Andreasson, 1997). Plant layouts with a low volume and a high variety are mentioned as job shop (Lei, 2018; Pimentel, 2019), process layout (Dilworth, 1996), or
10
functional layout (Andreasson, 1997). Other layouts that exists usually have a combination of variety and volume between those outlier layouts (Dilworth, 1996; Andreasson, 1997). The layouts mentioned that are a mixture of process and product layout are usually called cellular layout (Dilworth,1996, Drira et al, 2007), hybrid layouts, hybrid cellular layout (Shankarc, 2012) or group technology layout (Chan, 2002). For this thesis, the term product layout is chosen for high volume-low variety layouts, process layout is chosen for layouts with low volume-high variety layouts and combinations are further mentioned as cellular or hybrid layout, depending on the type of combination between process and product layout.
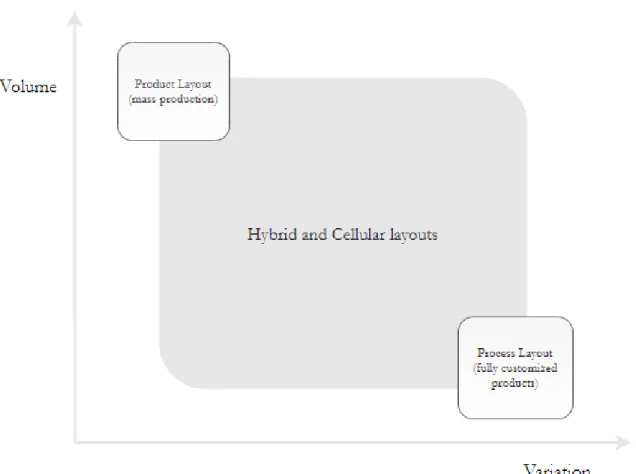
The two parameters of product volume and product variety can be visualized in the figure 3 below. There is the continuous layout (for products like paint or liquid) as well as fixed position that are even more outside of the diagram. (Andreasson, 1997) The fixed or static product layout is used when the product is too large or cumbersome or not feasible or not convenient to move through the various processing steps. In this particular type of layout, the product does not move, resources/machines are moved to perform the operations on the product. This type of layout is commonly found in electronics and construction industries, and industries that manufacture large size products (Shankarc, 2012).
11
2.2.1 Process layout
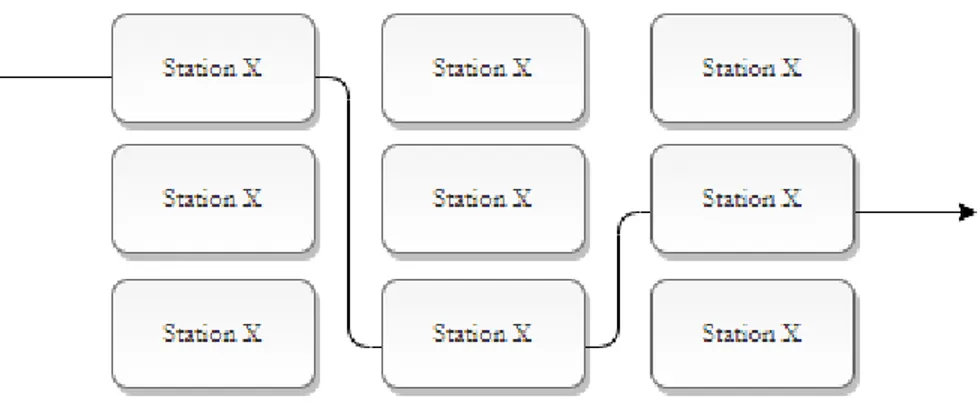
In a process layout, all certain kind of machines are grouped together in one place or department (Andreasson, 1997). Process layouts group facilities/machines with similar functions together (resources of the same type). This way of organizing is suited to larger product varieties and low production
volumes per product type. (Drira et al, 2007)
Figure 4 Process layout
Advantages
The process layout is suitable when many different products are produced in not too large series. The flexibility to handle different products becomes great, which is why the layout is suitable for support equipment. The products can have different complexities as they can be processed in few or many steps. The layout allows all combinations. If the different process departments are grouped on and managed separately, a high level of expertise is often developed in each department. Supplying with, for example, air, water, raw material or chipboard transport becomes easier, as this is done in fewer places than in other alternatives (Andreasson, 1997). Other benefits of a process flow is that fewer machines are required, comparatively low investment in machines are required, better utilization of machines, a higher degree of flexibility exists relative to equipment or manpower allocation for specific tasks and production planning and control systems are more involved. The diversity of tasks offers a more interesting and satisfying occupation for the operator and the last advantage mentioned here is that specialized supervision is possible. (Shankarc, 2012)
Disadvantages
There is a large proportion of goods in work and the lead times are long (Andreasson, 1997; Shankarc, 2012). It can also be somewhat difficult to understand and requires active control of the production manager. There are many transports, which entails large costs for transport and material handling (Andreasson, 1997; Shankarc, 2012). Historically, this has been the dominant layout and is still very
12
common with middle sized companies. When the requirements for increased series sizes come, the layout becomes difficult to handle and other options are more suitable. (Andreasson, 1997).
2.2.2 Product layout
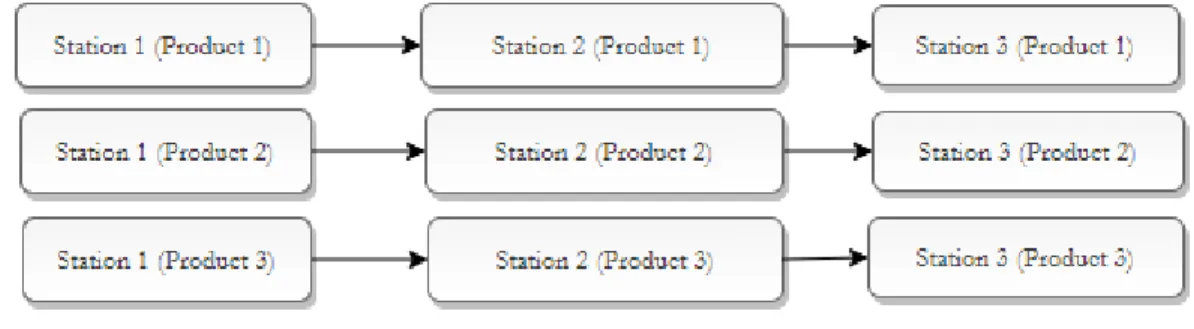
This layout is adapted for the production or assembly of few products in large series. The idealistic product is a product that is produced continuously, such as the cars on the conveyor belt during a car production. The resources needed are grouped along the product flow path. (Shankarc, 2012) The products follow this flow and do not need to be transported back and forth between different stations as in the process layout. Product layouts are used for systems with high production volumes and a low variety with a high standardization along the products. Facilities are organized according to the sequence of the successive manufacturing operations. In a strict sense of product layout, the same machines are not shared by different variety of products (Drira et al., 2007; Francis et al., 2002).
Figure 5 Product layout
Advantages:
With the product layout, there are short setup times and little work in progress. Transport and material handling of the products can be kept at a low level. The layout is clear and therefore relatively easy to control and plan (Andreasson, 1997). Other advantages are small in-process inventories, reduced material handling, total production time per unit is short, simple production planning and control systems are possible, little skill is usually required by operators at the production line, hence, training is simple, short, and inexpensive, less space is occupied by work in transit and for temporary storage (Shankarc, 2012).
Disadvantages:
The system is inflexible meaning that it is not easy to change products (Andreasson, 1997). The interference sensitivity is also greater than for the process layout since there are no alternative flow paths. If there is a breakdown of one machine, that will lead to complete stoppage of the line that follows that machine and could result in the entire production being in a standstill (Shankarc, 2012; Andreasson, 1997). The provision of service becomes more complicated as each function is in more places. More transport and handling are also needed for maintenance (Andreasson, 1997). Other drawbacks include that product design change may require major alterations in the layout. And
13
comparatively high investment is required as key machinery are often duplicated in the production line (Shankarc, 2012).
2.2.3 Hybrid and Cellular layouts
A layout can advantageously be a mixture of a process and a product layout. Products that make up a large volume can have their own flow line, while other products are manufactured in a process layout. There are not really many occasions where one layout can be used purely. These types of mixed layouts are called hybrid layouts (Andreasson, 1997). In practice, it is seldom possible to divide all parts and machines into independent cells, and therefore a residual process layout often becomes necessary (Murthy and Srinivasan, 1995; Suresh, 1991). Except for mixing process and product layout in a hybrid way, one can also make use of cellular layouts. In a cellular layout, dedicated dissimilar machines are grouped into cells, to process families of similar parts (Chan, 2002). In this layout design, the processing sequence is usually the basis for forming families of products and hence cells. For the production of smaller series of similar products, cellular layouts can be used. The layout is based on gathering the resources needed in groups, which can manufacture some special products. In principle, each group is somewhat a functional workshop, which is a product layout for a smaller number of products. Unlike a purely product layout, where the product goes the same way through all machines, different flow paths are possible in a group layout (Shankarc, 2012).
The advantages and disadvantages will be a combination of the process and product layouts, depending on the composition of the groups. A possibility of duplication of machines among the cells are possible and a mix of special purpose machinery and general-purpose machinery are employed. A high
investment in machines can be required and a hybrid or cellular layout will have a lower machine utilization than for process layout. Depending on the balancing of the material flow through the cell, buffers and work-in-process storage are required. These layouts will have shorter travel distances and smoother flow lines than for process layout. Compared to process layout, low skill levels are required for employees (Shankarc, 2012). One of the biggest reasons why companies are changing from a process layout to a cellular layout is that benefits can normally be realized with relatively low capital investment by relocating and possibly duplicating certain machines as opposed to other automated strategies (Bazargan-Lari, 1999). Benefits of changing to a cellular layout from a process layout are improvements with lead times, set up times, work in process, quality, machine utilization and employee job satisfaction (Bazargan-Lari, 1999; Heragu, 1994; Wang et al., 2001). Although great benefits are to be found by using the right tools, Vitanov (2007) presents that cellular layout practitioners tend to choose less
sophisticated techniques such as those that are based on part shapes. The problem with cellular layout technology is that existing cell formation methods are unable to effectively address practical
requirements from industry. There are algorithms created for optimizing manufacturing flows, although the algorithms developed by various researchers needs to be more interactive and user friendly for the software tools to be actually used in industry (Vitanov, 2007). Many studies have been performed when it comes to changing from a process layout to a cellular layout, especially studies using simulations to measure benefits of changing layout type (Morris et al, 1994; Shafer et al, 1993; Suresh, 1992;
Farrington, 1998). However, not much can be found about how to simulate differences between other layout configurations. Other problems with simulation layout changes are the lack of performance indicators available to use. For example, Ekren et al. (2008) mentions that to their knowledge, using four
14
different manufacturing process performance indicators, i.e., scheduling rule, machine downtimes, batch sizes, and transporter capacities, is a first when judging layout design in a simulation. This can also be a reason why cellular or hybrid layout configurations are hard to design.
Moreover, grouping of machines can also be done in a hybrid layout, forming a hybrid cellular layout which would include both manufacturing cells that are dedicated to specific part families and other machines arranged functionally. A hybrid cellular layout is one in which a process layout and a cellular layout coexist (Shambu and Suresh, 2000). This system includes both manufacturing cells that are dedicated to specific part families, especially those with stable and high demand, and other machines arranged functionally, generally to produce parts with low and erratic demand. Hence the overall manufacturing system may be capable of responding to a wide range of demand patterns quickly and effectively, in addition to providing the benefits of producing with manufacturing cells (Al-Mubarak et al, 2003; Satoglu and Suresh, 2009).
15
2.3 Attributes
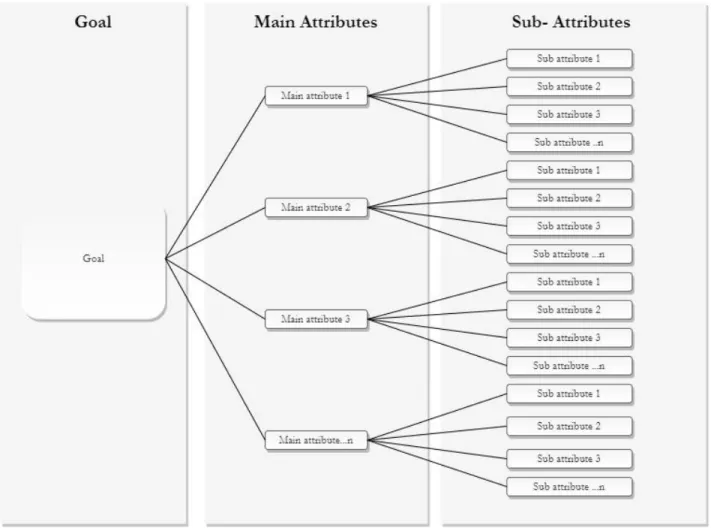
To be able to evaluate different layouts, attributes are needed. The attributes can be created to judge both qualitative and quantitative factors. The different factors will then be graded by importance by key decision makers. Therefore, it is important that the attributes are created for being judged by these decision makers (Hasan 2009; Hasan et al, 2008). For the fuzzy AHP method, one creates different main attributes and then have sub-attributes within each main attribute to be further weighted within each main attribute. In the selection of main attributes, the attributes should be chosen to not be too vague or too focused for the purpose such that an accurate as possible weighting can be obtained from the decision makers while maintaining a tractable AHP model that would be easy for involved key persons to understand and for the empirical findings to be obtained in a smooth way. In the literature, many different attributes can be identified.
Sharma et al (2016) have made performance indicators of facility layouts, split up in seven key attributes: space utilization, management and control, flow of material, internal household and employee satisfaction, ease of maintenance, preferred closeness and attractiveness of layout (Sharma, 2016). Ekren et al (2008) based the evaluation of layouts on flow time with the sub attributes
transporter capacity, batch size, machine downtime etc. Ekren et al (2008) also demonstrates that various manufacturing parameters should be considered jointly when designing or redesigning a facility. Yaman et al (1993) claims that the important factors of facility layout evaluation is minimizing material handling cost, minimizing overall production time, minimizing investment in equipment, effective utilization of space, providing employee safety, convince and comfort, flexibility for rearrangement and operations and facilitating the manufacturing process. Kousay (2017) has created performance
indicators based on a cyber physical system perspective. These are count (amount produced), scrap ratio, throughput rate, target values, takt time, overall equipment effectiveness (OEE) and downtime. He also evaluated other specific areas such as agility. Shankarc (2012) collected information and created four keys attributes. These attributes are ability to modify product/process, schedule reaction, human factors, and agility enrichment factors. Shankarc (2012) created main attributes and sub attributes. The three sub attributes under the Ability to modify product/process controlling criterion are flexibility of arrangement and operation, minimal investment in equipment and facilitate the manufacturing process. The three sub attributes under the controlling criterion Schedule Reaction are minimal variation in types of material handling equipment, minimal material handling cost, and minimal overall production time. The three sub attributes under the controlling criterion Human Factors are employee safety,
convenience, and comfort, facilitate the organizational structure, and compatible operator skill. The three sub attributes under the main attribute Agility Enrichment Factors are effective utilization of existing space, low work-in-process inventory, and effective production planning and control systems. For the last decade, a digitalizing trend as well as the trend of highly customized products have increased remarkable. This can be seen in resent literature about layout design and assembly systems and are important to consider when coming up with important attributes. The relevance of the digitalization and reconfigurable manufacturing systems will be described further.
16 Digitalisation for assembly system attributes
Today, components of plants are mostly isolated and not aware of their environments. At best, they can send out information, but not often interact with each other. Today, it is engineers that plan, evaluate and configure future changes in productions. This is of course a very costly and time-consuming process that can also include human errors (Schroeder, 2016). The new industry 4.0 technologies make it possible for individual components to communicate over the internet to explore their environments (Schroeder, 2016). The components can be made by many different manufacturers as long as they have a standardized industry 4.0 communication interface (Schroeder, 2016). This interface functions much like a normal computer system, within the component, this interface can be built up in a proprietary manner, but with the outside world, it interacts like the industry 4.0 way (Schroeder, 2016). Simulation models are used a lot in digital twins (Schroeder, 2016), but they are just one out of many aspects which needs to be taken into account when it comes to planning and operating a plant (Schroeder, 2016). Smart systems today are “systems of systems.” (Schluse, 2018). These system components are smart systems on their own, but also working together to make a functioning system all together. When making these types of smart systems, you need simulations on component level to include detailed information to gain enough insight to be able to analyse, optimize, verify and validate those systems. (Schluse, 2018). To have experimental digital twins, you need detailed simulation models with a high grade of automation in both a mechanical way and in the information flow way.
Reconfigurability for assembly system attributes
Flexibility has become one of the most desirable traits to fulfil in modern manufacturing systems (Jain et al., 2013). While flexibility can be described as “the ability to change or react with little penalty in time, effort, cost, or performance” (Upton, 1995), reconfigurability can be described as the ability to
restructure the production system through an ability to add, remove, and/or rearrange the structure of the production system (Abdi and Labib, 2003; Jackson, 2000). Reconfigurability can also be described as “the engineering tools that they need to be flexible and respond quickly to market opportunities and changes” (Mehrabi et al,. 2000b). Therefore, reconfigurability can be seen as a way to achieve flexibility. Initiatives that indicate this change are for example Factory-in-a-Box (Jackson et al, 2008) and Industry 4.0 (Brettel et al, 2015) An assembly system as well as the whole factory needs a structure in order to easily switch to different product groups or families. This has been discussed in the field of
transformable manufacturing (Nyhuis et al, 2006; Wiendahl and Heger, 2004). Assembly systems need to develop products in ready to-ship-state and therefore needs to be prepared for changes including manufacturing, assembly, buffers, quality measurement, and packaging. (ElMaraghy and Wiendahl, 2009).
17
2.4 Data analysis
The data analysis steps in this thesis are based on scientific methods of Decision analysis, Multi criteria decision making, Multi attribute decision making and the Fuzzy analytical hierarchical process method. These base of these will be described in this section, 2.4, and the methodology of using them will be described in section 3, the methodology chapter.
2.4.1 Decision analysis
Decision making can be defined as "the study of identifying and choosing alternatives based on the values and preferences of the decision maker. Making a decision implies that there are alternative choices to be considered, and in such a case we want not only to identify as many of these alternatives as possible but to choose the one that has the highest probability of success or effectiveness and best fits with our goals, desires, lifestyle, values, and so on." (Harris, 2009)
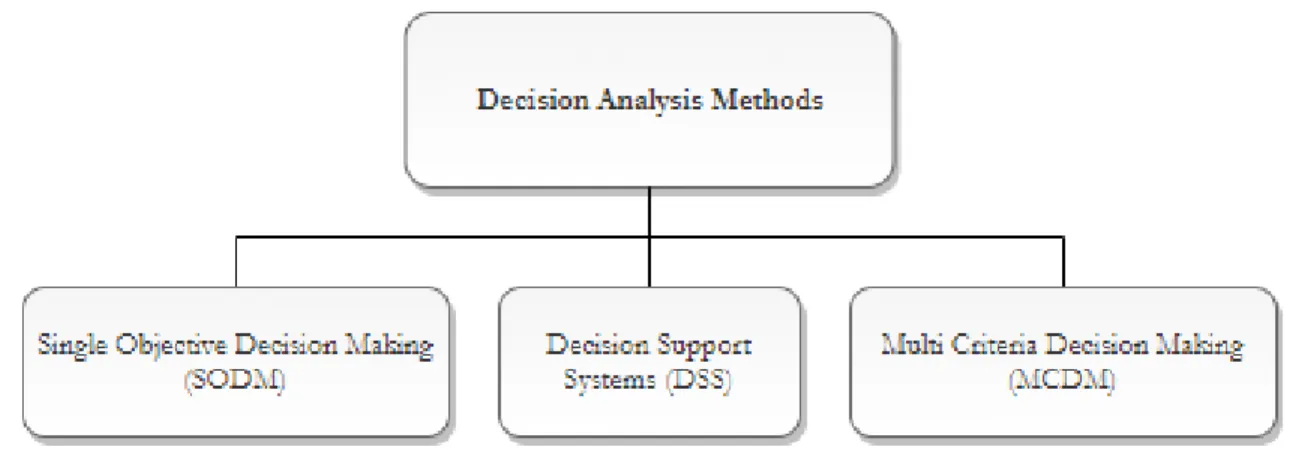
Zhou and Poh (2006) have classified Decision Analysis methods into the three main groups (Figure 6) which are Single-Objective Decision-Making (SODM), Decision Support Systems (DSS), and Multi-Criteria Decision-Making (MCDM).
Figure 6 Three main groups of decision analysis
2.4.2 Multi criteria decision making
Multi-criteria decision making is the most well-known decision making, which deal with decision problems under a number of decision-criterias (Triantaphyllou et al., 1998).
Multiple Criteria Decision Making (MCDM) is an emerging discipline which supports decision makers when conflicting and multiple criterias are to choose between. The concept started emerging
around three decades ago and is closely related to computer science advancements, especially when it comes to more complex decision models. The base of MCDM is selecting and
18
ranking different criterias based on the decision makers. All multi criteria decision making tools can be split into two classes, Multi-objective Decision-Making (MODM) and Multi attribute Decision-Making (MADM) (Abu, 2009). MODM problems can be referenced to as mathematical problems while MADM is more of a selecting problem. A decision problem is a MADM problem if the possible alternatives evaluated are finite. It helps with defining the best possible solution from a predetermined number of alternatives, while MODM creates an optimal solution from a very large number of alternatives or from unpredefined alternatives (Abu, 2009).
2.4.3 Multi Attribute Decision Making Problem
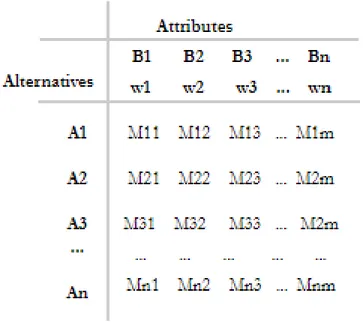
MADM is especially valuable when you have the finite number of alternatives in the beginning of the decision process (Triantaphyllou et al., 1998). MADM problems can be solved with both qualitative and quantitative data. Often, human judgement is the only available way to evaluate decision alternatives. Human judgement is subjective and related to uncertainty. (Guo et. al., 2009). MADM approaches can be used to combine information in problem solving matrix together with information from decision makers. A decision table is conducted to rank, sort, screen and selecting among decision alternatives (Kahraman, 2008). The decision table exists of four main parts, namely: (a) alternatives, (b) attributes, (c) weight of relative importance of each attribute and (d) measures of performance of alternatives with respect to attributes. These main parts can be visualized in figure 7, which is based of Rao (2007), where alternatives are listed as Ai (for i = 1, 2, ..., N), attributes are listed as Bj (for j = 1, 2, ..., M), underneath are the weights of attributes, wj (for j = 1, 2, ..., M) and measures of performance of alternatives, mij (for i = 1, 2, ..., N; j = 1, 2, ..., M).
Figure 7 Decision matrix for analysing multi attribute decision making problems
Within the decision analysis category of MADM there are different models available. These can be classified in different ways, for example by having deterministic data
19
or nondeterministic data (Keyser and Spriner, 2010). Keyser and Spriner (2010) also classifies them within the groups as “Hierarchy between criteria”, “Order between criteria”, “Tradeoff between criteria” and “No a priori information”. The models can also be categorized in group of three according to Keyser and Spriner (2010), in the ways of “Conversion of secondary objectives in constraints”, “Development of a single combined objective function” and “Treatment of all objectives as constraints”. A few different methods can be found within each combination of classes and a decision whether to use a fuzzy method or not needs to be made. Fuzzy methods are conducted to deal with vagueness and uncertainty of human thought in industry, nature and humanity (Zadeh, 1965). Within the selection of classes
appropriate for this thesis, three methods can be found, the SAW method, the TOPSIS method and the AHP method. In short, the SAW method is the most simple one (Kahraman, 2008), TOPSIS works in a way that it identifies the ideal solution, then the alternative that is closest to the ideal solution and furthest away from the non-ideal solution is chosen. The AHP method is a highly flexible method that splits the alternatives into a hierarchal system which then can analyse quantitative and qualitative factors in a systematic way (Ko, 2005).
2.4.4 Fuzzy Analytic Hierarchical Process
Layout generation and evaluation is often challenging and time consuming, due to its inherent multiple objective nature and its data collection process (Lin and Sharp, 1999a; Lin and Sharp, 1999b). There are a number of objectives which may be addressed in facility layout (Francis and White, 1974; Tompkins, 1976; Yaman and Balibek, 1999) including minimizing material handling cost, minimizing overall production time, minimizing investment in equipment, effective utilization of space, providing for employee safety and comfort, flexibility for rearrangement and operations, and to facilitate the manufacturing process. Each layout problem has its own unique characteristics and the objectives in a plant layout study might include one or more of these (Ekren and Ornek, 2008; Nahmias, 2005). Most literature for a layout design problem falls into two major categories, algorithmic and procedural
approaches. However, algorithmic approaches have focused mainly on minimizing flow distance in order to minimize material handling costs. On the other hand, procedural approaches have relied heavily on experts’ experience and can incorporate both qualitative and quantitative objectives in the design process (Muther, 1973; Yang and Kuo, 2003). The facility layout problem needs to integrate both qualitative and quantitative decision dimensions. Many existing layout models normally generate a single layout design and many of these models consider cost (usually travel cost) as the sole criterion and the layout with the minimum cost is presented to the decision maker, ignoring many real-world constraints (Bazargan-Lari, 1999). Facility layout problem solutions need integrated decisions from many different functions (Yaman and Balibek, 1999) to be valid. For this reason, the facility layout design problem is very much related to production system type selection (Abdou & Dutta, 1990) and subjective criteria satisfaction (Yaman, 1993). Thus, it is required that the layout models be judged by the decision maker on many relevant real-world factors.
A popular approach for multi-attribute decision-making problems with significant advantages (but with some limitations) is AHP (Saaty, 1980). The analytic hierarchy process (AHP) is a decision-making procedure originally developed by Saaty (1977, 1980, 1986). Its primary use is to offer solutions to decision and estimation problems in multivariate environments. The AHP establishes priority weights for alternatives by organizing objectives, criteria, and sub criteria in a hierarchic structure (Seri, 2010). The AHP method has been used in many purposes as a useful multiple criteria decision making (MCDM) tool
20
or a weight estimation technique in many areas such as selection, evaluation, planning and
development, decision making, forecasting, and so on (Seri, 2010). The purpose of the AHP is to provide a vector of weights expressing the relative importance of those layout alternatives for each criterion. This can be done using Saaty’s (1980) four steps:
(1) Structuring the hierarchy of criteria and alternatives for evaluation. (2) Assessing the decision-makers evaluations by pairwise comparisons.
(3) Using the eigenvector method to yield priorities for criteria and for alternatives by criteria. (4) Synthesizing the priorities of the alternatives by criteria into composite measures to arrive at a set of ratings for the alternatives.
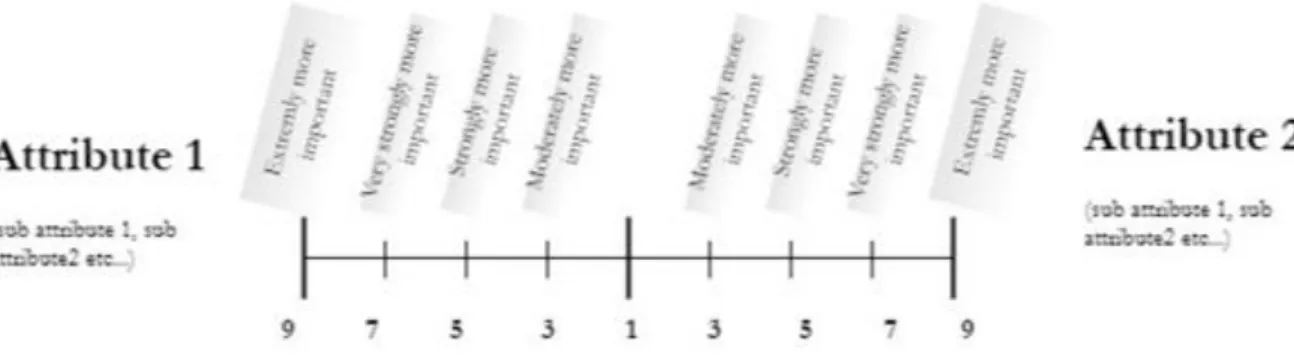
Figure 8 Converting verbal expressions to numbers in the AHP method, based on Saaty's priority theory (Saaty, 1980)
Many scholars have engaged in the fuzzy extension of Saaty's priority theory. Since the publication of Saaty's The Analytic Hierarchy Process, van Laarhoven and Pedrycg (Laarhoven, 1983) proposed a method, where the fuzzy comparing judgment is represented by triangular fuzzy numbers. They used fuzzy numbers with triangular membership function and simple operation laws. According to the method of logarithmic least squares, the priority vectors were obtained. Chang (1996) developed a new approach for handling fuzzy APH. The method is based on the use of triangular fuzzy numbers for pairwise comparison scale of fuzzy AHP, and the use of the extent analysis method for the synthetic extent value S of the pairwise comparison (Chang, 1996). Buckley (1985) came up with a method where geometric means are used for calculating the weights, which was created for its simplicity to
21
3 Research Methodology
This chapter explains the chosen methodology used for this thesis work, the research process steps as well as the validity and the reliability of the study. The methodology of conducting a case study as well as conducting a literature study was used with both qualitative and quantitative methods to collect
empirical data. The process steps were Identifying the underlying background problem, conducting a literature review with a theoretical framework, then empirical data was gathered through primary and secondary data collection followed by analysing of the empirical data and lastly drawing up a conclusion with answers to the research questions.
3.1 Research Design
Describing and understanding facts is the main goal of doing scientific research and therefore it is essential to conduct research in a structured manner which leads to scientific results (Bryman, 2007). A research design outlines the way one approaches to conduct research. Choosing the research design is about considering the empirical data that should help in understanding a phenomenon (Blomkvist, 2015). The methodological approach that was chosen is a causal case study. Case studies generate detailed data where the complexity of reality is more successfully captured than in for example an experiment (Yin, 2007). This supports the objective of this study, that is to create an in-depth understanding of the state-of-the-art layout approach of manufacturing companies and how that knowledge can be used for assessing what is best for the case company. A case study can use many different data gathering methods, for example: interviews, observations, and the collecting of written documents (Blomkvist, 2015). These general characteristics of research designs serve as a background for considering the specific designs for case studies. Four types of research designs are presented by Yin (1997) based on a matrix which shows that single and multiple-case studies reflect different design situations and that, within these two variants, there also can be unitary or multiple units of analysis. According to Bryman and Bell (2007), a case in a case study can either be a single organization, a single location, a person or a single event. In line with Yin (1994), the single-embedded case study is chosen for this research. A single case, meeting all of the conditions for testing the theory, can confirm, challenge, or extend the theory. The single case can then be used to determine whether a theory’s propositions are correct or whether some alternative set of explanations might be more relevant. The single case can represent a significant contribution to knowledge and theory building. Some may say a single case study is not sufficient for handling this research but actually according to case design and type of information and source of data which are variants, single case study with embedded units fits this research. The same single-case study may involve more than one unit of analysis. This occurs when, within a single case, attention is also given to a subunit or subunits. For instance, even though a case study might be about a single organization, it can contain different units, in this case the different people assessing the attributes act as the units and therefore the research design can be called an embedded case study design.
22
3.2
Research Process
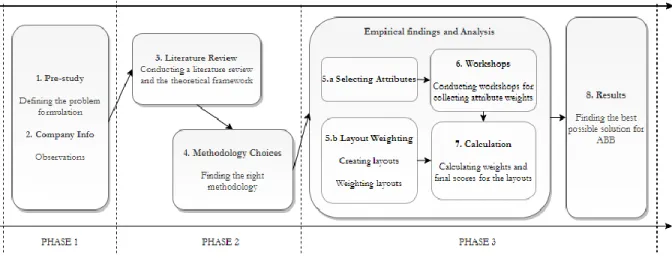
The research process consisted of three phases. Phase one, where the definition of the problem was set and where general knowledge about the case company was gathered. Phase two consisted of a
literature review and a state-of-the-art study on layout designs, as well as deciding the methodology of the research. Phase three consisted of collecting empirical data from the case company, analysing it and comparing it to the empirical findings in the literature study according to the chosen Fuzzy AHP
methodology. Phase three also ends the study with drawing up conclusions and recommendations for the case company. The process can be visualized in figure 9 below and further descriptions will be given under each sub-heading.
Figure 9 The Research Process
3.2.1 Pre-Study - Defining the Problem Formulation
This step identifies the need for this thesis, the thesis objectives and the main data collection methods are planned. The goal of the thesis was drawn up so that the focal research questions would not have been answered before or answered satisfyingly (Sansone et al., 2017).The goal together with thesis expectations was planned and discussed in several meetings and group discussions with the tutors at the case company to gain insightful data and to validate that the thesis would conclude in what was expected. The need for the research along with background information was conducted in the introduction chapter. Furthermore, the pre-study consisted of planning the literature review and the methodology choices process.
3.2.2 Company info
After defining the problem formulation, Gemba walks were conducted on the case company assembly system of large robots to receive an overall understanding of the current company assembly system.
23
3.2.3 Literature Review and construction of Theoretical Framework
The literature review process started with identifying appropriate search terms and keywords for the article search, based on the research aim and research questions. The search words and key terms can be visualized in table 1 below. Since there is no clear definition of the “plant layout” concept, several keywords needed to be used, together with more precise keywords to get deeper information about each category. The search concluded in 393 scientific articles found that was screened and then the snowballing methodology was used for further information collection about layout design, attribute selection and attribute analysing for decision making.
The appropriate search terms were hard to find, leading to synonyms being used in the search. All search words can be seen in table 1 below. For the search, the main search area of facility layout problem was combined with at least one of the sub areas.
Table 1 Search terms
Main search
area
Facility layout
problem
Process layout
Cellular layout
Product layout
Plant layout
Process layout
Cellular layout
Product layout
Search terms
used
Facility layout
Process flow
Cellular flow
Product flow
Production flow
Manufacturing
layout
Assembly layout
The following search string was used and saved in order to ensure the validity of the search process in the same data bases as used for the mentioned search terms in table 1.
• TITLE-ABS-KEY ("Plant layout" OR "production layout" OR "facility layout" OR "production flow" OR "manufacturing layout" OR "Assembly layout" AND "Process layout" OR "Process flow" OR "cellular manufacturing" OR "cellular layout" OR "Cellular flow" OR "product layout" OR "product flow" AND ( LIMIT-TO ( SRCTYPE , "j" ) OR LIMIT-TO ( SRCTYPE , "p" ) ) AND ( LIMIT-TO ( SUBJAREA , "ENGI" ) OR LIMIT-TO ( SUBJAREA , "DECI" ) ) AND ( LIMIT-TO ( PUBYEAR , 2020 ) OR LIMIT-TO ( PUBYEAR , 2019 ) OR LIMIT-TO ( PUBYEAR , 2018 ) OR LIMIT-TO ( PUBYEAR , 2017 ) OR LIMIT-TO ( PUBYEAR , 2016 ) )
24
The data base search was conducted during 2020 and since the aim of the thesis was to evaluate state of the art information about the different layouts, the papers were limited to the last 5 years, being 2016-2020. Furthermore, the search was limited to the subject areas of engineering and decision sciences, the document types were limited to only journals or conference proceedings and lastly only papers written in English were reviewed. These limitations, inclusions and exclusions criterias can be visualized in table 2 below.
Table 2 Literature study search limitations
Delimitations Explanation
Subject area
Time
Document type
Language
Engineering, Decision Sciences
2016-2020
Journal or Conference Proceedings
English
This first screening stage limited the articles to articles with relevance to the keywords by reading through all the titles. The second screening stage consisted of reading the abstracts of the selected articles to further analyse their relevance for this study. The third screening stage consisted of reading through the articles that were selected in the second step. These three screening steps can be visualized in table 3 below.
Table 3 Screening stages
Screening stage Description
Stage 1. Title screening
Stage 2. Abstract reading
Stage 3. Full text reading
If the title seams relevant for the search terms.
If the chosen articles seam relevant for the
search words
If the article is relevant for the study, it is
selected for the empirical findings.
Three databases were used in the literature search, Scopus, Mälardalens University’s library database and google scholar. Scopus was the primarily data used since it is comprehensive, frequently updated, unbiased and reliable. Google scholar and Mälardalens University’s library was used for variation and possible new articles.