IMPACT STUDY:PHOTOVOLTAIC
DISTRIBUTED GENERTAION ON
POWER SYSTEM
SMRUTIREKHA SAHOO
The School of Business, Society and Engineering Course: Degree Project
Course Code: ERA401 Subject: Energy Technology Credits: 30.0 hp
Program: [Master Programme in Sustainable Energy System ]
Supervisor: [Maher Azaza, EST, MDH] Examiner: [Fredrik Wallin, EST, MDH] Company Supervisor: [Johanna Rosenlind, Mälarenergi Elnät AB]
Datum: [2016-06-15] E-post:
ABSTRACT
The grid-connected photo-voltaic (PV) system is one of the most promising renewable energy solutions which offers many benefits to both the end user and the utility network and thus it has gained the popularity over the last few decades. However, due to the very nature of its invariability and weather dependencies, the large scale integration of this type of distributed generation has created challenges for the network operator while maintaining the quality of the power supply and also for reliable and safe operations of the grids. In this study, the behavioral impact of large scale PV system integration which are both steady and dynamic in nature was studied. An aggregate PV model suited to study the impacts was built using MATLAB/Simulink. The integration impacts of PV power to existing grids were studied with focus on the low voltage residential distribution grids of Mälarenergi Elnät AB (10/0.4 kV). The steady state impacts were related to voltage profile, network loss. It was found that the PV generation at the load end undisputedly improves the voltage profile of the grid especially for the load buses which are situated at farther end of the grid. Further, with regard to the overvoltage issue, which is generally a concern during the low load demand period it was concluded that, at a 50% PV penetration level, the voltage level for the load buses is within the limit of 103% as prescribed by the regulator excepting for few load buses. The voltage level for load buses which deviate from the regulatory requirement are located at distance of 1200 meter or further away from the substation. The dynamic impact studied were for voltage unbalancing in the grid, which was found to have greater impact at the load buses which is located farther compared to a bus located nearer to the substation. With respect to impact study related to introduction of harmonics to the grid due to PV system integration, it was found that amount of harmonic content which was measured as total harmonic distortion (THD) multiplies with integration of more number of PV system. For a 50 % penetration level of PV, the introduced harmonics into the representative network is very minimal. Also, it was observed from the simulation study that THD content are be less when the grid operates at low load condition with high solar irradiance compared to lower irradiance and high load condition.
Keywords:
DC-AC inverter, DC-DC boost converter, Dynamic PV model, Grid-connected PV system, Harmonic distortion, LV grid-modelling, Overvoltage, THD, Voltage unbalancing, VSI
PREFACE
This thesis is the final part of the Master’s in Sustainable Energy System Programme. The work is carried out in association with Mälarenergi Elnät AB and Future Energy Centre at Mälardalen University in Västerås. This study would not have been completed without the aid of guidance, facility, encouragement from different persons and organizations. This brings me opportunity to thank everyone who were involved in supporting me with this work with their insightful thoughts and ideas.
Foremost, I would like to express my special appreciation to my supervisor Dr. Maher Azaza, researcher at the Department of EST, Mälardalen Högskola (MDH). I would like to thank him for encouraging with my research work and for his valuable comments.
My sincere gratitude for my examiner Dr. Fredrik Wallin at MDH for his insightful comments which enabled me assessing my work and make necessary correction in the report.
I would also like to thank my supervisor at Mälarenergi Elnät AB, Dr. Johanna Rosenlind for giving me this opportunity to work with her and get ideas of the research from various meetings, also from a pool of researchers and for her supervision during the work.
I would also like to show my special gratitude for Mr. Anders Malmquist for letting me understand the Mälarenergi Elnät and for all round support during my work at Mälarenergi Elnät AB.
My fellow colleagues at Mälarenergi, Mr. Patrik Zettroström and Mr. Svante Monie deserve special appreciation for behaving as literal encyclopedia for me during the thesis work. I literally banked on them for understanding the Swedish grid and end consumers.
A special thanks to Dr. Subrat Kumar Sahoo, my husband and best friend for his continuous support and for the help in understanding all nitty-gritty involved in Simulink.
SUMMARY
Grid connected photo-voltaic (PV) generation has emerged as the main stream of renewable energy source during the past years. However, these kind of generation are un-dispatchable due to the natural variability. The PV system are connected to the grid with many intermediate level of conversion and those are basically electronic components with non-linear characteristics. Furthermore, most of the new PV generation has been installed in the distribution grid as distributed generation, connected at the load end of the network and have customer oriented characteristics. These kind of grid connected PV system installation has given rise to problems concerning the power quality issues of the grid. Network operators are preparing themselves for upgrading and strengthening the grid to be able to integrate and manage more of this renewable electricity source in their systems. In the above backdrop, this thesis work is an attempt to investigate the impacts of the PV integration on the low voltage side network of the grid.
The impacts of PV system are both of steady and dynamic in nature. Hence, different modelling techniques are required to study the different kinds of impact. An aggregate model of grid-connected PV system was built for this purpose and was used for simulating the integration of PV generation on a large-scale to the modelled LV grid to study the steady state and dynamic impacts. A representative low voltage residential distribution system feeder of Mälarenergi Elnät was selected to study the steady state impacts related to overvoltage, voltage improvement and loss reductions. The representative grid network model was built using components/library from Simscape Power System tool of MATLAB/Simulink. The grid operates at nominal three phase line to line voltage of 400 V, supplied from 500 kVA 11/0.4 kV distribution transformer. The network comprises 16 number of distribution feeder nodes as load buses and the load for those distribution feeders were modelled as lump load. The integration of PV generator is done at each such feeder nodes.
The study approached the integration impacts by comparison method of the distribution grids without PV generation integrated and with PV generation integrated for peak (maximum) load and low (minimum) load conditions and with different level of solar irradiance. The PV generator functions at unitary power factor, hence produces only active power. The overvoltage issues were checked for minimum load condition with high irradiance and the voltage improvement was checked for maximum load condition with a lower level of irradiance. The impacts study revealed that integration of solar PV generation for the distribution grids in general caused an increase in voltage profile, decrease in voltage drop and losses. Further, it was learnt that the overvoltage which occurred during the low load condition is within the limit allowed by regulator (except for few nodes at far end), whereas, the same PV system generation from a low level of irradiance helped in improving voltage at the time of peak load condition. Further, a dynamic model of PV system suitable for studying its interactions with the grid system was developed using the MATLAB/Simulink tool. The modelling involved a detailed model of PV systems with inverter interface and with the control blocks. The model was simulated for getting electrical characteristic of photo-voltaic generation with the dynamic response of the system to rapid changes in irradiance and temperature. The harmonic impacts were studied for maximum load and minimum load condition. The harmonic content was
found less for the minimum load condition. The voltage unbalancing which is a phenomenon due to uneven distribution of load and solar installation among the three phases of network supply system was found to be prominent to the far end load buses compared to the load buses near to substation.
1 INTRODUCTION ...1 1.1 Background ... 2 1.2 Research Question ... 2 1.3 Purpose ... 3 1.4 Delimitation ... 3 1.5 Method ... 4 1.6 Report outline ... 5
2 GRID CONNECTED PV SYSTEM CHARACTERSTICS, CHALLENGES AND TREND .6 2.1 Global solar irradiation in Sweden ... 6
2.2 Solar policy framework in Sweden ... 6
2.3 PV installation trend in Sweden ... 7
2.4 Power Quality Regulation Standard ... 8
2.5 Challenges of grid-connected PV system ... 9
2.5.1 Interference with Voltage regulation ...10
2.5.2 Overvoltage and Losses ...10
2.5.3 Voltage unbalancing ...11
2.5.4 Harmonic Distortion ...11
2.5.5 Voltage stability ...12
2.6 Inverters’ Reactive Power Support ...13
3 COMPONENTS OF GRID CONNECTED PV SYSTEM ... 16
3.1 Photovoltaic cell electrical characteristics ...17
3.2 DC-DC converter and maximum power point tracking (MPPT) controller ...19
3.3 DC-AC inverter ...21
3.4 Filter circuit ...23
3.5 Instantaneous p-q theory, Clarke and Park transformation ...23
3.5.1 Stationary reference frame (Clarke transform) ...24
3.5.2 Synchronous/Rotating reference frame (Park transform) ...26
3.6 Grid synchronisation ...28
3.8 Voltage regulation, Load flow ...30
4 MODELLING OF GRID-CONNECTED PV SYSTEM AND THE DISTRIBUTION NETWORK ... 32
4.1 PV array modeling ...33
4.2 DC-DC converter and MPPT control algorithm ...39
4.3 DC-AC inverter and control system ...43
4.4 Distribution network modelling ...50
4.4.1 Grid source ...51
4.4.2 Low voltage distribution network ...51
4.4.3 Load profile ...52
5 RESULT ... 57
5.1 Overvoltage impact ...57
5.2 Voltage unbalancing impact ...60
5.3 Harmonic distortion impact ...62
6 DISCUSSION... 66
7 CONCLUSION ... 67
8 FUTURE WORK ... 68
REFERENCES ... 70
APPENDIX A: MATLAB SCRIPT FOR PV MODULE MODELLING ...1
LIST OF FIGURES
Figure 1: PV Installation Trend during past 12 years (Lindahl, 2014)... 8
Figure 2: P-Q capability of 10 kVA Inverter (Ravi Bhatt, August 2011) ... 15
Figure 3: Effect of Inverter size on the reactive power capability...16
Figure 4: Grid-connected PV system blocks ... 17
Figure 5: I-V characteristic for PV Module (Marcelo Gradella Villalva, MAY 2009) ... 18
Figure 6: Temperature Dependence of Open Circuit Voltage (Marcelo Gradella Villalva, MAY 2009) ... 18
Figure 7: Flow Chart of P&O Algorithm ... 20
Figure 8: Transformation from abc to αβ0 (Clarke Transformation) (Evju, June 2007) ... 25
Figure 9: αβ to dq transformation using Park transformation (Evju, June 2007) ... 27
Figure 10: A basic circuit of PLL ... 29
Figure 11: Schematic block diagram of PLL (Evju, June 2007) ... 29
Figure 12: Representative Two Node Grid ... 31
Figure 13: Voltage Profile along the feeder from sending end node to receiving end node (Mulenga, 2015) ... 32
Figure 14: Five Parameter Single Diode Model ... 34
Figure 15: Block Diagram of the PV Model in Simulink ... 36
Figure 16: PV Model in Subsystem ... 36
Figure 17: Characteristic I-V Curve under different Temperature ... 37
Figure 18: Characteristic I-V Curve under different Irradiation ... 38
Figure 19: Characteristic P-V Curve under different Temperature ... 38
Figure 20: Characteristic P-V Curve under different Irradiation ... 39
Figure 21: Schematic Diagram of Boost Converter ... 40
Figure 22: Simulation schematic of boost topology ...41
Figure 23: Simulation Results of the boost converter with control algorithm ... 42
Figure 24: Schematic block Diagram of Voltage Controller ... 44
Figure 25: Photovoltaic Output characteristics ... 46
Figure 26: DC Link Voltage vrs. Modulation Index ... 47
Figure 27: Voltage Source Inverter and Grid reference Output... 48
Figure 28: THD at 0.5 second time of operation ... 49
Figure 29: THD after 2 second of operation ... 50
Figure 30: Schematic Diagram of the representative Mälarenergi Elnät LV grid ... 52
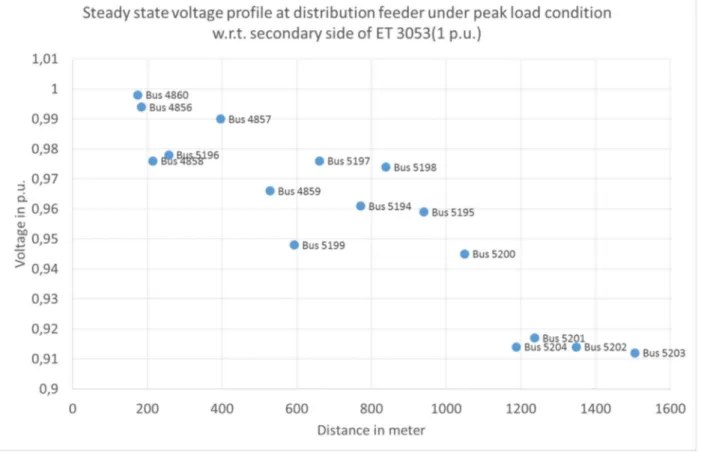
Figure 31: Voltage profile for load buses for peak load condition ... 56
Figure 32: Voltage profile for the load buses for low load condition ... 57
Figure 33: Voltage Profile at distribution feeder for Case I ... 59
Figure 34: Voltage profile at distribution feeder for case-II ... 59
Figure 35: Overvoltage at minimum load condition with PV Integration ... 60
Figure 36: Voltage sequence at node 5196 before PV integration ...61
Figure 37: Voltage sequence at node 5196 after PV Integration ...61
Figure 38: Voltage sequence at node 5200 before PV Integration ... 62
Figure 39: Voltage sequence at node 5200 after PV Integration ... 62
Figure 40: THD at maximum load condition at 400 V side ... 63
Figure 42: THD for minimum load condition at 400V ... 65
Figure 43: THD at minimum load condition at 11 kV ... 66
LIST OF TABLES
Table 1: Manufacturing Datasheet of PV Model ... 37Table 2: Design Parameter for Boost Converter ... 42
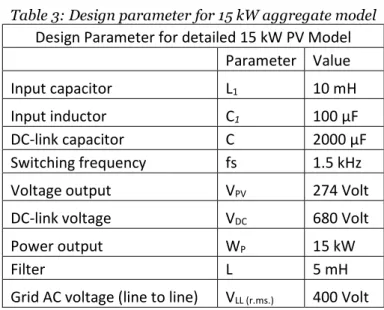
Table 3: Design Parameter for 15 kW aggregate model ... 45
Table 4: Typical Consumption data for Residential Houses in Scandinavian countries ... 53
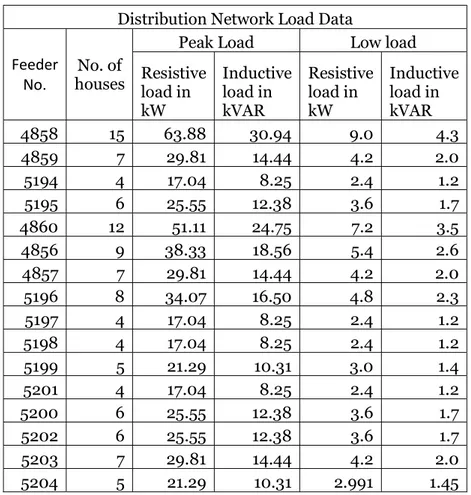
Table 5: Load data for distribution feeders ... 55
NOMENCLATURE
Description Unit Indication
Current Ampere I
Voltage Volt V
Active Power Watt P
Reactive Power Volt Ampere Reactive Q
Apparent Power Volt Ampere S
Short Circuit Current Ampere Open Circuit Voltage Volt Rated Capacity Watt Peak Current at Maximum Power Point Ampere Voltage at Maximum Power Point Volt PV Current Output Ampere PV Voltage Output Volt
Resistance Ohm R
Inductance Henry H
Capacitance Farad F
DC-link Voltage Volt
Irradiance Watt/m^2 W/m^2
Energy Watthour Whr
ACRONYMS
AC Alternate Current
AM Air Mass
ANN Artificial Neural Network
CC Current Control
CSI Current Source Inverter
DC Direct Current
DG Distributed Generation
DSO Distribution System Operator DSTATCOM Distribution Static Compensator DVR Dynamic Voltage Restorer
EN European Network
EU European Union
FFT Fast Fourier Transform GHI Global Horizontal Irradiance GTI Global Tilted Irradiance
IC Incremental Conductance
IGBT Insulated Gate Bipolar Thyristor
LTC Load Tap Changer
LV Low Voltage
LVRT Low Voltage Ride Through
MOSFET Metal Oxide Semiconductor Field Effect Transistor MPPT Maximum Power Point Tracking
MV Medium Voltage
PCC Point of Common Coupling PCS Power Conditioning System
PF Power Flow
PI Proportional Integral
P&O Perturb and Observe
PV Photo-voltaic
PVDG Photo-voltaic Distributed Generation
PQ Power Quality
PWM Pulse Width Modulation
RES Renewable Energy Source
STC Standard Test Condition THD Total Harmonic Distortion
VC Voltage Control
VU Voltage Unbalancing
1 INTRODUCTION
Environmental consciousness lead to adoption to a sustainable way of producing energy. This is a probable way towards combating the global climate issues. In the era of sustainable energy for all, renewables have entered the mainstream. Among various renewable energy sources (RES), the photo-voltaic (PV) market across the globe has seen steady growth during the past 15 years and is also expected to grow in the future years (REN21, 2015). With an installed capacity of 36.2 Mega Watt peak (MWp) during 2014, PV installation rate in Sweden showed 100% increase over the installation rate during the year 2013. In Sweden, the PV integration is enjoying strong growth rate in recent years because of a growing interest in technology, falling system prices and the direct capital subsidy grant which is effective from the year 2006 (Lindahl, 2014). Such installations help in reducing the losses and improving the voltage profile of the network by supplying the load at the consumer point (Sam KoohiKamali, 2010). Despite its promising success, PV penetration presents potential challenges when connected to the distribution network. The most important characteristic of these PVs is that their output power being fed to the grid is not controlled and is dependent on the instantaneous power from the Sun. Also PV system when integrated to the grid, introduces various interfacing devices with non-linear characteristics.
In conventional power system configuration, generations are located centrally with a corollary that the flow of power is from generation through transmission and distribution network to the end user. The normal direction of power flow is radial/un-directional i.e. from the source (substation) towards the load (customers) in any part of the grid. The power flow causes the voltages to drop through the network from the supply end to the receiving end. On the contrary, the PV installation, referred to as distributed generation (DG), are geographically distributed, of smaller capacity, connected to medium voltage (MV)/low voltage (LV) distribution grid and are usually located closer to the load. The random distributed integration of PV at the distribution side of the power system, creates meshed flow of power in the network.
The potential problem and challenges associated with PV integration can be power quality (PQ) issues such as voltage rise, voltage fluctuation and flickering, voltage unbalancing, voltage instability, current harmonics, voltage harmonics, etc. or the issues affecting the normal operation of power system like load/frequency control, load following, de-sensitization or mal-functioning of protection equipment, overloading of cable and transformers, increase of losses of power lines, interaction with load tap changer (LTC), line voltage regulators or capacitor banks, etc. (M. Karimi, 2016). These issues are barriers that limit the penetration of PV distributed generations (PVDGs) into the power system. The issues very much vary depending on the level of penetration, voltage level at the connection point, grid parameters (capacity and topology), the characteristics of load etc. (Nadeeshani Jayasekara, 2010), (Aldo Canova, 2009), (Minas Patsalides, 2016), (M. Chidi, July 2012),(Jaan Niitsoo, 2015). As the use of solar photo-voltaic continues to expand, concern about its potential impact on the operation of the
electricity grid grow as well. For seamless integration of PV penetration in the power system, its impact on the distribution system has to be addressed in a right manner. Distribution system operators (DSOs) should be prepared to integrate and manage more of this kind of DG into the system.
1.1 Background
In Sweden, the power sector was deregulated in 1996. The objective of deregulation was to make the power sector market more competitive and to give the boost to sustainable source of generation and exposition of the existing network. Under deregulated framework, the DSOs are responsible for planning and operation of their network while fulfilling certain PQ regulation (Huang Yalin, June 2013) . Deregulation of the power market has caused the increased share of renewable energy sources in the generation mix. This had become the prime driver for the transition in the way distribution networks are planned, managed and operated from the past. Small scale renewable distributed generation units are making a way towards the power system network and replacing the large conventional production units. More distributed generation introduced in the distribution network means more dynamic power flows in to the distribution system. In the above backdrop, power systems of the future will most likely be more complex than they have been in the past (Vattenfall, 2007). The DSOs need safe and reliable operation guideline to get through such installations. In the current scenario in Sweden, the residential PV installations do not need to meet any technical standards for the grid integration. However, the DSO must adhere to certain standard as per the prevalent regulation when supplying electric power to the customers. The deployment of PV technology in local distribution grids is usually done in an unplanned way without performing the required studies and this may induce PQ issues. Significant increase in installation of grid-connected PV system which has called for better understanding of those systems. In order to better understand the interaction mechanism between PV integration, and power system and solve these problems modelling of PVDG system and simulation study integrating those models to the existing operational grid is a need. Building accurate models of PV system make possible the evaluation of their behavior in the context of the full network and also lead to the development of appropriate solutions.
1.2 Research Question
Onset of steady growth in penetration rate of PVDG system over the years and the impact associated with it on the power system network, is reason for concern among researchers around the world. Various studies have been conducted to quantify the impacts. These are pertaining to PQ issues and other operational aspects.
This work would include primary research of:
1. What are the typical impacts of large scale PV integration on the network, and the associated challenges faced by DSO while maintaining the quality of the power supply?
2. What are the modelling requirements for analysing the impact of the PV system in to the grid?
To answer the above questions, the present study will assess the impact of PV penetration on one of the representative network the LV distribution system of Mälarenergi Elnät. The impacts can be both of steady state and dynamic in nature. Suitable models for the grid-connected PV system needs to be built in order to reflect the PV power output for Swedish weather condition and for the dynamics introduced in the network due to the introduction of power electronics.
Appropriate analysis tools are required to check distribution networks operating conditions in the evolving scenario. For example, power flow (PF) calculations are typically needed to assess the allowed PVDG penetration level for a given network in order to ensure that voltage and current limits are not exceeded. The power quality issues that would be subject of interest for this study is pertaining to voltage rise, voltage unbalancing, harmonics in the systems in particular.
1.3 Purpose
The work aims to be done in association with Mälarenergi Elnät AB and Mälardalen Högskola as thesis work for Master’s Programme in Sustainable Energy System. The focus of the project is to understand the behavioral impact of large scale PV integration for different operating condition of distribution grid. The work would include:
A literature review in combination with simulations in order to answer the research questions. A standardized model of grid connected PV module capable to capture the actual functional
characteristics of a PV system
Understanding the problems related to power quality especially overvoltage and harmonics, voltage unbalancing for different scenarios by way of building suitable model for PV system and distribution grid.
1.4 Delimitation
The following limitations are involved for this thesis work:
The component parameter selection involved in the modelling of the PV system is purely for simulation study. Hence, the selection is not optimized for cost, efficiency and sizing.
The grid network modelling only considers bulk load modelling and bulk solar generation in the LV distribution networks at point of common coupling. It doesn’t include the house level feeder modelling.
For studying the unbalancing impact, only few of the distribution feeder node has been simulated, one near to the substation and another farther to substation to see the difference in impact.
The loads used for simulation are constant active and reactive power (PQ) load without any non-linear characteristics, hence do not represent the dynamics of loads as per real scenario. Further, due to limited time available for thesis, some assumption were made regarding the maximum load and minimum load demand of the network, which can be avoided with good resource of database.
The loads considered assumed to be equally distributed among the three phases, which could not be the case for real scenario.
The impact study was only limited to PV penetration level of 50%.
1.5 Method
The proposed work scope under the thesis will contribute in two parts.
The first part of the work would deal with the grid-connected PV system modelling. A literature study pertaining to commonly accepted impacts on the network related to distributed PV integration and the study of the relevant power system standards under European Union (EU) or Swedish regulatory framework pertaining to solar integration would be carried to understand the modelling requirement. The modelling work would be for introducing the main components for PV system and the required controller schemes. The PV modelling part in general focus on the two main conversion parts of a PV generation. The direct current (DC) side consists of PV modules to derive the DC current out of the sun irradiation. The PV system then interfaces the alternate current (AC) network via an inverter. The DC side of the system is equipped with the controllers such as maximum power point tracking (MPPT) or active power control. The control facilities, implemented on the DC side, are mainly focuses on regulation of the output DC voltage of the generator depending on the requirements of the system. The impact of the PV system on the grid operation are provided by extra controllers installed on the AC side. The AC side controllers would be designed considering the PV system dynamic contribution on the grid. The modelling would be performed in Simulink/Simscape Power System tool of MATLAB.
The second part of the work would deal with the analysis impact of PV on power system. The representative grid from Mälarenergi Elnät would be used for study. In order to design a model of a grid, and to carry power flow calculations, power system simulations based tool of MATLAB will be used. Concerning the network, a single line will be simulated in order to evaluate the impacts.
The PV system would be modelled as a constant power generator working with unity power factor (regulated with zero reactive) and would be simulated with a representative distribution feeder model without various typical voltage support equipment. Some power flow simulation will be performed in order to evaluate the influence of connecting multiple of PV systems in a limited residential area. The measuring parameters are feeder voltage profile, the active and reactive power flows, phase voltages and phase angle. Also, the study would include the integration of dynamic PV model, which would show the impacts pertaining to voltage unbalancing and total harmonic distortion.
1.6 Report outline
The report is organized as follows.
In chapter 2, the solar installation trend in Sweden, pertaining regulatory framework and support measures with respect to solar installation has been detailed. A detailed literature study with respect to various impacts and challenges involved with grid-connected PV integration was carried in order to understand the challenges, technical requirements and demands from the power system operator associated with the integration of PV generation. The technical capabilities of inverters relevant to feeder voltage control are also presented. Chapter 3 introduces analysis approach, discusses modelling requirements, and the concepts of literature that is in line to the subject of integrating PV system to an existing grid. It defines the functionally of individual components and its associated control blocks and the basic concept for designing and selection of the components of grid connected PV system. It also discusses some basic operation of the low voltage distribution network system.
Chapter 4 is dedicated to explain the modelling details of the grid connected PV system. The modelling methodology of the system is divided into five subsystems, for PV module, DC-DC boost converter, DC-AC inverter, the control system blocks and the low voltage grid modelling. The criteria for selection of the relevant subsystem, both internal and external controllers explained based on illustrating parameter definition methods. Finally, the PV system performance based on the external grid operation is presented.
Chapter 5 analyzes the steady state and dynamic impact of the PV integration under different scenarios (maximum load condition and minimum load condition) for different irradiance level.
Chapter 6&7 contents comparison of simulation results from the study with reference to the literature study and summary of the conclusion of this thesis work ending the report.
Chapter 8 contents some thought on the possible future work leading to more development regarding this work.
2 GRID CONNECTED PV SYSTEM CHARACTERSTICS,
CHALLENGES AND TREND
This chapter presents a background of the solar irradiance data followed by a short description of the current installation trend of grid-connected PV systems in Sweden over the past years. It includes a study of Swedish regulatory framework and pertaining support measures in facilitation of PV integration in Sweden. The chapter also includes briefing of the challenges associated with grid-connected PV system based on studies that have been attempted in various parts of the world. Also, the literature study includes a brief overview of possible mitigation strategies for different such kind of issues.
2.1 Global solar irradiation in Sweden
Global irradiance or more specifically global horizontal irradiance (GHI) or global tilted irradiance (GTI) is the measured incident radiation power per unit area, and reported in units of Watt/square meter (W/m²). By integrating over time it is the total radiation energy per unit area for a specified period, such as hours, days, months or years. This quantity is designated global irradiation and the monthly and annual values indicated are given in kWh/m² or Mega Joule (MJ)/m2 (1 kWh/m2 = 3.6 MJ/m²). Often, however, the term global radiation as a general expression is used for both global irradiance (GHI and GTI) and global irradiation. However, in this case it should be clearly indicated whether it is instantaneous or average values of GHI or if it is accumulated values (Skalík, et al., February 2016).
The total amount of solar radiation received by a horizontal (ground) surface is called the global diffused radiation from the rest of the sky and the ground i.e. scattered by atmospheric molecules and particles or reflected by clouds. The solar radiation therefore depends on the weather, on the position on the globe and the season of the year. Sweden has a lower solar radiation than in many countries farther to the south, since the maximum insolation angle is only 58 degrees in the far south. Average global solar radiation in Sweden was about but still received 980 kWh/m2 in 2014, which was a little bit less sunny year in Sweden compared with the record year of 2013 of 1000 kWh/m² (IEA-PVPS, 2014).
2.2 Solar policy framework in Sweden
In Sweden, the integration of PV system comes ambit certain regulations. As per Electricity Act, renewable energy is not given priority dispatch. Every kind of electricity has guaranteed access to the electricity grid, and all electricity fed into the grid must be transmitted and distributed. Besides, there is no obligation to purchase electricity generated from renewable energy sources (RES). The main support scheme for RES-E is a quota system. A direct capital subsidy for installation of grid connected PV systems that have been active in Sweden since 2009. Self-consumption through net-metering is offered by some local utilities since 2014.
Additionally, a tradable green certificates scheme exists since 2003, but only around 12% of PV installations are using it so far, because of the insufficient level of support for PV installations. Another example is green certificates, which was introduced in Sweden in 2003. Production resources being classified as renewable then also produce a financial instrument, a green certificate, for each Mega Watthour (MWh) of production. The consumers are mandated to buy green certificates representing a specified share of their electricity consumption. The green certificates are traded on a market and the owners of renewable power plants get revenues also for the green certificates. Thereby they get an increased economic incentive to invest in renewable energy production
2.3 PV installation trend in Sweden
Historically, the Swedish PV market was majorly consisted of a small but stable off-grid market. This domestic off-grid market is still stable and is growing slightly. However, in the last seven years, more grid-connected capacity than off-grid capacity has been installed and as a result connected PV largely outscores off-grid systems across the Europe. The grid-connected market is almost exclusively made up of roof mounted systems installed by private persons or companies. Now talking about in Sweden context, in 2012, and in the same way as in many European countries, the large increase of installed systems occurred within the segment of grid-connected systems. Around 18 Megawatt (MW) were installed in 2013. PV installation rate in Sweden during 2014 showed 100% increase over the installation rate during year 2013 (refer Figure 1) (Lindahl, 2014). A total of 36.2 Megawatt peak (MWp) were installed under 2014, which is almost twice as much as the 19.1 MWp installed under 2013. Historically, Sweden has a stable off-grid PV market, however in recent years, the market for grid-connected PV systems has grown rapidly with an installation of 35.1 MWp in total of 36.2 MW during the year 2014. Private persons and companies contributed to doubling the overall grid connected PV capacity in Sweden. The strong growth in recent years is attributed to falling system prices and a growing interest in PV in Sweden. The report (Lindahl, 2014)states that typical prices for a turnkey residential system has declined from an average of approximately 17 SEK/Wp (excluding VAT) in late 2013, to just over SEK 15/Wp by the end of 2014. For large commercial systems over 20 kWp the average price was about 13 SEK/Wp at the end of 2014. The explanatory reason for the system prices in Sweden have gone down is that the prices for modules and balance of system (BoS) equipment has dropped in the international market. Another reason is that the Swedish market is growing, providing the installation firms a steadier flow of orders and an opportunity to streamline the installation process, thus reduce both labor and the cost margins, and competitive market for business of PV system installation (ibid.).
Figure 1: PV Installation Trend during past 12 years (Lindahl, 2014)
2.4 Power Quality Regulation Standard
As explained in the above sections, amongst many sources of RES, the PVDG installation are seeing an upward surge in recent years, with DSOs foreseeing this as a way to expand further, in future. The reason being the ever declining economy of PV system, improvement in PV technology and electronics over the years and support from various incentive schemes. Consequently, DSOs are facing with the challenges of maintaining the allowable levels as per regulatory standards. Some of these standards are the requirements to PQ at the delivery point, e.g. voltage limits: maintenance of the voltage at the point of delivery to each customer within an acceptable range, voltage fluctuations, interruptions and harmonics etc. (EN50160, 2004). The highest penetration of PV system including production, installation and integration, has been established in Germany, Spain and Italy (Lindahl, 2014). Each of those countries has been following their own national grid codes. However, all European countries are recommended to satisfy the EU standards, EN 50160: Voltage characteristics of electricity supplied by public distribution systems.
As per Grid Code EN 50610 framework, attributes which define power quality include:
• Voltage regulation refers to the maintenance of the voltage at the point of delivery to each customer within an acceptable range.
• Flicker defines the repetitive and rapid changes of voltage, which has the effect of causing unacceptable variations in light output and other effects on power consumers and their equipment.
• Voltage imbalance referring to the grid voltage does not having identical voltage magnitude on each phase, and a 120 ° phase separation between each pair of phases.
• Harmonic distortion means the injection of currents having frequency components which are multiples of the fundamental frequency.
• Direct current injection— A situation which can cause saturation and heating of transformers and motors, and can also cause these passive devices to produce unacceptable harmonic currents.
As per Grid Code EN 50610, the following requirements are general:
• Voltage unbalance for three-phase inverters: max. 3% • Voltage amplitude variations: max. ±10%
• Frequency variations: max. ±1% • Voltage dips: duration <1s, deep <60%
German grid code is found to be the most updated one. Hence it has been used as the reference code to satisfy the grid requirement in various studies. Previous to 2009, as per German grid code, PV generators were not being allowed to stay connected to the system during grid disturbances. They could not therefore participate in the system improvement during a fault condition. Today, due to the increasing penetration of PV systems, they have to meet required technical specifications such as Low Voltage Ride Through (LVRT) in order to ensure the stability of the system. By LVRT capability, one means that an electric system would remain connected to the grid in case of any temporary voltage drops or load changes. They should not only be able to stay connected to the grid during a disturbance, but also support the grid through reactive power injection during steady state condition contributing to voltage control and injection of short circuit current during a fault condition (VDE, 2011).
Also, it states that admissible voltage changes during normal operation, the magnitude of the voltage change caused by the generating plants must not exceed, in any point of common coupling , a value of 3% compared with the voltage when the generating plants were not connected. The preferred method to calculate the voltage changes is using complex load-flow calculations (ibid.).
2.5 Challenges of grid-connected PV system
The potential problem and challenges associated with PV integration can be broadly grouped into two categories: PQ issues such as: voltage rise, voltage fluctuation and flickering, voltage unbalancing, voltage instability, current harmonics, voltage harmonics, etc. or the issues affecting the normal operation of power system like load/frequency control, load following, de-sensitization or mal-functioning of protection equipment, overloading of cable and transformers, increase of losses of power lines, interaction with LTC, line voltage regulators or capacitor banks, etc. Various studies have been conducted to quantify the impacts of high PV deployment pertaining to above mentioned PQ issues. The impacts were segregated as per following categories.
2.5.1 Interference with Voltage regulation
A primary objective of distribution system design is to supply customers at a voltage which is within a prescribed range. Distribution system voltage regulation design is based on relatively predictable daily and seasonal changes in loading. In general, loading on the various sections of a feeder follow relatively similar patterns. Without PVDG, power flow is always unidirectional, and monotonically decreasing in real power (kW) magnitude with increasing distance from the substation. The distribution system feeder voltage profile is designed for decreasing over the network length. In the Swedish standard, the allowable voltage drop limit between two buses is 5%, if one of the bus is a household node, while for point of common coupling (PCC) node, it is 3% (Huang Yalin, June 2013). The addition of PVDG to a system, however, can radically shift power flow patterns and make them unpredictable. Depending on the spatial relationship of loads and PVDG, power flow can increase or decrease along a feeder. Net power flow can potentially reverse over a portion of the feeder, or even over the entire feeder if PVDG production exceeds the load present at that time. These load flow variations can make it difficult to maintain adequate voltage regulation. Also, the unconventional load flow patterns can cause distribution system voltage regulation devices, such as step voltage regulators, load tap-changers, and switched capacitor banks to respond inappropriately. PV integration changes normal voltage profile due to export of excess PV power generated to the grid during the lower load demand and eventually causes the reverse power flow and overvoltage in the network (E. Liu, February 2008). Voltage regulation practice is based on radial power flows but reverse or bi-directional power flow interfere with the effectiveness of standard voltage regulation practice (NREL, August 2003), (Nadeeshani Jayasekara, 2010). 2.5.2 Overvoltage and Losses
The penetration level which is defined as the ratio of nameplate PV power rating (Wp) to the maximum load seen on the distribution feeder (Watt) is the widely used terminology defining scale of integration. The impacts on voltage rise is modest, when maximum PV penetration will be equal or less compared to the minimum load which was considered to be 25% of the maximum load on that specific feeder (Povslen, February 2002) . From the system point of view, there is more margin of feeding of PV power in to network, if the PV power penetrates from only a single LV line than from multiple LV lines connected to the same MV/LV transformer or even multiple MV/LV transformers. The most severe limit occurs in minimum load situations for any case, especially if the power system beforehand is operated to its design limits (Povslen, February 2002). PV with storage system fares better for maintaining voltage profile and in reducing voltage fluctuation (Mohammad T. Arif, October 2014). The impact and consequently threshold of penetration level depends on how sparsely PVDG and load are distributed on the feeder. For a feeder with uniformly distributed load and without fixed reactive compensation, if the DGs are lumped at the remote end of the feeder, the allowable level is about 15%. This issue of overvoltage is more significant when the DG is lumped at the end of the line, than when the DG is lumped at the beginning of the feeder. With DG distributed uniformly along the feeder, the line-rise overvoltage begins to be a significant issue when penetration exceeds 50% (NREL, August 2003). The level of losses in the system also is closely linked to the power flows and thus PVDG integration also impacts energy losses of the system.
The loss in the system shows an ‘U’ trajectory depending on the penetration level. Until certain penetration level losses in the system is reduced beyond which it increases (Víctor H., May 2006).
The voltage rise problem between two buses are limited by the Swedish standards, which says that the maximum voltage variation at PCC after the connection of a distributed generator is maximum 3%. Therefore, the PV capacity is limited by: ≤ 1.03% , where Where V is the voltage at the PCC before the connection of the PV system (Yalin Huang E. H., 2013).
2.5.3 Voltage unbalancing
Grid-connected PV systems can be attached to one or all three phases. For small-scale production, it is common with single-phase connected systems due to the price of the inverter. Feeding in current into only one phase can cause asymmetry in the grid if the attached amount of power is not equal for each phase. Voltage unbalance (VU) in the power system occurs when the magnitude of voltage among the three phases differs in amplitude or the phases deviate from each other from the normal 120-degree difference or both (P. Trichakis, 2006). As a general practice, the residential loads are equally distributed among the three phases of distribution feeders (Short, 2004). Uneven load distribution to different phases or uneven generation from single phase DGs can cause voltage unbalanced condition in the network (Mohammad T. Arif, October 2014). The rooftop PV installation by residential customers are mostly unplanned, random and not equally distributed among the phases. Combined together it creates the VU in the network. The probability of VU is more at the end of the feeder than to the beginning of nodes. Besides, the sensitivity of VU is also dependent on the characteristics of load of the phase in which the PV is installed, on the location and rating of the PVs. (Farhad Shahnia R. M., 2010). The devices such as distribution static compensator (DSTATCOM) and dynamic voltage restorer (DVR) as mitigation measure when connected to the feeder reduces VU and overvoltage issues to certain extent (Farhad Shahnia A. G., 2011).
As per EN 50160 standard, the following requirements pertaining to VU must be met by the DSOs:
Voltage unbalance for three-phase inverters: max. 3% Voltage amplitude variations: max. ±10%
2.5.4 Harmonic Distortion
Harmonic distortion is another major impact that has to be considered during the integration of PVDG systems (Rangy Sunny, December, 2013), (Mohammad T. Arif, October 2014). Harmonics are sinusoidal components of voltage or current signals with the frequency equal to an integer multiple of the fundamental frequency. The main source of harmonics currents in distribution system are non-linear loads. Harmonic currents translate into harmonic voltages through the grid impedance. The other potential cause of harmonics may be due to saturation of transformers caused by higher voltage during light load demand conditions or amplified by resonance in the utility network (Man, 2011). The harmonic voltage levels in LV
networks must be kept within the prescribed levels to ensure reliable operation of all the equipment connected in the network. The European network operators are abided as per the harmonic voltage limits specified in EN 50160. Distorted voltage and current in the distribution system can cause in undue effects in the network such as loading, over-voltages, mechanical stress in the network, unreliable operation of protection devices, and lowering the efficiency of appliances. The distortion affects also the end users fed through the PCC (Jaan Niitsoo, 2015). The major source of harmonics are the inverters with solid semiconductor switches used for conversion of DC to DC or DC to AC, injecting voltage harmonics and current harmonics to the system and thus result in power harmonics. The harmonic generation of a PV system is primarily dependent on the inverter technology, solar irradiance level, ambient temperature, load characteristics, and the supply system characteristics (Florentin Batrinu, May 2006).
As far as voltage distortion is concerned, the effect of the PV plant operation is insignificant compared to the harmonic distortion of the currents generated by the PV system (Florentin Batrinu, May 2006). The study (S.V. Swarna Kumary, 2014) showed that, both for at maximum PV generation as well as at minimum PV generation, the level of harmonics of voltage and current are high at far end feeder bus node as compared to bus node, near the distribution transformer. It can be described either as intrinsic or extrinsic effects. Intrinsic harmonic distortions are related to inverter technologies, e.g. component selection (switches) and control loop non-linearity, and limited pulse-width modulation (PWM) resolution. Connection to a weak and unbalanced electrical grid can be considered as an extrinsic effect on the output power of a PV system (Pedro A. B. Block, March 2014). While operating at low solar irradiance levels e.g. at the time of sunrise and sunset, during cloudy days, current total harmonic distortion (THD) values can increase significantly, as the THD factor is inversely proportional to the output active power of the PV system. However, THD significantly reduces with the increase in the active power output from the PV system and is least when the PV power output reaches its nominal value (Jaan Niitsoo, 2015). The THD is also less, when the PV is operates at a lower or minimum loading condition (Jaan Niitsoo, 2015). The different voltage control techniques produce different order of harmonics on the output voltage (Patil, November 2013). The standard EN50160 stipulates maximum THD level of 8% in the supply voltage. The higher the percentage, the more distortion in the voltage/current signal it creates (EN50160, 2004). 2.5.5 Voltage stability
Voltage stability is defined as the state of operation where in the all bus voltages in the grid are maintained at a steady acceptable level under normal operating conditions or under disturbances within the prescribed norm (EN50160, 2004). Voltage stability is achieved when the demand of reactive power in the network is met from the generations. The inverters without any voltage control regulation are responsible for keeping the power factor of the PV system at unity, which means that there will be no exchange of reactive power between the inverter and the grid. But in real scenario, most of the PV system consume or inject reactive power into the grid depending on the network and transformer losses, on the output active power from the PV and also the conversion technology. Withdrawal of reactive power by large scale PV system connected to a weak grid creates static voltage instability problem (Xu
Xiaoyan, April 2009). Furthermore, the uncertainty associated with PVDG, predominantly due to fast changing climatic conditions such as cloud covers or due to connection and disconnection of PV system causes fluctuation in the power output. This sudden change in the power output cause output voltage fluctuations and flicker at the end consumer point. This kind of phenomenon is referred to as voltage instability. As reported in (SANDIA Report, February 2008), voltage fluctuation caused by cloud transients was regarded to be smooth and slow and hence do not create serious voltage stability problems, with a note of caution that fluctuation might be a problem when PV penetration exceeds 20%.
2.6 Inverters’ Reactive Power Support
The existing power network or grid is an integration of multiple stages of power transmission i.e. from generation to transmission, transmission to distribution and finally to the consumer. The grid had been designed to transmit electricity generated from large centralized power plant. The direction of current flow is from high voltage level to low voltage level due to resistance and inductance of the cable. The PVDG is mostly installed near to the load point and hence connected to the distribution network of the utility grid. When such distributed generation integration increases into the distribution side of the network, power flow direction gets altered. The most likely issues associated with high penetration of PV is the voltage regulation, because it is directly correlated to the amount of reverse power flow (NREL, February 2008).
The service entrance voltage at the consumer point is most important from the DSO perspective. Most utilities use LTC transformer to regulate the substation bus voltage. Distribution transformers are available with and without no-load taps (meaning the taps are to be changed without load) with standard taps of ±2.5 and ±5. Utilities can use this feature to provide a fixed boost for customers on a circuit with low primary voltage (SANDIA Report, February 2008). Voltage control can also be achieved with devices such are voltage regulators and capacitor banks which have localized controls. These schemes work well for today’s radial circuits but they do not handle circuit reconfigurations and voltage impacts of distributed generation well, resulting in limits on the ways in which circuits can be configured and imposing important limits on the penetration of PVDG.
Many inverters have the capability of providing reactive power to the grid in addition to the active power generated by their PV cells. The PV generators that are not equipped with a voltage controller, the connected bus voltage fluctuates during periods of large change in irradiance. These fluctuations become more significant with higher penetrations of PV generation. Voltage control using the PV inverter can help reduce the voltage fluctuations caused by the changes in irradiance and tends to make system more stable following a fault (Yun Tiam Tan, June 2007). Besides, if reactive compensation of PV inverters is allowed when grid voltage at the PCC becomes too low or too high, the voltage problem can effectively be solved.
The reactive characteristic of PV station can also be changed by control the power factor at the AC side of the inverter. However, it is at the cost of reducing the output power of the inverter.
Constant power factor control of the inverter may not resolve the voltage problem practically. The detailed control information of the power factor should be calculated by practical case. . Also, reactive power compensation can be done by changing the power factor at the AC side of inverter. But this method will cause over-voltage at some level of output. How to define the power factor of the inverter should be analyzed by practical projects. The ideal way is to control the power factor dynamically and to install flexible compensation device. If the PV station integrated to grid is controlled as a voltage source, i.e., the control aim is to maintain constant voltage output at AC side of the inverter, the inverter should generate certain reactive power to adjust its output voltage. Under voltage-mode control, the inverter could generate reactive power to keep the AC voltage of the inverter constant.
When the PV station is controlled as a current source, i.e., cosϕ = 1.0 , the absorbed reactive power is always kept as zero regardless of the output. However, in practical application, PV station would absorb some reactive power because of line and transformer loss. The detailed absorbed reactive power is related to the output of the PV station. For large output power, the PV station needs a lot of reactive power and voltage instability problem may occur. When the PV station is controlled as a current source, dynamic compensation at the lower side of the transformer could improve the voltage stability. When the PV station is controlled as a voltage source, the reactive power generated or absorbed by the inverter can be adjusted to maintain the voltage at the parallel point constant. But the regulation capability is related to the capacity of the inverter and its power factor range (Xu Xiaoyan, April 2009).
Currently most inverters used for PV generators are designed to operate at unity power factor. Reactive power is neither absorbed nor produced. If PV generation is implemented on a large-scale, there is a need to make better use of the PV plant to help with voltage control. However, inverters are capable of providing reactive power along with the active power. The apparent power rating (S) of the inverter can be resolved into components of P and Q given by equation (1):
= + (1)
Depending on the inverter rating and the amount of DC power available at the input, the P-Q capability of the inverter can be determined as shown in Figure 2.
Figure 2: P-Q capability of 10 kVA Inverter (Ravi Bhatt, August 2011)
The P-Q capability is the ability of the PV system to provide active and reactive power instantaneously. An intelligent controller implemented here is responsible for generating/absorbing the maximum active power (P) and generating/absorbing the maximum reactive power (Q) that the system can handle. By means of proper switching, the inverter can be operated in a four-quadrant mode. One can refer Figure 2, that if, 8 kW is the amount of DC power available at the input ( ), then by introducing the proper phase to the output current, the inverter can deliver 6 kVAR of leading or lagging reactive power. Similarly, for power output ( ) of 4 kW i.e. when bridge is operating as active rectifier, it can deliver/absorb 9.16 kVAR. If the power at the dc bus ( ) is equal to S, then the inverter loses its reactive power capability; on the other hand, if is zero, then the inverter capacity can be dedicated to provide reactive power only. However, there are some losses associated with the inverter, and so, cannot be zero. The proper inverter size can be selected in order to provide a specific amount of voltage regulation. The normal practice is to select an inverter with S = where is the maximum active power that the inverter injects into the grid. Over-sizing the inverter just by 5% provide 32% additional capacity of reactive power as shown in the power triangle of Figure 3 (Ravi Bhatt, August 2011).
Figure 3: Effect of Inverter size on the reactive power capability
3 COMPONENTS OF GRID CONNECTED PV SYSTEM
This chapter includes literature study briefly defining various components involved in a grid-connected PV system. It includes description of the electrical characteristics PV module, presents a description of the components in a three-phase dual-stage PV system, and further discusses different algorithm and control system involved on the DC and AC side of the System. Understanding the dynamics of grid-connected PV system helps in understanding the impact on the grid system.
The output from PV module is DC and the utility grid operates in AC characterized by certain level of voltage and frequency. Often the output voltage from the PV Module is not sufficient to integrate it into the grid. Hence, connection of the PV Array to the utility grid is generally done through several intermediate levels. The conversion from DC to AC can be achieved either in single stage or dual stage (June Seok Lee, January 2013). PV system circuit topology with DC-DC converter is termed as dual stage. The building blocks of a typical PV system is shown in Figure 4. In the system, the DC output from PV system is passed through a DC-DC converter to boost up PV voltage to a level suitable to integrate to an inverter. The boosted DC voltage will interface the utility grid by means of DC-AC inverter, which is used for enforcing sinusoidal voltage waveform with matching phase frequency and voltage with that of grid. The system also contains controller which focus mainly on the DC and AC side operation of the PV system. A control mechanism is required in order to supply the desired amount of power to the grid from the PV system and to facilitate the operation of PV system at maximum efficiency.
Figure 4: Grid-connected PV system blocks
3.1 Photovoltaic cell electrical characteristics
The basic unit of a photo-voltaic (PV) system is the PV cell, which are arranged in series to form the cell series string and putting together one or more of such strings forms the PV module. A PV cell is an electrical device that converts the electrical energy of light directly into electricity. When sunlight strikes the surface of a PV cell, the PV cell generates photo current, resulting in a flow of current when the PV cell is connected to an electrical load. The PV module if many put in series is called modules string, multi-folding the voltage times the number of modules in series. Such PV module string also referred as PV array, when connected in parallel, makes the current multifold (Tao Ma, 2014).
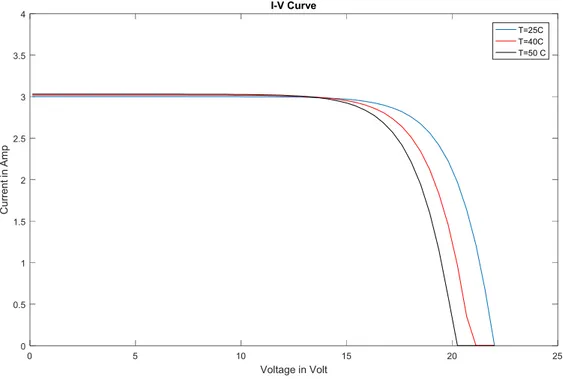
The performance of a PV module is mostly affected by PV cell configuration, irradiance, and module temperature. In order to predict the output power of the PV module it is important to understand the relationship between these effects and the power output. Short circuit current ( ), represents the maximum current flowing while the output terminals of the PV cells are short circuited. Higher levels of irradiance will cause more electrons to flow off the PV cells to the load attached hence, the short circuit current is directly proportional to the solar insolation (irradiation). However, the amount of voltage produced by the PV module is affected by the irradiance value, but the effect is very small. A typical PV module I-V curve representing the basic points such as short circuit current open circuit voltage , and the maximum power point (MPP) is presented in
Figure 5: I-V characteristic for PV Module (Marcelo Gradella Villalva, May 2009) Open circuit voltage , is the maximum voltage which provides the PV cell while its terminals are open circuited. The open circuit voltage is affected from the temperature variation which is inversely proportion to the temperature as shown in Figure 6. The voltage reduces with increase of the temperature, on the other hand the current increase with temperature, but only slightly, so the net result is a decrease in power and efficiency. (Marcelo Gradella Villalva, May 2009).
Maximum power point (MPP), is the point shown in the I-V curve where the PV cell is provided with the maximum possible electric power. The voltage of this point is called the maximum power voltage ( ) and the related current is the maximum power current ( ). The amount of maximum power is highly influenced by the level of irradiation as well as the ambient temperature of the PV. Maximum power point is one of the objective be achieved during the PV system operation.
Rated power output, is output of a PV under standard condition. Considering standard test condition (STC) categories of PV modules, standard condition is described for the following situation: G= 1000 W/m2, T= (25±2 °C, AM= 1.5 AM, where G is the vertical irradiance, T is the ambient temperature and AM indicates the air mass.
3.2 DC-DC converter and maximum power point tracking (MPPT)
controller
The relation between , produced from PV module is highly non-linear and influenced by incident solar irradiation on the module and temperature of the cell. Hence, the combination of the current and voltage that maximizes the output power changes with the atmospheric parameters. Utilization of maximum power from PV Array needs some conversion device with functionally of tracking the maximum power point (MPP) for various operating conditions. The controller is either implemented in the DC-DC converter for a PV system with dual stage conversion or in the DC-AC inverter for a single stage conversion. A DC-DC converter is a static device which converts or transfers the DC power from one circuit to another from fixed voltage to variable and vice versa. DC-DC converter also helps in regulating the PV output voltage to the required level (Evju, June 2007).
There are a number of MPPT techniques. All of these methods require an algorithm to specify the location of the operating point with respect to the maximum power point (Tan, February 2004) (Yun Tiam Tan, June 2007). MPPT will ensure that, PV modules operate in such away maximum voltage, and maximum current, of the modules will be attained and produce maximum power . There are several techniques in the literature used in order to illustrate the function of MPPT. The artificial neural network (ANN), the fuzzy-logic, perturb and observe (P&O) and incremental conductance(IC) method are examples of different applied MPPT techniques. Among all proposed strategies, the P&O method is a widely used approach in MPPT because it is simple, it requires only measurements of and , and it can track the maximum power point quite accurately through variations in irradiance and temperature. As its name indicates, the P&O method works by perturbing and observing the impact of this change on the output power of the PV array.
Figure 7Error! Reference source not found. is a flow chart of the P&O algorithm. At each cycle, and are measured to calculate ( ). The value of ( ) is compared to the value ( − 1) calculated at the previous cycle. If the output power has increased, is adjusted further in the same direction as in the previous cycle. If the output power has decreased, is perturbed in the opposite direction as in the previous cycle. is thus
perturbed at every MPPT cycle. When the maximum power point is reached, oscillates around the optimal value , . This causes a power loss that increases with the step size of
the perturbation. If this step width is large, the MPPT algorithm responds quickly to sudden changes in operating condition. On the other hand, if the step size is small the losses under stable or slowly changing conditions will be lower but the system will not be able to respond quickly to rapid changes in temperature or irradiance (Tan, February 2004).
Figure 7: Flow Chart of P&O Algorithm
In dual stage inverters, the output from the DC-DC converter is a low ripple DC voltage, as the DC-DC converter handles MPPT, boosts the voltage level (if required) and output current regulation while the DC-AC inverter switches at the grid frequency to unfold the rectified sine wave (Evju, June 2007).
Measure Vpv (k),
Ipv(k)
P(k) = Vpv (k) Ipv(k)
k=k+1
Measure Vpv (k),
Ipv(k)
P(k) = Vpv (k) Ipv(k)
P(k)-P(k-1)=0?
P(k)-P(k-1)>0?
Vpv(k)-Vpv(k-1)
>0?
Vpv(k)-Vpv(k-
1) >0?
Vpv=Vpv-∆V
Vpv=Vpv+∆V
Yes
No
Yes
No
Yes
Yes
No
No
3.3 DC-AC inverter
The DC-AC inverter connects the PV array to the utility grid. Inverter acts as bridge to transfer the DC power that produces from PV system to the grid network which operates in AC. The technical requirement from inverters are to produce good-quality sine-wave output, and to follow the frequency and voltage of the grid. The topology of the inverter varies and it depends upon the output voltage level and power level of PV array and utility grid interconnection voltage (Massawe, June 2013). The primary topology consideration is whether or not to use a single stage or dual stage conversion.
Inverter technology is the key technology to have reliable and safety grid interconnection operation of PV system. To meet with these requirements, up to date technologies of power electronics are applied for PV inverters. Two main classes of DC-AC inverters are:
Line commutated Self-commutated
Self-commutated inverters are of interest for this study. By means of high frequency switching of semiconductor devices with PWM technologies, high efficiency conversion with high power factor and low harmonic distortion power can be generated (Mohamed A. Eltawil, 2010). Most common of switchable power electronic components are design using insulated gate bipolar transistor (IGBT) or the metal oxide semiconductor field effect transistor (MOSFET). The choice of switch to be used is one of the challenges. The switching power devices possibly used in the inverter topology can be either IGBTs or MOSFETs. For high power applications and output voltage rating higher than 150V, the IGBT can be used as power device. In spite of its lower on-state voltage drop, higher power density and lower cost respect to the MOSFET, the IGBT has higher switching losses and limited switching frequency (Evju, June 2007).
Further, the grid-connected inverters for PV Array application are divided into the following categories:
Current Source Inverter (CSI), or Voltage Source Inverter (VSI).
The VSI is fed from a DC-link capacitor which is connected in parallel with PV panels, whereas CSI, the inverter is fed from a large DC-link inductor. In VSI, the DC side is connected to the DC side of the PV module. In today’s scenario, a voltage-source PWM converter is generally preferred over a current-source PWM converter. The main reason being the use of semiconductor switch IGBT, which is integrated with a free-wheeling diode, is more cost-effective in constructing the voltage source PWM converter than the current-source PWM converter. Another reason is that the DC capacitor which is indispensable for the voltage-source PWM inverter is more compact and less heavy than the DC inductor for the current-source PWM inverter (Hirofumi Akagi, 2007). Besides, VSI is the type of inverter where the independently controlled AC output is a voltage waveform. The output voltage waveform is unaffected by the load condition of the integrated network. For a dual stage PV inverter system, when voltage amplification from the PV arrays at the input capacitor is essential, then DC-AC