R Vol. eprin 25, No. t from Accid 5, pp 499-ent Anal 509, S 1993
and Preven ifeI1, UIf Bride and Jo rgen Larsson
How well do they fit? Models for predi
where pedestri
ctiIng accl er =3 &n o> =3 c. & A wl
l
dents at junctions sts are involved Nr 195 - 1993
MODELS FOR PREDICTING ACCIDENTS AT
JUNCTIONS WHERE PEDESTRIANS AND CYCLISTS
ARE INVOLVED. HOW WELL DO THEY FIT?
ULF BRUDE and JÖRGEN LARSSON
Swedish Road and Traffic Research Institute (VTI), S-581 95 Linköping, Sweden
(Received 12 May 1992)
Abstract The coef cient of determination, R2, i.e. the squared correlation coef cient between observed and tted values, is often used as a measure of how well a model predicts the number of accidents at road junctions, for instance. The purpose of this article is to show that the R2 values obtained in different studies are rarely comparable with each other and that a prediction model can be nearly perfect even if the coef cient of determination is small. Another purpose of the article is to present some results of interest from a practical viewpoint in regard to accidents where pedestrians and cyclists are involved. Empirical R2 values for models predicting accidents at junctions where pedestrians or cyclists are involved are compared with the maximal R 2 values that could possibly be obtained. The latter can be calculated both theoretically
and with the aid of simulation. How the maximal R2 value depends on the average accident level and the
relative dispersion of the expected values for the studied junctions is also shown theoretically. The results ' obtained show how difficult it can be to determine whether and how far the number of accidents is in uenced
by additional factors, over and above the traf c ows, which describe the design in greater detail.
INTRODUCTION
Several attempts have been made over the years to construct models for predicting the number of accidents at road junctions or on sections of road. Common to all the models is that they include traf c ows in some form or other. Furthermore, although the traf c ows are often estimated very roughly, they are frequently the primary factor behind acci dents, at least after a classi cation has been made according to the type ofjunction, i.e. ordinary (non-signalized) junctions, signalized junctions, round-abouts, and grade-separated junctions; or type of road, e.g. ordinary two lane roads, expressways, and motorways; and the legal speed limit.
A frequently used measure describing how good the models are is the coef cient of determination, R 2, i.e. the squared correlation coef cient between observed and tted values. Other existing goodness-of- t measures will not be treated in this paper. Oc-casionally, it is stated that a particular model is bet-ter than another in a different study, because it has a larger R 2 value. Sometimes it is stated that a model is not particularly good because its R 2 value is low, perhaps only 0.30. In some studies, the R 2 value has been calculated with individual junctions as ob-servation units, while groups of road sections make up the observation units in other studies.
499
The purpose of this article is to illustrate that a prediction model may be extremely good even if
it has a small R 2 value. The article also attempts to
show that the R 2 values obtained in different studies are not, as a rule, directly comparable with each other because of differences in the length of the observation periods, differences in the number of accidents, or differences in the dispersion of the expected number of accidents at the observation units studied. Only cases having natural individual observation units are covered here. A number of results that are of interest from a practical VieWpoint are also presented.
PREDICTION MODELS, DATA
AND METHOD
The prediction models described here relate to accidents at individual junctions where either pedes-trians or cyclists are involved.
Data has been collected from some 30 Swedish municipalities ranging from those with about 25,000 inhabitants up to the largest in the country, i.e. Go-thenburg and Stockholm. All junctions are part of the major road and street network in urban areas. Their design varies from simple, ordinary junctions to junctions with traf c signals or roundabouts. The
500 U. BRUDE and J. "LARSSON
accident data consist of accidents reported by the police from 1983 to 1988.
Only junctions with 100 or more pedestrians or 100 or more cyclists per annual average day have
been included. Counts of unprotected. road users
have generally been made on a single weekday dur-ing the sprdur-ing or autumn.
A pedestrian using two pedestrian crossings is counted twice. Similarly, a cyclist using two bicycle crossings is counted twice. On the other hand, a cyclist arriving on the carriageway is counted only once. This latter procedure is, of course, not wholly unobjectionable.
In the construction of prediction models, 285 junctions with 165 accidents have been used for acci-dents involving pedestrians, and 377 junctions with 432 accidents have been used for accidents involving cyclists. The statistical technique used was the least squares method with the aid of NLIN in the SAS
statistics program and with the accident rate as the
dependent variable. (We have also tried the GLIM procedure, with the number of accidents as the de-pendent variable, and obtained essentially the same results.)
EQUATIONS FOR THE PREDICTION
MODELS
For accidents involving pedestrians, the num ber of accidents involving pedestrians per million passing pedestrians has been obtained as
PACCRA TE =
0.0201 X TOTINCO-50 X TOTPED_0'28 (1)
where T0TINC and TOTPED are equal to the num-ber of incoming motor vehicles and passing
pedestri-ans per average annual day.
The annual number of accidents involving pe-destrians, PACCPER YEAR, is then obtained as
PACCRATE X 365 X TOTPEDl/IOÖ, i.e.
PACCPER YEAR =
0.00000734 X TOTINC 50 X TOTPEDO'72 (2) (Conversely, PACCRATE can be expressed as PACCPERYEAR/365/T0TPED1 X 106.)
The corresponding equations have been ob-tained for accidents involving cyclists:
CACCRATE =
0.0494» X TOTINC 52 X TOTCYC O' , (3)
and
CACCPER YEAR =
0.000018() X TOTINCO'52 (4) X TOTCYCO'ÖS. (4) As expected, the exponents in the equations for PACCPER YEAR and CACCPER YEAR assume values between O and 1. In both cases, the exponents for the number of unprotected road users are larger than for the number of motor vehicles.
Note that in the equations for PACCRA TE and CACCRA TE, the exponents for TOTPED and TOTCYC are negative. The exponents for TOTINC are of course positive and are the same as for PACCPER YEAR and CACCPER YEAR.
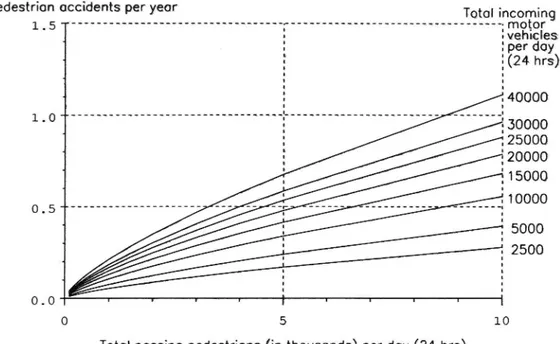
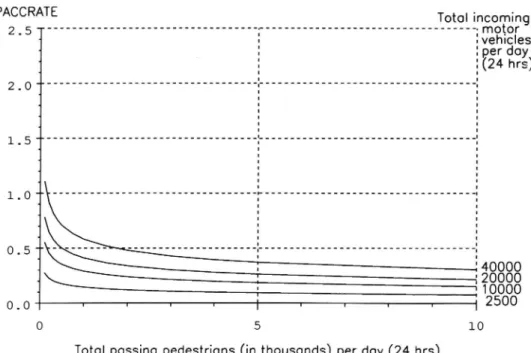
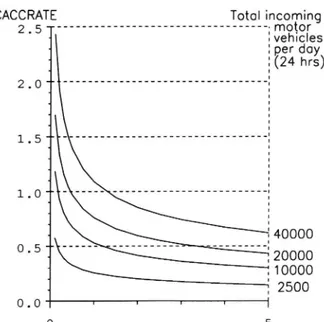
Put into words, the relationships shown above mean that both PACCPER YEAR and CACCPER-YEAR increase with increasing numbers of motor vehicles and unprotected road users (see Figs. 1 and 2). It is even more interesting that the risk, the accident rate for unprotected road users, i.e. PACCRATE and CACCRATE, increases with in-creasing numbers of motor vehicles, but decreases with increasing numbers of pedestrians and cyclists, respectively (see Figs. 3 and 4). To a large extent, the explanation for this could very well be that the more motor vehicles there are, then the larger is the number that can conflict with pedestrians or cyclists. And the more pedestrians and cyclists there are, then the larger is the number of living warning signs and the greater the consideration shown them by motorists. An additional explanation in the latter case may of course be that the more unprotected road users there are, then the more extensive are the measures applied in junction design with regard to pedestrians and cyclists. However, it should be pointed out that the number of cars also has a bearing on the inclination to apply such measures.
Another interesting observation is that the risk of an accident (with the given de nition of risk) is roughly twice as high for cyclists as for pedestrians. However, it should be mentioned that pedestrian single accidents are not reported by the police, as they are not de ned as road accidents. And that pedestrian cyclist accidents (quite a small number) are counted only as cycle accidents. If the omissions due to de ciencies in police reporting were taken into account, the accident numbers for pedestrians and cyclists would be roughly twice as high.
Tables 1 and 2 show how the junctions in total are distributed according to numbers of motor vehi-cles on the one hand and numbers of pedestrians and cyclists on the other hand, and also how the subset ofjunctions with PC* signals is similarly
dis-* The abbreviation PC used here refers to pedestrians and cyclists.
|_ | O JI | | | | | | | | | | | | | | | | | | | | | | | | | | | | | | | | I I __I- ______ Total incoming
--- -- --- --- --- motor
. vehicles ? per dayi (24 hrs)
l l l | |40000530000
.25000
520000
» - 15000 . 10000 _ _ _ _ -_ -_ -' -_ _ -___- __-_ _Q__-______-- ' _-_- _-_ _ g n u -g u n . . -5000 2500 " L -n l n u l _ _ _ U l _ J I -o -c p u -_-Total passing pedestrians (in thousands) per day (24 hrs)
Fig. l. PACCPERYEAR = 0.00000734 X TOTINCO'50 X TOTPEDMZ.
tributed. As can be seen, there is a strong relation ship between the occurrence of PC signals and size of ow.
From a practical viewpoint, the results are esting and at rst perhaps somewhat hard to inter-pret or accept. The junctions having the lowest PC risk, i.e. the lowest PACCRATE or CACCRATE
Cycling accidents per year Total incoming
1 . 5 ---; motor
iVGhICleS2 per day
§(24 hrs)
Total passing cyclists (in thousands) per day (24 hrs)
Fig. 2. CACCPERYEAR = 0.0000180 >< TOTINC0-52 x
TOTCYC0-65.
(given a certain number of motor vehicles), are those having the largest PC ows. At the same time, how ever, these junctions are the ones where numerous PC accidents occur precisely because of the high unprotected road-user exposure. Grouping pedestri ans and cyclists together at a smaller number of junctions with a high PC standard (and not too much motor traf c) would therefore appear to be maxi mally safety-effective. From a practical point of view, however, this might be somewhat dif cult to achieve.
OVERALL
RESIDUAL ANALYSIS
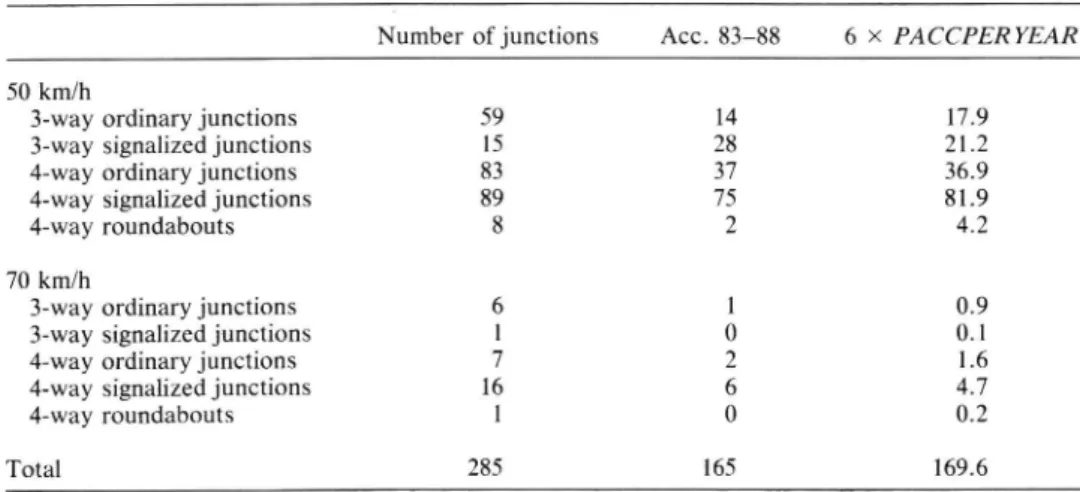
Tables 3 and 4 contain an overall comparison
of the number of observed and predicted accidents
for groups ofjunctions, broken down by speed limit and type ofjunction. The deviations are alternately positive and negative and no systematic pattern is discernible.
It is unfortunate that the studied material con-tains such a small number of roundabouts. In point of fact, the question of how effective or ineffective, roundabouts are from the viewpoint of the road safety of unprotected road users is a subject of much
controversy.
DEGREE OF DETERMINATION
If PACCPER YEAR and CACCPER YEAR are used to predict the annual accident numbers for
502 U. BRUDE and J. LARSSON
PACCRATE Tok incon ng
2.5 l ---
~ - .vehlclesmotor
: :perdoy _ : :(24-hrs)2.0'_"""""""""""""""""" """"""""""""""""""
1.5".""""""""""""""""""":"""""""""""""""""": |__ | | | | | | | | | | | | | | | | | | | | | | | | | | | | | | | | | | " " " ' T " " " " | | | | | | | | | | | | | | | | | | | | | | | | | | | | | | | | | |O I I I I I I I I I I I I I | I I I I I I I_|_ I I l I I I I I I I I I I I I I I I I I I I I I I I I I I I I I I _l
JH.
--O U1 _. _-.. -. -H OTotal passing pedestrians (in thousands) per doy (24 hrs)
Fig. 3. PACCRATE = 0.0201 X TOTINCO'50 X TOTPED _0'28.
Table 1. Junctions where pedestrian accidents have been analysed. Total number of junctions and number of junctions with PC signals
Number of incoming motor vehicles per
day (24 hrs)
1 1 1 1 47500 1 1 4 3 1 1 2 2 32500 1 1 3 3 2 1 1 1 1 1 1 1 27500 3 3 7 5 6 6 6 6 1 1 l 1 22500 13 8 16 13 5 4 6 4 1 1 1 1 17500 16 6 27 15 6 3 9 6 1 1 1 1 12500 23 7 39 13 8 4 16 5 1 O 7500 24 1 22 4 2 1 2500 2 0 3 0 0 100 250 750 1250 3750 6250 13750 16250
i
5
CACCRATE Totol incortning
* --- mo or 2 . 5 l : vehicles : per doy
;
:(24 hrs)
2 . Oj---2
20000 10000 2500Toto! passing cyclists (in thousands) per day (24 hrs)
Fig. 4. CACCRATE = 0.0494 X TOTINCO'52 >< TOTCYC 0'35.
correlation coef cients) will be obtained (Tables 5 and 6):
On average, the coef cients of determination will be small, about 0.17 and 0.08, respectively.
If we calculate the R 2 values for the entire
1983 1988 period instead, i.e. the period used in constructing the prediction models, the coef cients of determination usually reported will be obtained. As will be evident from Table 7, the R2 values then increase to 0.46 and 0.31, respectively.
If studies of the entire 1983 1988 period are continued but the R2 values are calculated sepa-rately for the 50% of junctions having the lowest number of predicted accidents and the 50% having the highest number of predicted accidents, then the coef cients of determination will be smaller. This applies above all to the rst-mentioned junction (Ta-ble 8).
Really high correlations are seldom to be ex-pected when the observation units are individual junctions and when, as. here, the study concerns random variables such as the occurrence of
acci-Table 2. Junctions where cycling accidents have been analysed. Total number of junctions and number of junctions with PC signals
Number of incoming motor vehicles per
day (24 hrs)
100 1 1 1 47500 1 1 2 2 4 4 32500 1 1 1 3 3 5 4 27500 2 12 11 6 6 7 6 22500 6 13 9 16 12 12 10 17500 10 29 16 16 7 17 9 1 12500 10 43 13 34 11 27 4 7500 18 37 1 17 5 14 1 0 2500 1 6 1 2 0 1 0 0 250 750 1250 3750 6250 13750 16250
504 U. BRUDE and J. LARSSON Table 3. Accidents involving pedestrians
Number of junctions Acc. 83 88 6 >< PACCPER YEAR
50 km/h
3-way ordinary junctions 59 14 17.9
3-way signalized junctions 15 28 21.2
4-way ordinary junctions 83 37 36.9
4-way signalized junctions 89 75 81.9
4-way roundabouts 8 2 4.2
70 km/h
3-way ordinary junctions 6 1 0.9
3-Way signalized junctions l 0 0.1
4 Way ordinary junctions 7 2 1.6
4-Way signalized junctions 16 6 4.7
4 way roundabouts 1 0 0.2
Total 285 165 169.6
Table 4. Accidents involving cyclists
Number of junctions Acc. 83 88 6 X CACCPER YEAR
50 km/h
3-way ordinary junctions 93 61 75.3
3-way signalized junctions 18 17 23.2
4 way ordinary junctions 103 97 102.3
4-way signalized junctions 91 166 161.1
4-Way roundabouts 8 15 11.2
70 km/h
3-way ordinary junctions 16 16 10.0
3-way signalized junctions 2 0 0.9
4-way ordinary junctions 22 18 20.5
4-way signalized junctions 23 40 35.6
4-way roundabouts l 2 1.7
Total 377 432 441 .9
Table 5. Accidents involving pedestrians, year by year, R2 values
Acc 83 Acc 84 Acc 85 Acc 86 Acc 87 Acc 88
PACCPER YEAR 0.09 0.35 0.16 0.09 0.11 0.20
Table 6. Accidents involving cyclists, year by year, R2 values
Acc 83 Acc 84 Acc 85 Acc 86 Acc 87 Acc 88
Table 7. Accidents throughout the entire period from 1983 to 1988, R
values
Acc 83 88
6 >< PACCPERYEAR 0.46
6 x CACCPERYEAR 0.31
dents. In particular, they are not expected in cases of low accident levels when the relative uncertainty will be especially high.
Even if absolutely correct expected values have been successfully predicted, perfect agreement be-tween observed and predicted ( tted) values can never be achieved on account of the randomness of the accidents.
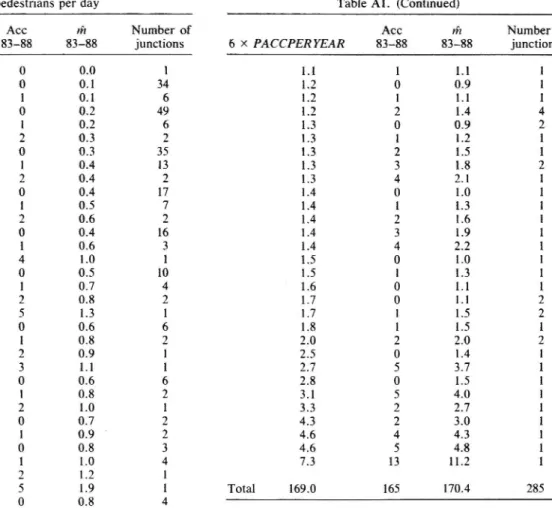
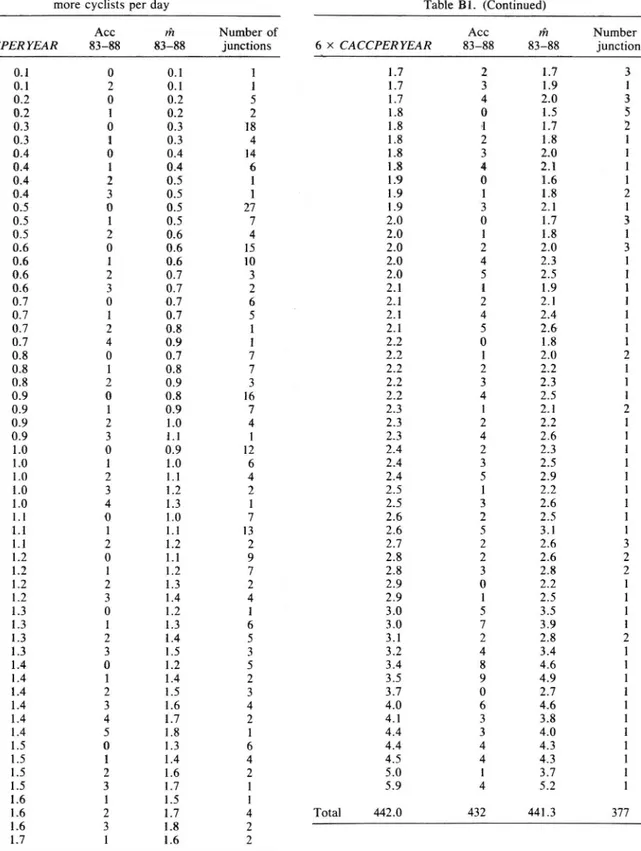
Appendices 1 and 2 list the numbers of observed and predicted accidents, junction byjunction, for the entire 1983 1988 period, broken down by accidents involving pedestrians and accidents involving cy clists. From these Appendices it is evident, for in-stance, that there are 40 junctions where the number of accidents involving pedestrians, rounded off to one decimal place, is predicted as 0.1. At 34 of these junctions, the observed number of accidents was zero and at six of them only one accident occurred. According to the theoretical Poisson distribution, with expected value m equal to 0.1, no accidents should have occurred at 36 of the junctions and one or more accidents at four of them. In general, simi-larly good agreement can be noted throughout.
RELATIONSHIP BETWEEN PREDICTED
VALUES AND ESTIMATED
EXPECTED VALUES
By weighting observed and predicted accidents together as in the following equation
m = pred + (a X pred/(l + a >< pred))
>< (obs pred) (5) an estimate of the true (expected) number of acci dents m will be obtained (Bri ide and Larsson 1988).
In eqn 5, a can be determined by means of cross validation (Junghard 1990). In Swedish junction studies covering all accidents reported by the police, a has usually ended up in the 010 030 interval. Furthermore, it has been found that the value is fairly robust in the sense that it makes little differ-ence whether a is assumed to be 0.10, 0.20, or 0.30. For the accident material we are concerned with here, which covers accidents involving pedestrians and accidents involving cyclists, a values of 0.29 and 0.08, respectively, have been obtained.
Apart from listing observed and predicted val-ues, Appendices 1 and 2 also contain estimates of m for eachjunction. The latter are extremely close to the predicted values throughout. This also becomes evident when calculating the squared correlation co-ef cients between predicted numbers of accidents and estimates of m, which will be equal to 0.90 for accidents involving pedestrians and 0.95 for acci-dents involving cyclists (Table 9).
In actual fact, the main interest lies in the ability
of the models to predict the (nonobservable) ex-pected values. The results indicate that in this re-spect the prediction models are nearly perfect . However, it is natural for the objection to be raised that the estimates of m constitute a function of the predicted values and that this is why the squared correlation coef cients lie so close to 1.
MAXIMAL COEFFICIENTS OF
DETERMINATION, SIMULATED
AND THEORETICAL
It is possible to examine what happens if it is assumed for each individual junction that the pre-dicted value is equal to the actual expected value and a number of accidents (on the assumption of a Poisson distribution) is then simulated. Ten such simulations, each of accidents involving pedestrians and accidents involving cyclists during the 1983 1988 period, have been performed. The squared correlation coef cients between the as sumed expected values and the simulated values show the maximal R2 values that can be obtained for the prediction models used (Table 10).
Table 8. Subgroups ofjunctions, accidents throughout the entire period from 1983
to 1988, R2 values
Acc 83 88
Lowest number of predicted accidents, 6 x PACCPER YEAR 0.02
Highest number of predicted accidents, 6 X PACCPER YEAR 0.45
Lowest number of predicted accidents, 6 x CACCPER YEAR 0.04
506 U. BRUDE and J. LARSSON Table 9. Squared correlation coef
-cients
m 83 88
6 >< PACCPERYEAR 0.90
6 x CACCPERYEAR 0.95
On average, the squared correlation coef cients will be 0.49 and 0.40, respectively. According to Table 7, squared correlation coef cients of 0.46 and 0.31, respectively, between predicted and observed values were obtained. The difference is surprisingly small, particularly in regard to accidents involving pedestrians. It is also interesting to note that the squared correlation coef cients can vary so widely in different simulations.
Furthermore, the maximal R2 values are doubt-less somewhat overestimated because the number of accidents occurring at individual junctions probably has a somewhat larger dispersion than is indicated by the Poisson distribution and also because omis-sions in police reporting vary between different mu-nicipalities.
On the other hand, it should of course be pointed out that the same data that have been used for constructing the prediction models have been used for comparing predicted and observed numbers of accidents.
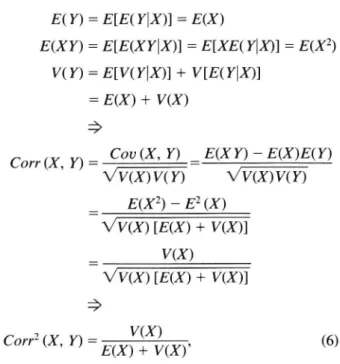
The maximal degree of determination can also be derived and calculated theoretically.
Let X denote the predicted number of accidents and assume that the expected values for individual junctions are in full agreement with the predicted
values.
Further, let Y denote the observed number of accidents.
Seen over all the junctions studied, X has a distribution with expected value E(X) and variance V(X).
For a certain given junction with X = x it is assumed that Y has a Poisson distribution with
expected value E( YIX = x) = x and variance
V(Y|X = x) = x.
Seen over all junctions, then
E( Y) = E[E( YIX)] = E(X)
E(XY) = E[E(XY|X)] = E[XE( YIX)] = E(X2)
V( Y) = E[V(YlX)] + V[E(Y|X)]
= E(X) + V(X)
_ .>
Cov (X, Y) _ E(X Y) E(X)E( Y)
VV(X)V< Y) _ WooV(Y)
_
E(X2) _ E2 (X)
_ \/V(X) [E(X) + V(X)]
_
V(X)
_ \/V(X) [E(X) + V(X)]
:>
Corr (X, Y) =V(X)
E(X) + V(X),
(6)
Corr2 (X, Y) =
which means that the theoretical maximal coefficient
of determination, Corr2 (X, Y) increases with
in-creased dispersion in the predicted number of acci-dents at the junctions studied. The measure will also be greater the larger the variance in the predicted values is in relation to the mean value of the pre-dicted values.
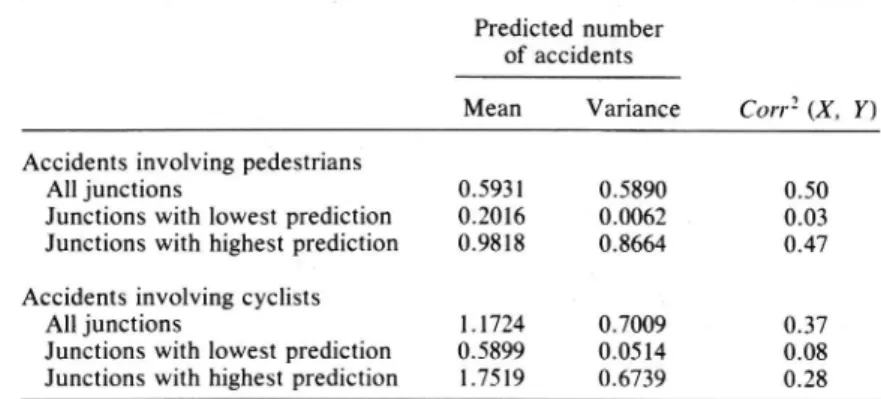
Table 11 shows the mean value and variance for the predicted number of accidents at the junctions as
well as Corr2 (X, Y) for all junctions and for the
subgroups with the lowest and highest number of predicted accidents.
Seen over all junctions, agreement with the sim-ulated results in Table 10 is extremely good, as expected, but also with the results in Table 7 and Table 8.
It is easy to see what would happen with the maximal theoretical coef cient of determination
Corr2 (X, Y) if the length of the study period were
to be halved, doubled, or extended by a factor of
ve or ten. If, in the equation for Corr2 (X, Y), X
is replaced by kX, where k denotes the length of the
Table 10. Squared correlation coef cients Sim. acc. 83 88
l 2 3 5 6 7 8 9 10
6 x PACCPERYEAR 0.49 0.49 0.49 0.36 0.56 0.53 0.50 0.39 0.56 0.48
Table 11. Corrl(X, Y) for different groups
Predicted number of accidents
Mean Variance Corr2 (X, Y) Accidents involving pedestrians
All junctions 0.5931 0.5890 0.50
Junctions with lowest prediction 0.2016 0.0062 0.03 Junctions with highest prediction 0.9818 0.8664 0.47
Accidents involving cyclists
All junctions 1.1724 0.7009 0.37
Junctions with lowest prediction 0.5899 0.0514 0.08
Junctions with highest prediction 1.7519 0.6739 0.28
alternative period, then
V(kX)
2 _
CO (kX Y) _ E(kX) + V(kX)
k2V(X)
: kE(X) + k2V(X) (7)
is obtained, which will be greater or less than Corr2
(X, Y), depending on whether k is greater or less than 1.
As will be seen, a change in the length of the study period, and with it the accident level and dis-persion in the expected values, strongly affects the maximal degree of determination (Table 12).
STANDARDIZED COEFFICIENTS OF
DETERMINATION?
Is there any good way of comparing more fairly the R 2 values of different prediction models? Some-thing comparable with the coefficient of variation (standard deviation divided by the mean), for in-stance, which is sometimes used for comparing dis-persion in different data materials. Would a
conceiv-Table 12. Corr2 (kX, Y) for different values of k
Corr2 (kX, Y) Accidents involving pedestrians
k = 0.50.33
k = 1 0.50
k = 2 0.67
k = 5 0.83
k = 10 0.91
cccidents involving cyclists
k = 0. 5 0.23
k = 1 0.37
k = 2 0.54
k = 5 0.75
k = 10 0.86
able means of standardizing the coef cient of determination be to divide it by the theoretical maxi-mal coef cient of determination? These are some of the questions that come to mind.
CONCLUSIONS
The results show that even with a simple model and simple estimates of the annual average daily numbers of motor vehicles and unprotected road users, it is possible to obtain nearly perfect mod-els for predicting the number of accidents involving pedestrians or cyclists. This is in spite of the fact that the R2 values obtained, the squared correlation coef cients between observed, and tted values, may be extremely low.
Simulations and theoretical calculations can both be used for calculating the maximal R2 Value of a prediction model. The maximal R2 value de-pends on the average level and the relative disper-sion of the expected values for the junctions studied. According to results obtained, the risk the number of accidents involving unprotected road users per unprotected road user increases with in-creasing numbers of motor vehicles but decreases with increasing numbers of pedestrians and cyclists. It would therefore appear to be favourable from a road safety viewpoint to group together pedestri-ans and cyclists, if possible, at a small number of road junctions with a high PC* standard and little motor traffic.
The risk of being involved in an accident is roughly twice as high for cyclists as for pedestrians in comparable traf c ows.
The results also indicate how hard it may be to decide whether additional factors that describe the design in greater detail in uence the number of acci-dents, and in such a case by how much. This is
* The abbreviation PC used here refers to pedestrians and cyclists.
508 U. BRi'JDE and J. LARSSON
partly because traf c ows explain the systematic
variation in accident frequency to such a large extent and partly because of the strong connection between traf c volume and the occurrence of PC signals, for
instance.
Acknowiedgemems The writing of this article has been possible through a project which the Swedish Road and Traf c Research
institute (VTI) has been carried out on behalf of the Swedish National Road Administration and also through funding from
VTl s own resources. Greatly appreciated advice and suggestions on organizing and revising the contents of the article have been
generously given by Mats Wiklund, VTI, and Stig Danielsson,
University of Linköping.
REFERENCES
Briide, U.; Larsson, J. The use of prediction models for eliminating effects due to regression to the-mean in road accident data. Accid. Anal. Prev. 20:299 310;
1988.
Junghard, O. Linear shrinkage in traf c accident models
and their estimation by cross validation and bootstrap
methods. Linköping Studies in Science and Technol-ogy. Thesis. No. 205. Linköping, Sweden: Linköping University; 1990.
APPENDIX A
Table Al. Accidents involving pedestrians. Junctions with 100or more pedestrians per day
Acc nä Number of
6 x PACCPER YEAR 83 88 83 88 junctions
0.0 0 0.0 l 0.1 0 0.1 34 0.1 l 0.1 6 0.2 0 0.2 49 0.2 1 0.2 6 0.2 2 0.3 2 0.3 0 0.3 35 0.3 l 0.4 13 0.3 2 0.4 2 0.4 0 0.4 17 0.4 1 0.5 7 0.4 2 0.6 2 0.5 0 0.4 16 0.5 1 0.6 3 0.5 4 1.0 1 0.6 0 0.5 10 0.6 l 0.7 4 0.6 2 0.8 2 0.6 5 1.3 l 0.7 0 0.6 6 0.7 1 0.8 2 0.7 2 0.9 1 0.7 3 1.1 1 0.8 0 0.6 6 0.8 1 0.8 2 0.8 2 1.0 1 0.9 0 0.7 2 0.9 1 0.9 2 1.0 0 0.8 3 1.0 1 1.0 4 1.0 2 1.2 1 1.0 5 1.9 1 1.1 0 0.8 4 Table A1 . (Continued) Number of junctions Ace fit 6 x PACCPER YEAR 83 88 83 88 A w r a n t i y t m m h a n A b u m r n N M h -n t -H O h i n c r -u o u . q a o m m w o w x o o a w o o o m ' w x o h = L -io n w ' o x b e J L J L b o l i b i ' o ö o k n l i ö x i A L / u l u hhh h ' w ' w i p u w i v i u i w i w ( J u -l å N N U I O M O N h O o O L W N W O Å W N H O N O m u n v t n n o t h u N N N u n h u u u _ _ _ M p H N J x b h h : x ) Å h h h i w N N N N v H n n h w v n M n n w u n w m b u n d Total 169.0 165 170.4 285
509
Models for pedestrian/cyclist accidents
APPENDIX B
Table Bl. Accidents involving cyclists. Junctions with 100 or
Table Bl. (Continued) more cyclists per day
rie Number of 83 88 Acc 83 88 Number of junctions ih 83 88 Acc junctions 83 88
6 x CACCPER YEAR 6 X CACCPER YEAR
377 7 9 0 5 7 0 0 0 1 1 6 0 0 ] . . . 7 8 0 3 5 9 1 4 6 8 0 2 3 5 1 1 2 6 3 1 1 1 2 1 1 1 1 1 2 2 1 1 2 1 1 2 2 2 1 2 2 2 1 2 2 2 2 2 2 2 2 2.5 441.3 432 7 . 7 / . _ . / . 0 0 . 0 0 . 0 0 . 0 0 0 0 . 9 9 0 1 .
