Department of Business Administration
Titel /Title: Audit Methodology – Performance and Needs Analysis
Författare /Author : Stanley Wissmar
Examensarbete nr /Thesis No: XX-04
10 poäng /10 credits
Examensarbete/ Thesis
Magisterprogram med ämnesbredd
med inriktning mot Marketing Management
Study programme in
Master of Business Administration in Marketing
Summary
The purpose of an audit is to improve the performance of a company. By analyzing its current performance parameters the needs can be diagnosed as well as new opportunities and challenges. Different theories on organizational
management will be discussed as well as current used audit methodologies seen from a marketing perspective. An explicit aim is to find the links between performance parameters and the appropriate tools in meeting the founded needs. A case study, using the described methodology, is analyzed to give a practical example.
The method was mainly “learning by doing”, the case study foremost. As the tools which each management consultant use in detail is not published, starting out by what is described in literature made a first practical iterative step in the process. The authors own development in creating this tool has foremost been to integrate the two (the Balanced Scorecard and Three levels of performance). They complement each other well as the later makes it possible to obtain a structural approach (as is highly convenient in large organizations), the former has a clear and consistent parameter coupling between cause and effect in business processes.
Table of Content
SUMMARY... 2 TABLE OF CONTENT ... 3 1. INTRODUCTION... 5 2. THEORY... 62.1THREE LEVELS OF PERFORMANCE – THE NINE PERFORMANCE VARIABLES... 6
2.2THE BALANCED SCORECARD... 9
3. CASE STUDY... 15
4. RESULTS AND REFLECTIONS ... 16
1. ACKNOWLEDGEMENTS... 16
2. REFERENCES... 16
3. APPENDIX... 17
7.1THE THREE LEVEL PERFORMANCE MEASUREMENT/MANAGEMENT SYSTEM... 17
7.2THE BALANCED SCORECARD PROJECT TIMELINE... 18
7.3 WORKSHEET TO SELECT BALANCED SCORECARD MEASURES... 18
SUMMARY... 21
TABLE OF CONTENT ... ERROR! BOOKMARK NOT DEFINED. 2. INTRODUCTION... 22
2. EXECUTIVE WORKSHOP ... 22
3. ORGANIZATIONAL ANALYSIS ... 23
4. BENCHMARKING TO COMPETITORS ... 26
5. IDENTIFYING MEASURES... 28
6. TARGETS - LINKING STRATEGY TO PROCESS... 29
7. CONCLUSIONS... 30
8. ACKNOWLEDGEMENTS ... 31
9. REFERENCES ... 31
1. Introduction
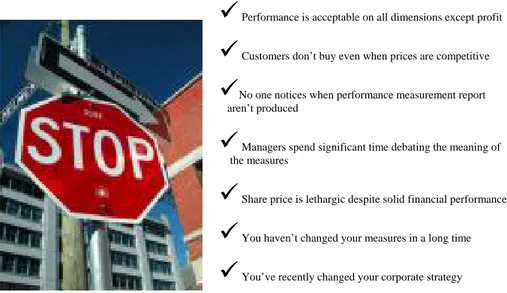
In today’s fast-pace and globalized business environment companies need to be highly conscious on how their organization functions externally and internally (and their interdependence) in order to sustain competitive advantage. “Adapt or die” is a common expression used to describe how organizations have to acknowledge the fact that the world is never static and a constant change management has to be incorporated into a corporations’ strategy as “organizations seeks equilibrium with its external environment” [1]. To do so successfully performance parameters on different levels in an organization has to be identified and correlated to what improvement processes needs to be implemented to achieve desired outcomes. Figure 1 shows an example on what signs can be found when a company may need a new
performance measurement system.
Figure 1 Signs that you may need a New Performance Measurement System
Since the beginning of industrialization different management theories has been developed to help managers lead their companies efficiently: CPR (Core Process Redesign), BPR (Business Process Reengineering), Value Driven
Reengineering, TBM (Time Based Management), Totally Quality Management (TQM) is examples of methodologies which have been popular throughout the years. Their respective pro’s and con’s have been debated but no one has questioned the necessity to have a management tool which can be used as means to obtain an overall view of internal and external processes and their interconnections to reach a company’s objectives and strategies.
Most established management consulting firms have embraced these theories [2] and made their own interpretation of them (table 1).
Table 1. Management Methodologies used by Management Consulting Firms
Company McKinsey Ernst &Young ABB-MAC Accenture BCG (Boston Consulting Group)
2nd Generation Balanced Scoreard Balanced Scoreard Rummler & Brache
Balanced Scoreard
Balanced Scoreard Methodology 1st Generation CPR, (Core Process
Redesign)
BPR (Business Process Reengineering)
- Value Driven Reengineering
TBM (Time Based Management) Signs that you may need a New Performance Measurement System
9
Performance is acceptable on all dimensions except profit9
Customers don’t buy even when prices are competitive9
No one notices when performance measurement report aren’t produced9
Managers spend significant time debating the meaning of the measures9
Share price is lethargic despite solid financial performance9
You haven’t changed your measures in a long time
The two management methodologies used today are Rummler & Brache’s “Three levels of performance – the nine performance variables” [1] and Kaplan & Norton’s “Balanced Scorecard” [3]. The thesis aim is to analyze their respective theories, perform a case study to put them into practice and finally reflect and discuss their different advantages.
2. Theory
2.1 Three levels of performance – the nine performance variables
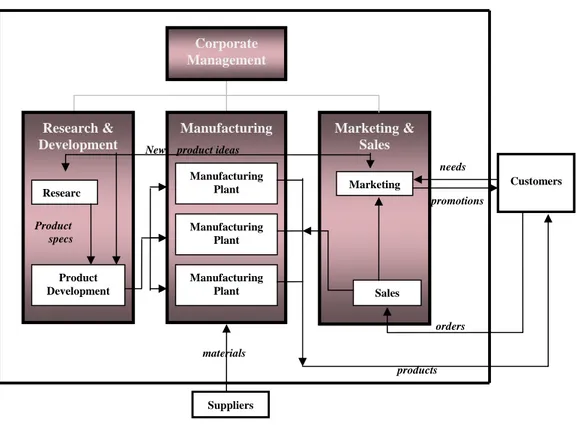
In their book “Improving Performance – How to manage the White Space in the Organization Chart” Rummler & Brache suggests a different view than the traditional (vertical) perspective of an organization.
With a horizontal organization chart the organizations system flow, how “work actually gets done”, is shown more clearly. Marketing & Sales Corporate Management Research & Development Manufacturing Marketing & Sales Corporate Management Research & Development Product specs Manufacturing Researc Product Development Manufacturing Plant Manufacturing Plant Manufacturing Plant Marketing Sales New product ideas
Suppliers materials needs promotions products orders
Figure 1. Traditional Vertical organization chart
Customers
This shows how the internal relation to customer-supplier is linked through products and services. The horizontal links shows the functional boundary interfaces in which, according to Rummler & Brache, “the greatest opportunities for
performance improvement can be found”. The bottom level managers manage the boxes (i.e. R&D, manufacturing or
marketing & sales) according to the vertical organizational chart. Managers’ primary function on the second level and above is to manage “the white space in between the boxes”. To respond effectively to cutthroat competition and changing customer expectations the systems (horizontal) view is a highly usable framework in adapting its management speedily.
To change an organizational system a holistic approach, which recognizes the interdependence of nine performance variables, is used. These are divided into three different levels: the organizational, process and job levels.
I: The Organization Level - This level emphasizes the organization’s relationship with its market and the basic
“skeleton” of its major functions that comprise the organizational body. Variables at this level that affect performance include strategies, organizational goals and measures, organization structure, and deployment of resources.
II: The Process Level - The level below contains the organizational body’s musculature: its processes; which shows
how the work actually gets done. Being the link between level I and III an organization is only as good as its processes. Variables at this level include product development, merchandising-, production-, sales, distribution and billing
processes.
III: The Job/Performer Level - Processes in turn are performed and managed by individuals doing their jobs. These are
represented by “the cells” in the organizational body. Variables at this level include hiring and promotion, job
responsibilities and standards, feedback, rewards, and training.
The overall performance of an organization is the result of goals, structures and management actions at all three levels in a one dimensional parameter space. The second dimension, performance needs, determines the effectiveness at each level: (i). goals (ii). design and (iii). management.
Goals - each level needs specified standards that reflect customers’ expectations for product and service quality,
quantity, timeliness and cost.
Design – each level needs a structure with necessary components configured in a way to meet the goals set efficiently. Management – each level need management practices that ensure the goals are relevant to current situations and
implemented efficiently.
Level Goals Design Management
Organizatio n
Has the organization’s strategy/direction been articulated and communicated? Does this strategy make sense, in terms of the external threats and opportunities and the internal strength and weaknesses? Given this strategy, have the required outputs of the organization and the level of performance expected from each output been determined and communicated?
Are all relevant functions in place? Are all functions necessary? Is the current flow of inputs and outputs between functions appropriate? Does the formal organization structure support the strategy and enhance the efficiency of the system?
Have appropriate function goals been set? Is relevant performance measured? Are resources appropriately allocated?
Are the interfaces between functions being managed?
Process Are goals for key processes linked to customer/organization requirements?
Is this the most efficient/effective process for accomplishing the Process Goals?
Have appropriate process subgoals been set? Is process performance managed?
Are sufficient resources allocated to each processes? Are the interfaces between process steps being managed?
Job/ Performer
Are job outputs and standards linked to process requirements (which in turn are linked to customer and organization requirements)?
Are process requirements reflected in the appropriate jobs?
Are job steps in a logical sequence? Have supportive policies and procedures been developed? Is the job environment ergonomically sound?
Do the performers understand the Job Goals (outputs they are expected to produce and standards they are expected to meet)?
Do the performers have sufficient resources, clear signals and priorities, and a logical Job Design?
Are the performers rewarded for achieving the Job Goals? Do the performers know if they are meeting the Job Goals?
Do the performers have the necessary knowledge/skills to achieve the Job Goals? If the performers were in an environment in which the five questions listed above were answered “yes”, would they have the physical, mental and emotional capacity to achieve the Job Goals?
Table 2 shows the nine performance variables.
This is executed using a fourteen-step, three level approach subcategorized into organization-, process- and job
improvement. The overall structure is outlined in appendix 7.1: “The three level Performance Measurement/Management
System”.
Organization Improvement
Step 1: Project Definition and Plan. Interviews with the corporate management are made to define Critical Business
Issues (CBI) that initiated the performance improvement project in the first place. The outcome form this exercise should be:
♦ Learn the specific financial effect the problem is having on the organization ♦ Establish project goals based on the diagnosed problem
♦ Define the scope of the project
♦ Identify his client and define the roles he or she and other key persons will play in the analysis ♦ Reach some conclusions regarding the constraints, odds of success and value of the project
Step 2: Project Plan Developed. Plan the events and dates for the project.
Step 3: Organization System defined. The next step is analyzing the discrepancy between a company’s current and
optimal organizational structure and develop a Relationship Map (appendix 7.1). This shows the interfaces among each function. Two key questions are: (i). Does the company have all of the functional components it
needs to achieve its strategy? (ii). Should any input-output connections (supplier-customer relationships) be added, eliminated, or altered?
Step 4: Organization performance Improvement Opportunities Identified. Here identification of high-impact
gaps at the organizational level is performed.
Step 5: Organization Improvement Actions Specified. Diagnosis of the causes behind the high-impact gaps is
performed. Can they be addressed and solved only on the organizational level?
Step 6: Processes with Performance Payoff Identified. Identify what organizational issues (processes) have the
most significant impact on performance in order to prepare a bridge to the process level. Updating your plan specifying the steps taken at the process level is recommended at this stage.
Process Improvement
Step 7: Process Defined. Work together with managers/staff at the department/function where the problem is
identified constructing a Process Map (“Is” contra a “Should” map analysis).
Step 8: Process performance Improvement Opportunities Identified. The gaps between actual and desired
performance are identified and the impact it has.
Step 9: Process Improvement Actions Specified. The causes of the gaps revealed in step 8 are identified and what
appropriate actions should be taken are defined.
Step 10: Job (s) with Performance Payoff Identified. To bridge between the job and process an identification of
the jobs that impact the processes which have gaps are performed. Job Improvement
Step 11: Job specification Defined. Work together with managers/staff at the department/function where the
problem is identified constructing a Job Model(what outputs and standards processes are required in the “Should”).
Step 12: Job performance Improvement Opportunities Identified. The gaps between actual and desired
performance are identified and the impact it has. The Human Performance System (see figure x) is used to identify the causes of the gaps.
Step 13: Job Improvement Actions Specified. For each gap a recommended gap-closing action is developed.
Implementation
Step 14: Performance Improvement Actions Implemented and Evaluated. A summary of the recommendations
from all three levels of the analysis is presented using table 2 as a checklist. A cost-benefit analysis is conducted based on the recommendations and a high-level implementation plan is proposed.
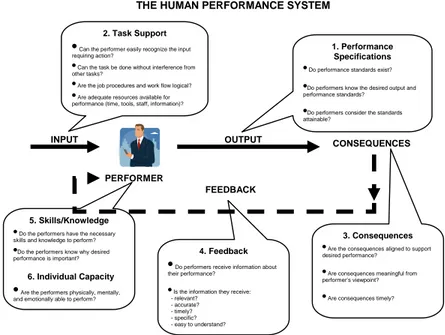
While carrying out the three-level step process a serial loop of questions called “The Human Performance System” is used to ensure each management-, process- and job designs are properly structured and self-consistent. Figure 3 shows an example of a series of questions while designing a job function.
Figure 3 The Human Performance System – design of a Job Function
At the organizational level developing the relationship map (step 3) correctly is crucial in order to identify what core
process (or processes) has the most significant impact on performance. Once this (these) has been identified the
remaining steps can relatively easy be defined.
2.2 The Balanced Scorecard
Robert Kaplan and David Norton developed a methodology to translate an organization’s strategy into performance objectives, measures, targets, and initiatives in four balanced perspectives: Financial, Customer, Internal Processes, and
Employee Learning and Growth. “The Balanced Scorecard” can be used as a tool for three purposes: a measurement system, strategic management system, and a communication tool. The measurement system is made up of lagging and leading indicators. Lag indicators are “outcomes of actions previously taken” which usually consists of financial
measures (profitability, revenue growth and EVA etc.) or customer satisfaction, to name a few. They are complemented by lead indicators which are the “drivers of future performances”, which for example can be the measure “on-time
THE HUMAN PERFORMANCE SYSTEM
INPUT OUTPUT CONSEQUENCES
PERFORMER
FEEDBACK
2. Task Support
•Can the performer easily recognize the input
requiring action?
• Can the task be done without interference from
other tasks?
• Are the job procedures and work flow logical?
• Are adequate resources available for
performance (time, tools, staff, information)?
1. Performance Specifications
• Do performance standards exist?
•Do performers know the desired output and
performance standards?
•Do performers consider the standards
attainable?
3. Consequences
• Are the consequences aligned to support
desired performance?
• Are consequences meaningful from
performer’s viewpoint?
• Are consequences timely?
4. Feedback
•Do performers receive information about
their performance?
• Is the information they receive:
- relevant? - accurate? - timely? - specific? - easy to understand? 5. Skills/Knowledge
• Do the performers have the necessary
skills and knowledge to perform?
•Do the performers know why desired
performance is important?
6. Individual Capacity
•Are the performers physically, mentally,
delivery”. Creating the cause and effect linkages between performance measures can be the most challenging task in developing the balanced scorecard.
The Balanced Scorecard is made up of two major parts: the planning- and the development phases. Each step is
described in detail below; in appendix 7.2 (“The Balanced Scorecard Project Timeline”) a table of the respective steps is also presented.
The Planning Phase (Steps 1-6)
Here (i). objectives are developed, (ii). size of the work group is established , (iii). sponsorship ensured, (iv). building of the taskforce team, (v). formulation of project plan and (vi). development of a communication plan
The Development Phase (Steps 7-16)
Step 7 consists of gathering and reviewing background material. They can be
♦ Financials: annual reports, performance reports, analyst reports, trade journals, benchmark reports ♦ Mission, Values, Vision, and Strategy: mission statements, values, vision statement, strategic plan,
organizational histories, consulting studies, project plans
♦ Internal Process: operational reports, manufacturing reports, competitor data, benchmark reports, trade journals, consulting studies, project plans
♦ Customer: marketing department, trade journals, consulting studies, project plans, strategic plan, performance reports, benchmark reports
♦ Employee Learning & Growth: Human resources data, trade journals, core values, benchmark reports consulting studies
Can data be extracted from the information in which consistent conclusions can be drawn? If possible, it is important to be able to find “a red line” in the information which tells the story of the company.
Step 8-9. If the mission- and/or the vision statements and values seem to misalign with the firm’s current strategy they
should be redefined. Preferably by having the senior team in the organization to review and debate the statements and values. It is important to get this right as these works as the “DNA” of the organization and the balanced scorecard translates these into performance objectives and measures.
Step 10 objectives and measures are developed.
Objectives
The best way to create performance objectives is to examine each perspective of the balanced scorecard in the form of a question:
♦ Financial perspective: What financial steps are necessary to ensure the execution of our strategy?
♦ Customer perspective: Who are our targeted customers, and what is our value proposition in serving them? ♦ Internal Process perspective: To satisfy our customers and shareholders, at what process must we excel? ♦ Employee Learning and Growth perspective: What capabilities and tools do our employees require to help
them execute our strategy?
It is useful to formulate the objectives with an action verb (increase, reduce, initiate etc.) to express its action-oriented nature.
Measures
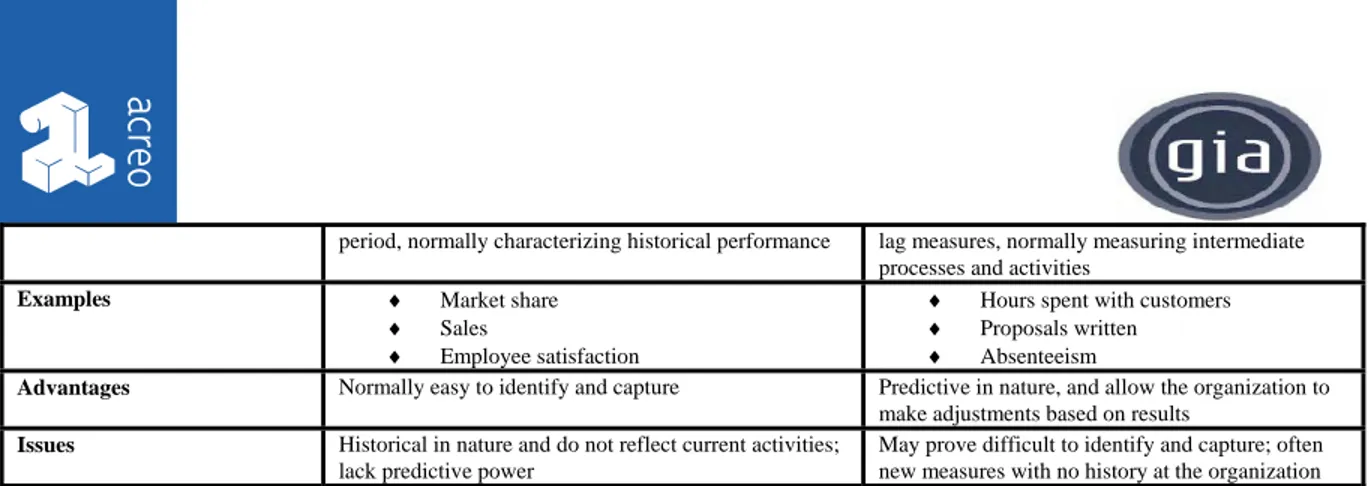
The measures are needed to develop cause-and-effect linkages. It should contain a mix of lag and lead indicators. To identify lagging indicators is relatively easy as they are parameters showing historical performance figures. Leading indicators are more difficult to grasp as it is a more “abstract” parameter to measure what drives performance. An example is shown in table 3.
Lag Lead
period, normally characterizing historical performance lag measures, normally measuring intermediate processes and activities
Examples ♦ Market share ♦ Sales
♦ Employee satisfaction
♦ Hours spent with customers ♦ Proposals written ♦ Absenteeism
Advantages Normally easy to identify and capture Predictive in nature, and allow the organization to make adjustments based on results
Issues Historical in nature and do not reflect current activities; lack predictive power
May prove difficult to identify and capture; often new measures with no history at the organization Table 3 Definition of lag- and lead measures
Financial perspective
Financial measures are the most important measures which should relate to economic growth, profitability, and value creation. Commonly used financial measures can be seen in table 4.
Financial Measures (lag/lead)
Total assets Value added per employee
Total assets per employee Compound growth rate Profits as a % of total assets Dividends
Return on net assets Market value
Return on total assets Share price Revenues/total assets Shareholder mix
Gross margin Shareholder loyalty
Net income Cash flow
Profit as a % of sales Total costs
Profit per employee Credit rating
Revenue Debt Revenue from new products Debt to equity
Revenue per employee Times interest earned Return on equity (ROE) Days sales in receivables Return on capital employed (ROCE) Accounts receivable turnover Return on investment (ROI) Days in payables
Economic value added (EVA) Days in inventory Market value added (MVA) Inventory turnover ratio
Table 4. Commonly used financial measures
Customer Perspective
To develop a customer value proposition organizations often choose one of three “disciplines” formulated by Treacy and Wiersema in “The Discipline of Market leaders” [4]: operational excellence, product leadership, customer intimacy.
A. Operational Excellence. Operational excellent organizations make hard choices to stay ahead of competition by
“having less product variety, the courage not to please every customer and forging the whole company, not just manufacturing and distribution, into a single focused instrument”. Measures used are shown in table 5.
Measures of Operational Excellent Companies Lead indicator Comment/Lag indicator
Price A relentless pursuit of low prices compared to competitors is critical since it drives lagging indicators such as market share and satisfaction
Selection To ensure efficient inventory control a small range of products are offered. Product availability, inventory turnover and stockouts are closely monitored.
Convenience Non adding value costs (tangible or intangible) are removed. Customer complaints is an example of convenience measure Zero Defects Customer anticipates zero defect product or service. Manufacturing defect rates and service errors are carefully tracked Growth Value leadership is a commonly used mantra. Growth in targeted segments is monitored to prove success
Further measures:
Total delivered cost, order cycle time variance, accurate product selection, accurate invoicing, timely and accurate availability of information
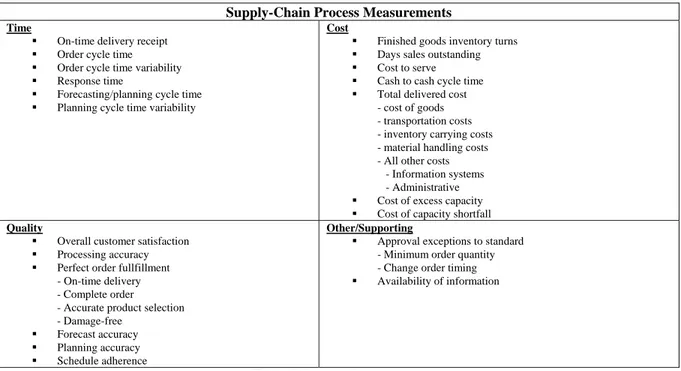
Supplier relationships are especially important and need to be tracked by using supply-chain measures. These are shown in table 6. Activity-based costing (ABC) is a method of identifying cost drivers and assigning costs to activities and can be used as a complement to supply-chain measures to reveal insight into what activities are truly driving customer profitability.
Supply-Chain Process Measurements Time
On-time delivery receipt Order cycle time Order cycle time variability Response time
Forecasting/planning cycle time Planning cycle time variability
Cost
Finished goods inventory turns Days sales outstanding Cost to serve Cash to cash cycle time Total delivered cost
- cost of goods - transportation costs - inventory carrying costs - material handling costs - All other costs - Information systems - Administrative Cost of excess capacity Cost of capacity shortfall
Quality
Overall customer satisfaction Processing accuracy Perfect order fullfillment
- On-time delivery - Complete order - Accurate product selection - Damage-free
Forecast accuracy Planning accuracy Schedule adherence
Other/Supporting
Approval exceptions to standard - Minimum order quantity - Change order timing Availability of information
Table 6. Supply-chain measures
B. Product leadership. Making products that customers continually recognize as superior is the driving force for
these companies. Marketing is crucial to promote a strong brand image by supplying customers with products that offer enhanced functionality, save them time, and consistently outperform the competition. Measures are shown in table 7.
Measures for Product Leadership Lead indicator Comment/Lag indicator
help line calls per product Brand awareness
number of customer needs satisfied To ensure to meet up to “customer expectations”
Track success # of products or services launched within a given time frame
Track failure (abandonment) Knowing when to say “enough is enough” and admit a mistake is vital in being fluent in the discipline of innovation
Lead users # of products or services launched by the user
Customer Intimacy. These companies recognize that their clients have needs beyond which their product alone can
satisfy and offer a complete solution which encompasses a unique range of superior services to differentiate them from competitors. Measures are shown in table 8.
Measures for Customer Intimacy
Lag indicator Comment/Lead indicator
Customer knowledge To gauge staff knowledge “training hours on client products” may be measured
Solutions offered It’s the unmatched total solution which is critical to these companies. The “total number of solutions offered per client” is a metric used. Penetration Aims to provide a complete solution for the customer spending
account. “Share of targeted customer spending” is a measure of customer penetration.
Customer data To offer unique solutions organizations require abundant and rich customer data. “Percentage of employees with access to customer information” may be measured to track this key differentiator. Culture of driving client success Awards from a client is the greatest proof of nourishing a culture
which cares for customer success. “Number of customer awards received” helps track this goal.
Relationships for long term In contrast to other companies these firms view a sale as a beginning of a customer relationship. “Number of staff at client locations” could be a measure to track long term relationship.
Further measures: Customer satisfaction, customer loyalty, market share, customer
complaints, direct price, price relative to competition, total cost to customer, average duration of customer relationship, customer lost, customer retention, customer acquisition rates, percentage of revenues from new customers, number of customers, annual sales per customer, win rate (sales closed/sales contacts), customer visits to the company, hours spent with customers, marketing cost as a percentage of sales, number of ads placed, number of proposals made, brand recognition, response rate, sales volume, share of target customer spending, sales per channel, average customer size, customer per employees, customer service expense per customer, customer profitability, frequency (number of sales transactions)
complaints resolved on first contact, return rates, response time per customer request, number of trade shows attended
Table 8. Customer intimacy measures
Employee Learning and Growth perspective
As the value creation today is dominated by the influence of human capital – people and their knowledge and means of sharing it – employee learning and growth measures can be the differentiator to obtain a useful balanced scorecard or not. When used successfully a linkage between, for example, employee satisfaction and financial performance can be visualized. Sears could predict that for every 5% increase in employee satisfaction it corresponded to a 1.3% increase in customer loyalty three months later. This in turn increased revenue by 0.5% another three months down the road. In 1997 Sears predicted and achieved $200 million in revenues based on a 4% increase in employee satisfaction. This stems well with David Maisters investigation [5] in which he found that a company could boost its financial performance by as much as 42% by raising employee satisfaction by 20%. Measures are shown in table 9.
Employee Learning & Growth measures
Lag indicator Comment/Lead indicator
Competence to obtain competitive advantage/achieve strategy Competence inventory process Percentage of employees who meet their PDP goals Personal development planning (PDP)
Competence coverage ratio Percentage of necessary skills currently possessed by your workforce Absenteeism, morale, productivity per employee Health promotion initiatives
Further measures:
Employee participation in professional or trade associations, training investment per customer, average years of service, percentage of employees with advanced degrees, number of cross-trained employees, absenteeism, turnover rate, employee suggestions, employee satisfaction, participation of stock ownership plans, lost time accidents, value added per employee, motivation index, outstanding number of applications for employment, diversity rates, empowerment index (# of managers), quality of work environment, internal communication rating, employee productivity, number of Scorecards produced, health promotion, training hours, competence coverage ratio, personal goal achievement, timely completion of performance appraisals, leadership development, communication planning, reportable accidents, percentage of employees with computers, strategic information ratio,
functional assignments, knowledge management, ethics violations
Table 9. Employee Learning & Growth measures
Criteria selection for Performance Measures
Now comes to make the difficult choices selecting the right parameters based on their alignment to previous stated objectives, targets, initiatives sprung from the initial formulated strategy. To ensure this is obtained one should:
♦ Link to strategy – this point can not be emphasized too much as it is of such vital importance. If the measure is not linked to strategy it can lead to confusion and lack of clarity.
♦ Quantitative – To get an objective measurable it’s important it is quantitative. Subjective measures, “good”, “fair” or “average”, can easily be interpreted differently and should be avoided. Having a measure of “percentage of on time deliveries”, for example, is easily understood.
♦ Accessibility – You should be pragmatic when choosing performance measures. Avoid needs to invest in new IT infrastructure to obtain data.
♦ Easily understood – if employees can not see the value of a measure you may need to rethink it. The goal is to create a scorecard which motivates action.
♦ Counterbalanced – The measure should clearly show what are the trade-offs, seeing the overall picture, to help making the right decisions. Otherwise sub-optimizations can take place (i.e. you want to improve customer satisfaction and lower your prices. Revenue will plummet and your overall goal will not be obtained).
♦ Relevant – The measure should accurately show what process or objective you are evaluating. What actions can be taken from the measured results?
♦ Common definition – The meanings of the measures must be specified precisely in order to reach agreement among the team involved in the evaluation.
In appendix 7.3 a worksheet to select Balanced Scorecard measures can be found. It shows a good way of rating the measures obtained. It is convenient to have a scale from 0 to 10 points to set for each individual criterion. Usually 20 to 25 measures are used for your highest level scorecard. The most important is to have sufficient enough of parameters to “tell the story” of the company. Finally, when the appropriate measures have been found a “performance measure data dictionary” is written to provide a background that can support your selection (table 10). This helps to determine what the measure is all about and why it is important to track.
Balanced Scorecard Measure Dictionary
Perspective: Customer Measure #/Name: C01/Customer Loyalty Rating Owner: D. Ferguson, VP Marketing Strategy: Revenue growth Objective: Increase customer loyalty
Description: The customer loyalty rating measures the percentage of surveyed customers stating they prefer our products to competitor offerings,
and will purchase our products again. Our research indicates that loyal customers make more frequent purchases and tend to recommend our brand to others. Therefore, we believe increasing customer loyalty will help us achieve our strategy of revenue growth.
Lag/lead: Lag Frequency: Quarterly Unit Type: Percentage Polarity: High values are good Formula: Number of quarterly survey respondents answering yes to survey questions 5: "Do you prefer our products to competitor offerings?" and #6: "Will you purchase our products again?" divided by the total number of surveys received.
Data Source: Data for this measure is provided by our survey company, "SST". Each quarter they perform a random survey of our customers and
provide the results electronically to our marketing department. Data is contained in the form of MS Excel spreadsheets (MKT SURVEY.xls, lines 14 and 15). Data is available the 10th business day following the end of each quarter.
Data Quality: High - received automatically from third-party vendor Data Collector: I. Hashem, Marketing Analyst Baseline: Our most recent data received from SST
indicates a customer loyalty percentage of 59%.
Target: Q1 2001: 65%; Q2 2001: 68%
Q3 2001: 72%; Q4 2001: 75%
Target Rationale: Acheiving customer loyalty is critical to our revenue growth strategy. The quarterly increases we're targeting are higher than in
the past years but reflect our increased focus on loyalty. 1. Seasonal promotions
2. Customer relationship management project
Initiatives:
Table 10. Balanced Scorecard Measure Dictionary
At this point the Balanced Scorecard, what has been created up until now, is preferably presented to the senior team in the organization for review and debate.
Step 11-13: Create cause-and-effect linkages.
Using a strategy map (appendix 7.4) cause-and-effect linkages can then be created. It works as a condensed scorecard which can easily be communicated to others. Again, it is preferable if the scorecard is presented to the senior team in the organization for a reality check.
Step 14: Establish targets for your measures.
Once the strategy map is finalized the targets can be set. They can be divided into three categories: Long-Term (“Big Hairy Audacious Goals, BHAGs”, usually more than five years), Midrange (“Stretch Goals”, 3-5 years) and Short term (“Incremental “, annual) targets. Sources for relevant targets can be found from employees, (financial) trends & baselines, executive interviews, internal/external assessments, feedback from customer or other stakeholders, industry averages and benchmarking.
TARGETS
Perspective Measure Goal Priority/Weight Initiative Resources
FI
NA
NCI
A
L Return on equity 15% (BHAG) 30% Minimize investment;
preventive maintenance Purchase- & service staff CU ST OM ER
Customer Loyalty Rating 75% (stretch goal) 30% Account officer training program 250 000 USD IN T E R
NAL On-time delivery 90% (incremental) 25% supplier surveys Customer- and Logistics staff
EMP L O Y E E L E A RNI N G & GR O W
TH Percentage of the employees who achieves their personal goals
80% 15% Competence inventory of the emplyees at ”utvecklingssamtal” Management + respective empoyee Table 11. Targets
Finally, how to implement the overall strategy by splitting up into different levels of sub-targets has been reached. To ensure priority is correctly set between each target a weight is defined. Resources (financial, staff, material, equipment etc.) are set to initially define the investment allocated as well as showing what department/staff is in charge of administrating and obtaining the target.
The case study of BDAB was performed analyzing the firm’s business model, its strategy and objectives, identifying the core process and creating a link between the different organizational levels (management-, process- and job level) and setting appropriate targets. Due to the large material content the report is a presented as a document of its own. It is divided into two parts, one focused on organizational analysis, the other on the firm’s current financial- and competitive situation. The main recommendations includes differentiating their products & services (core process). In practice, ”to
find an area in between the highly competitive hard- and software suppliers and their (business) customers, doing what the customer can’t or don’t want to do”. The financial parameters “Weekly net sales per employee” and
“EVA/Revenues” are relevant indicators in the short and long term, respectively.
4. Results and Reflections
Rummler & Brache’s methodology is advantageous when performing organizational analysis. It is useful in describing an organizations static state identifying the core process/processes. In such it is a practical tool when analyzing large organizations describing how different functions interact through numerous internal- and external processes at different levels. The implementation plan (step 14) is however abstract lacking a clear methodology on how to go about executing the needs diagnosed.
The Balanced Scorecard complements this gap quite well acting as a dynamic tool creating a linkage between a firm’s strategy & objectives to its core process/processes identifying appropriate measures that can be used setting up targets to fulfil the organizations overall objective. The financial measures are of utmost importance clearly giving an indication if the performance is fulfilling the corporate objectives.
In the case study carried out Rummler & Brache’s methodology proved to be helpful in establishing the core process. The company, being relatively small, therefore needed no thorough analysis based on “The Three levels of performance – the nine performance variables”.
The Balanced Scorecard approach proved highly relevant to use in order to define mission-, vision statements and values, setting strategies & objectives and linking it to the four performance levels.
Combining these two methodologies is a convenient way of executing Performance and Needs Analysis, both to establish new improvement processes as well as maintaining a functioning performance measurement system.
1. Acknowledgements
A very special Thank You to my supervisor Stellan Granström, Business Development Manager at the FTU (Företag, Teknik & Utveckling) department at Acreo for his advice, support and patience. Also I’d like to thank BDAB, especially their CEO, Kjell Carlsson, for giving me the opportunity to perform the case study at their company.
2. References
[1] G. Rummler & A. Brache; “Improving Performance: How to Manage the White Space on the Organization Chart”; San Francisco: Jossey-Bass, 1990
[2] A. Werr, T. Stjernberg and P. Docherty; “The Functions of Methods and Tools in the Work of Management Consultants”; Journal of Organizational Change Management 10:4, 1996
[3] P. R. Niven; “Balanced Scorecard”; Wiley, 2002
[5] D. Maisters; “Practice what you Preach”;
3. Appendix
7.1 The three level Performance Measurement/Management SystemPROCESS ROLE/RESPONSIBILITY MATRIX FUNCTION MODEL
FUNCTIONS AND RESPONSIBILITIES FUNCTION A
OUTPUTS
FUNCTION A MEASURES/GOALS PROCESS
STEPS FUNCTION A FUNCTION B FUNCTION C ~ ~
~ ~ ~ ~ ~ ~ ~ ~ ~ ~ ~ ~ RELATIONSHIP MAP ORGANISATION CUSTOMER ORGANISATIONS GOALS PROCESS MAP CUSTOMER FUNCTION A FUNCTION B FUNCTION C M2 M2 M2 SUBPROCESS GOALS END-OF-LINE PROCESS GOALS (M2) ORGANISATION LEVEL PROCESS LEVEL
FUNCTION ROLE/RESPONSIBILITY MATRIX JOB MODEL
FUNCTION A JOB A
OUTPUTS
CRITICAL
DIMENSIONS MEASURES GOALS OUTPUTS GOALS JOB A JOB B JOB C ~ ~ ~ ~ ~ ~ ~ ~ ~ ~ ~ ~ ~ ~ ~ ~ ~ ~ ~ ~ ~ ~ ~ ~ ~ ~
7.2 The Balanced Scorecard Project Timeline
Balanced Scorecard Project Timeline
Week 1 2 3 4 5 6 7 8 9 10 11 12 13 14 15 16 17 18 19 20
Planning Phase Step 1: Develop Objectives for your
Balanced Scorecard. Step 2: Determine the appropriate
organizational unit. Step 3: Gain executive sponsorship. Step 4: Build your Balanced Scorecard
team.
Step 5: Formulate your project plan. Step 6: Develop a communication plan.
Development Phase Step 7: Gather and distribute
background material. Step 8: Develop or confirm mission,
values, vision and strategy. Step 9: Conduct executive interviews. Step 10: Develop objectives and
measures.
Step 11 (a): Executive workshop. Step 11 (b): Gather employee feedback. Step 12: Develop cause-and-effect
linkages.
Step 13: Executive workshop. Step 14: Establish targets for your
measures.
Step 15: Executive workshop. Step 16: Develop the ongoing
Balanced Scorecard implementation plan.
7.3 Worksheet to select Balanced Scorecard Measures Measure Linkage to Strategty Ability to Quantify Accessibility Ease of Understanding
Counterbalanced Relevance Common Definition Total Points Comments Financial Measure 1 Measure 2 Measure 3 Customer Measure 1 Measure 2 Measure 3 JOB/PERFORMER LEVEL
Internal Process Measure 1 Measure 2 Measure 3 Emp. L. & G. Measure 1 Measure 2 Measure 3 7.4 Strategy Map
Improve knowledge of customers
Internal
Lag Measures Lead Measures
Increase employee productivity
E.L. &
G.
Devlop customer loyalty
Customer
Build the business
Financial
Measures
Objectives
Improve knowledge of customers
Internal
Lag Measures Lead Measures
Increase employee productivity
E.L. &
G.
Devlop customer loyalty
Customer
Build the business
Financial
Measures
Objectives
Customer loyalty Training results Competency attainment Additions to solution database System downtime Revenue Growth PDP goals completed Ease of system use Hours spent with customer
Titel /Title: Audit Methodology – Performance and Needs Analysis
Författare /Author : Stanley Wissmar
Case
study:
Bergsjö Data AB
Case study for MBA in Marketing Thesis
Summary
The case study of BDAB was performed to analyze the firm’s business model, its strategy and objectives. How the organization is structured to support it identifying the core process and creating a link between the different organizational levels (management-, process- and job level) by setting appropriate targets. The report is divided into two parts, one focused on organizational analysis, the other on the firm’s current financial- and competitive situation. The main recommendations include differentiating their products & services (core process). In practice, ”to find an area in between the highly competitive hard- and software suppliers and
their (business) customers, doing what the customer can’t or don’t want to do”. The financial parameters “Weekly net sales per employee” and “EVA/Revenues” are relevant indicators in the short and long term,
2. Introduction
BDAB is a IT company providing hardware sales as well as software development. Based in Bergsjö (close to Hudiksvall) the company has sales of 3 MSEK and a staff of over 6 employees. In 2006 BDAB embarked on a performance & needs analysis. Kjell Carlsson, the CEO, recalls the need to structure the company in order to meet its new challenge of moving into the healthcare business.
The case study is divided into two parts, one focused on organizational analysis, the other on the firms current financial- and competitive situation.
2. Executive workshop
Initiating the audit an executive workshop was performed to discuss and find the firms fundamental business model, its strategy and objectives. Interviews with key employees were also performed in order to get the overall perspective of the company’s current status.
What are the differentiating factors of a company obtaining a competitive advantage and how they go about achieving it are commonly expressed by its mission statement and values. A mission statement gives the answer to the question “why we exist” while the values defines a company’s guiding principles on what type of behavior is used in doing its business on a day-to-day basis. In the case of BDAB its fundamentals can be seen in table 1
BDAB fundamentals
Mission Having a close customer relationship we deliver unique product and services as well as offering off the shelf hardware needs by efficient and local operations
Values
- Never let profit get in the way of doing what is right for the customer
- Give customers a fair deal. Great customer relationship takes time. Do not try to maximize short- term profits at the expense of building enduring relationships
- Always look for ways to make it easier to do business with us
- Communicate daily with our customers. If they are talking to you they can’t be talking to a competitor - Don’t forget to say thank you
Vision To be the leading supplier of it-systems to small and medium sized businesses within the north-eastern region of Sweden. Table 1
To give a short and briefly formulated roadmap a vision statement helps communicating on where the company wants to go in the future. This can also be seen as the very long term goal which can be used as guidance when setting up short- (1 year) and mid (3-5 years) ranged goals.
The companies short and mid- term goals can be seen in table 2.
Goals
6 satisfied customers by December 2006
Short Increase turnover with 5 MSEK with existing employee resources 12 milj in turnover, net profit 3 years 25%
improve knowledge of customer needs
Mid
increase employee satisfaction
3. Organizational Analysis
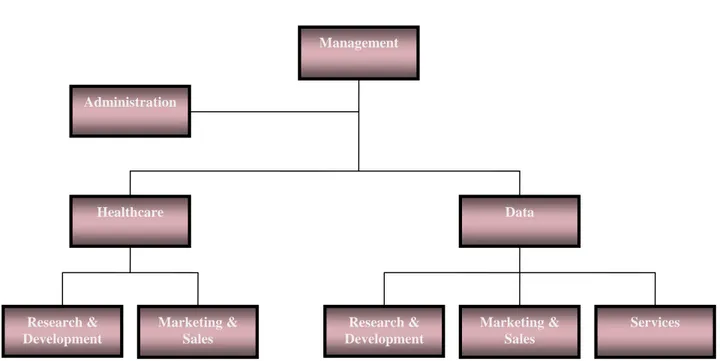
In order to understand how the firm’s organizational system is structured, how the external processes are linked with the internal, organizational analysis is needed. “The three levels of performance [1] approach is a convenient tool for this purpose. First off, a vertical (traditional) map (figure 1) of the organization is
outlined. This does not show how the work is done so a horizontal map (figure 2) is drawn outlining the actual processes taking place.
Marketing & Sales Management Research & Development Data Administration Healthcare Marketing & Sales Research & Development Services
This shows how the internal relation to customer-supplier is linked through products and services. The horizontal links shows the functional boundary interfaces in which, according to Rummler & Brache, “the greatest opportunities for performance improvement can be found. Managers’ primary function is to manage “the white space in between the boxes”.
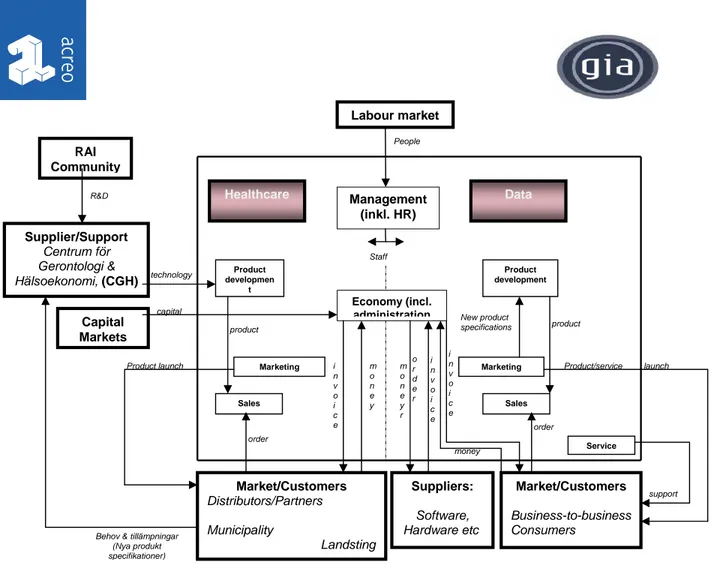
The next step is analyzing the discrepancy between a company’s current and optimal organizational structure and develop a Relationship Map (se figure 3). This shows the interfaces among each function.
Figure 2. Systems (Horizontal) organization chart
Management (incl. administration) Data Healthcare Services R&D RAI Product Developmen t Marketing & Sales Marketing Sales Supplier/Support Centrum för Gerontologi & Hälsoekonomi, (CGH) Customers: Municipalities Healthcare Private firms Suppliers: Software, Hardware etc. Customer: Firms Customer: Consumers R&D Software Development Product specs Product Development orders p r o m o t i o n s Marketing & Sales Marketing Sales orders needs P r o d u c t s p e c s product p r o m o t i o n s p r o m o t i o n s n e e d s s u p p o r t
From the relationship map one needs to identify what process have the most significant impact on performance. In BDAB’s case products & services is their core process (figure4).
Process-steg KUND MARKNADSFÖRING FÖRSÄLJNING LEDNING EKONOMI PRODUKT UTVECKLING LEVERANTÖR (CGH) 1 2 3 4 5 6 (i). Ny produkt strategi & plan utvärderad årligen (ii). Nya produktide'er screeenade och prioriterade (på hallvårsbasis) produktidé utprovas produkt ideér produkt test data produkt parametrar satta Marknadsutvärdering & försäljningsprognons förslag färdigställs teknisk utvärdering pro duk t s pec ifik at ione r te k n is k t fö rs la g Ny produkt prioriterad, budgeterad och tidsplanerad produkt utvecklas försäljnings förberedelser f) a) d) b) c) e) 9 8 7 produkt lanseras beställning mottagen
faktura skickas betalning mottagen
produkt levereras kund konto uppdateras
försäljning av produkt monitoreras
(i). Försäljning av ny produkt utvärderas (ii). Utvärdering av nuvarande status på produktutveckling jämförd mot ursprunglig planering (kvartalsvis)
lämpliga åtgärder beslutas
öka omsättning 5 Mkr /år Vinst inom 3 år 25% av omsättning Inom 3 år öka antal anställda med minst 6 personer
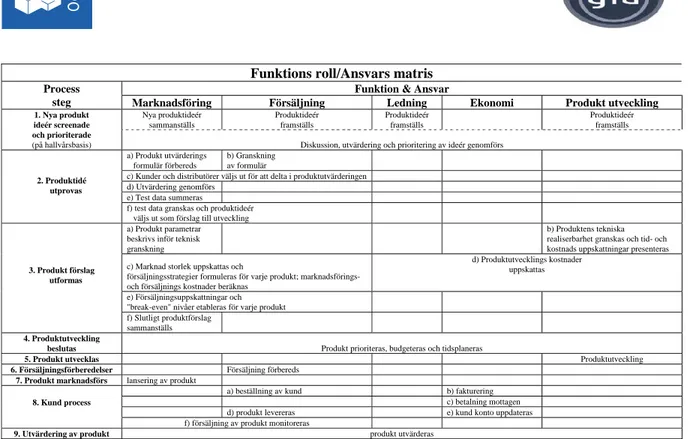
Once the core process has been identified a function role/responsibility matrix is outlined in order to split up the responsibilities between departments for each subprocess (figure 5).
Data Healthcare Supplier/Support Centrum för Gerontologi & Hälsoekonomi, (CGH) Product developmen t Marketing Sales Market/Customers Distributors/Partners Municipality Landsting Suppliers: Software, Hardware etc. Product development technology Marketing Sales Management (inkl. HR) Economy (incl. administration Service Market/Customers Business-to-business Consumers RAI Community
Behov & tillämpningar (Nya produkt specifikationer) R&D Labour market People Staff support i n v o i c e i n v o i c e order order Product/service launch New product specifications Product launch money m o n e y r i n v o i c e m o n e y product product Capital Markets capital o r d e r
Figure 3. Relationship map
Funktions roll/Ansvars matris Funktion & Ansvar Process
steg Marknadsföring Försäljning Ledning Ekonomi Produkt utveckling
Nya produktideér sammanställs Produktideér framställs Produktideér framställs Produktideér framställs 1. Nya produkt ideér screenade och prioriterade
(på hallvårsbasis) Diskussion, utvärdering och prioritering av ideér genomförs a) Produkt utvärderings
formulär förbereds
b) Granskning
av formulär
c) Kunder och distributörer väljs ut för att delta i produktutvärderingen
d) Utvärdering genomförs
e) Test data summeras
2. Produktidé utprovas
f) test data granskas och produktideér
väljs ut som förslag till utveckling a) Produkt parametrar
beskrivs inför teknisk
granskning
b) Produktens tekniska realiserbarhet granskas och tid- och kostnads uppskattningar presenteras c) Marknad storlek uppskattas och
försäljningsstrategier formuleras för varje produkt; marknadsförings- och försäljnings kostnader beräknas
d) Produktutvecklings kostnader uppskattas e) Försäljningsuppskattningar och
"break-even" nivåer etableras för varje produkt 3. Produkt förslag
utformas
f) Slutligt produktförslag
sammanställs
4. Produktutveckling
beslutas Produkt prioriteras, budgeteras och tidsplaneras
5. Produkt utvecklas Produktutveckling 6. Försäljningsförberedelser Försäljning förbereds
7. Produkt marknadsförs lansering av produkt a) beställning av kund b) fakturering
c) betalning mottagen
d) produkt levereras e) kund konto uppdateras 8. Kund process
f) försäljning av produkt monitoreras 9. Utvärdering av produkt produkt utvärderas
As previously mentioned, BDAB’s main core process is products & services. Functioning as a (i). retailer of hardware goods obtaining its competitive advantage by supplying differentiating services to its customer base and (ii). developing customized software for different applications both for business to business as well as to consumer markets . Initially, textbooks and teaching aids (see ”bolagsordning”, section B in appendix) were manufactured but this is a small portion of their activities today.
4. Benchmarking to Competitors
There are five companies in the county of Gävleborg who are BDAB’s main competitors: Xellent Service i Västernorrland AB, Kontorscenter, Koneo AB, El-Giganten Grossist AB, P.O. Radio TV AB (table 4).
Company Core process
Xellent Service i Västernorrland AB Sales and services of office machines and adjacent activities
Kontorscenter Sales and services of office equipment and machines, perform capital
investments and adjacent.
Koneo AB Sales and services of office equipment and related products like computer
products and systems, documentation, office machines and furniture, consulting services within data- and telecommunication and adjacent activities..
El-Giganten Grossist AB Sales and services within radio- and TV markets and adjacent activities
P.O. Radio TV AB Sales and services of radio, TV and adjacent products and activities Table 4. Competitors to BDAB.
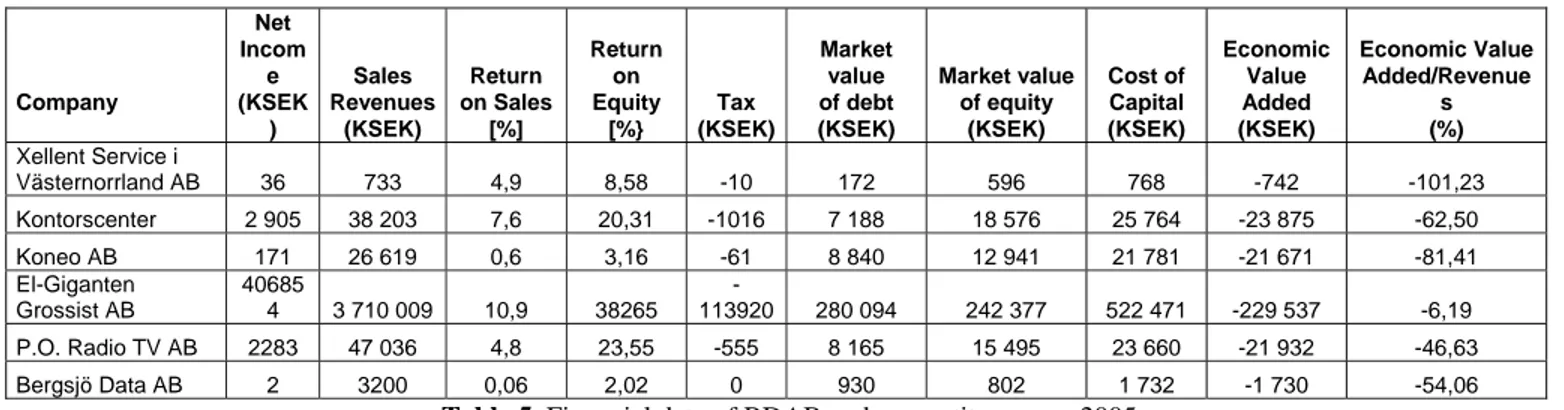
The competition is fierce within this market segment. In combination with a strong pressure on price this leads to small profit margins. It is quantified in table 5 showing respective company’s financial data (see also section B in appendix) for 2005. To evaluate a company’s financial growth a common parameter used is what’s known as EVA, which stands for”Economic Value Added”. It’s defined as
EVA = Σnet income + Σtax - Σcost of capital (1) It reflects a firm’s real financial profit over time. In the below cases EVA turn out with a negative value which confirms the maturity of the market segment and the local competitive situation. To get a suitable comparison the EVA parameter is divided by respective firm’s revenues (last column, table 5). In Xellent’s case a negative growth of ~100% of their revenues is shown which should make them re-evaluate their business model. El-giganten has, not surprisingly, a minor negative growth factor. Thanks to purchasing in large volumes, a fast and efficient distribution system they can obtain extra (profit) margins which are so important to be successful in this market. BDAB has a ~ 50% negative growth which, in comparison to other small enterprises, is a relative low value but should awake interest reviewing their current business model. Fortunately, BDAB has already initiated this process (see below).
Company Net Incom e (KSEK ) Sales Revenues (KSEK) Return on Sales [%] Return on Equity [%} Tax (KSEK) Market value of debt (KSEK) Market value of equity (KSEK) Cost of Capital (KSEK) Economic Value Added (KSEK) Economic Value Added/Revenue s (%) Xellent Service i Västernorrland AB 36 733 4,9 8,58 -10 172 596 768 -742 -101,23 Kontorscenter 2 905 38 203 7,6 20,31 -1016 7 188 18 576 25 764 -23 875 -62,50 Koneo AB 171 26 619 0,6 3,16 -61 8 840 12 941 21 781 -21 671 -81,41 El-Giganten Grossist AB 40685 4 3 710 009 10,9 38265 -113920 280 094 242 377 522 471 -229 537 -6,19 P.O. Radio TV AB 2283 47 036 4,8 23,55 -555 8 165 15 495 23 660 -21 932 -46,63 Bergsjö Data AB 2 3200 0,06 2,02 0 930 802 1 732 -1 730 -54,06
Table 5. Financial data of BDAB and competitors anno 2005.
From annual reports one can conclude that BDAB’s share capital is relatively highly mortgaged which makes them vulnerable to quick changes. One way to avoid this may be to obtain outside investors to raise the share capital making them partners in the company.
BDAB are in advanced stage of planning to expand their activities within the elderly healthcare business. This strategy seems very promising as many investigations points to an aging population demanding greater and more efficient resource allocation then ever before. In comparison to competitors their concept seems highly attractive.
In their more adjacent activities (local hard- and software sales of products and services) they can
differentiate more. By obtaining an intimate customer relationship, primarily business-to-business, they
can provide a packaged solution highly customized to customer’s needs. Their offer is attractive on price, technology and services. In practice, ”to find an area in between the highly competitive hard- and software
suppliers and their (business) customers, doing what the customer can’t or don’t want to do”. To become less
price sensitive they can sell multiple products (more than three) and services (installation, programming, service and support) per company, preferably setting up agreements (support, upgrading etc.) for a longer period of time. In this way BDAB has the opportunity to gain competitive advantage by obtaining information of a company’s needs, adjust accordingly offering attractive package solutions which makes the client less inclined to switch supplier.
5. Identifying Measures
In order to find out on how the organization can align the core process with its overall strategies and goals
measures are needed to be identified. These will help to keep track on how different parts of the organization
are progressing and how they benefit the overall objectives.
Financial measures are the most important measures which should relate to economic growth, profitability,
and value creation. Commonly used financial measures can be seen in table 6.
Financial Measures
Sales (own products, rental income on webportals and broadband) Lag
Cash Lead
Postal giro Lag
Bank Lag Weekly net income per employee Lead
Goods claims Lead
Short time inventories Lag
Telephone costs Lag
Internet costs Lag
Car- and fuel costs Lag
Table 6 financial measures
Customer measures in BDAB’s case is Product leadership and Customer Intimacy oriented. Customer Measures
Deviation and complaints per customer Lead Total amount of solutions per client Lead Percentage of employees with access to customer data Lead
Amount of customer awards won Lag
Amount of employee’s at customer site Lead Table 7 customer measures
Employee Learning and Growth measures are
Employee Learning & Growth
Percentage of the employees who achieves their personal goals Lag
Competence inventory Lead
Competence to obtain competitive advantages/strategic goals Lag Table 8 employee learning & growth measures
To keep it simple and useful, most parameters introduced are already to some extent used within the organization. The criteria used by Niven [2] is followed as a rule of thumb
Develop unique combinations of products & services. Provide short time span between order and delivery; fast and efficient support.
In
tern
al
Lag Measures Lead Measures
Employee discussion of how job roles complement each other; how routines and documentation is part of the quality system laying the foundation of long term growth meeting strategic goals
E.L. & G.
Offer close, efficient support, fast delivery and service
Custo
m
er
Increase revenue by 5 Mkr annuallyFinancial
Measures
Objectives
Deviation & complaints per customer Total amount of solutions per client
Percentage of employees with access to customer data
Customer loyalty
Amount of employee’s at customer site
Competence inventory of the emplyees at ”utvecklingssamtal” Competence to obtain competitive advantages/ strategic goals Amount of customer awards won Develop products & services
Amount of new products & services invoiced
Revenue Growth Revenue
Cash
Postal giro
Bank
Weekly net revenue per employee
Goods claims Result Short time inventories Phone expenses Internet expenses
Car- and fuel expenses
Figure 5 Strategy map