Research
SKI Report 2007:03
Variability and Uncertainties of Key
Hydrochemical Parameters for SKB Sites
Adrian Bath
Hans-Peter Hermansson
December 2006
SKI-perspective
Background
An important part of the site investigations conducted by the Swedish Nuclear Fuel and Waste Management Company (SKB) is the characterisation of groundwater chemical conditions in the deep bedrock environment where a final repository for spent nuclear fuel is planned to be located. This work is currently in its final stages at the two candidate sites, Forsmark and Laxemar, and should be completed by the summer of 2007. It is essential that the information which is gathered is of high quality and representative of conditions in the environment of consideration. Parameters of particular interest are those that are related to SKB´s suitability criteria such as Eh, pH
and salinity, but a range of other geochemical parameters are also needed to establish a sufficient site understanding. The process of extracting the required information has been more problematic than expected during the early stages of the site investigations, and it is therefore of key interest to evaluate this part of the site investigation
programme in more detail.
Purpose of the project
This project includes an assessment of geochemical information (available at the time) related to the Eh and pH in the deep bedrock environment. The purpose is to evaluate
the uncertainties in these parameters and the level of understanding of the fundamental processes that control them.
Results
The result of this study is an identification and evaluation of sources that contribute to uncertainty and spatial variability in key geochemical parameters. Uncertainty limits are discussed based on geochemical modelling of redox controlling chemical reactions.
Future work
There is a need to follow up SKB’s groundwater sampling and characterisation after the completion of the ongoing site investigations. There is also a need to follow up the use of the conceptual understanding of geochemical processes in safety assessment. In safety assessment it is not sufficient to understand the present day conditions, possible future perturbations to groundwater conditions must also be assessed.
Project Information
SKI Project Manager: Bo Strömberg Project Identification Numbers: 200609028 (Bath)
Research
SKI Report 2007:03
Variability and Uncertainties of Key
Hydrochemical Parameters for SKB Sites
Adrian Bath
Intellisci Ltd, Willoughby on the Wolds, Loughborough LE12 6SZ, UK
Hans-Peter Hermansson
Studsvik Nuclear AB, SE-611 82 Nyköping, Sweden
December 2006
This report concerns a study which has been conducted for the Swedish Nuclear Power Inspectorate (SKI). The conclusions and viewpoints presented in the report are
Summary
The work described in this report is a development of SKI’s capability for the review and evaluation of data that will constitute part of SKB’s case for selection of a suitable site and application to construct a geological repository for spent nuclear fuel. The aim has been to integrate a number of different approaches to interpreting and evaluating hydrochemical data, especially with respect to the parameters that matter most in assessing the suitability of a site and in understanding the geochemistry and
groundwater conditions at a site. It has been focused on taking an independent view of overall uncertainties in reported data, taking account of analytical, sampling and other random and systematic sources of error. The insights and principles that are discussed here should be applicable for evaluating key hydrochemical parameters for SKB’s target sites at Forsmark and Laxemar.
This evaluation was carried out initially with a compilation and general inspection of data from the Simpevarp, Forsmark and Laxemar sites plus data from older ‘historical’ boreholes in the Äspö area. That was followed by a more specific interpretation by means of geochemical calculations which test the robustness of certain parameters, namely pH and redox/Eh (which is a proxy for dissolved oxygen). Geochemical model
calculations have been carried out with widely available computer software. Data sources and their handling were also considered, especially access to SKB’s SICADA database. Direct access to SICADA has not been established in the way that was originally intended. Instead, extracts from SICADA provided by SKB as well as data from SKB’s P- and R-reports have been used for the present work.
In preparation for the use of geochemical modelling programs and to establish comparability of model results with those reported by SKB, the underlying
thermodynamic databases were compared with each other and with other generally accepted databases. Comparisons of log K data for selected solid phases and solution complexes from the different thermodynamic databases were made. In general, there is a large degree of comparability between the databases, but there are some significant, and in a few cases large, differences. The present situation is however adequate for present purposes. The interpretation of redox equilibria is dependent on identifying the relevant solid phases and being able to characterise them thermodynamically.
Geochemical modelling with the MEDUSA program and the HYDRA thermodynamic database was used to construct a set of Eh/pH diagrams for the iron and sulphur system
in Forsmark groundwaters.
Geochemical modelling with the PHREEQCI program was used for two purposes connected with uncertainties in key hydrochemical parameters: (i) to adjust pH to compensate for CO2 outgassing on the basis of an assumption that in situ groundwater
should be at equilibrium with calcite, and (ii) to evaluate the hypothetical Eh on the
basis of assumed control by Fe3+/Fe2+, Fe(OH)3/Fe2+ and SO42-/HS- redox couples so as
to assess evidence for control and buffering of redox and for reactivity of other redox-sensitive parameters. These calculations were carried out with reported groundwater data from Forsmark and Simpevarp sites and also from the Äspö HRL. No data were
yet reported from new boreholes at the Laxemar site at the time of carrying out this geochemical modelling.
It is emphasised that the purpose of these calculations is to explore and illustrate the theoretical basis of geochemical interpretations, and to understand what are the assumptions, simplifications and uncertainties in interpreting hydrochemical data especially redox and pH. Though the aim is not just to make a repeat calculation of redox values with similar modelling as those reported in SKB’s site descriptive model reports, the agreement from doing this is reassuring in terms of basic model consistency. Deviations of ±10 mV are attributable to minor differences in thermodynamic data and other model inputs. This work has been concerned with uncertainties in a broader context than just that of geochemical modelling uncertainties.
Some of the conclusions from geochemical modelling are:
(i) pH data, when adjusted to compensate for CO2 outgassing, are typically 0.2 to 0.4
pH units lower than the measured values, which suggests one aspect of uncertainty in measured pH values.
(ii) Most measured pH/Eh points for Forsmark are located close to the HS-/SO42- line in
an Eh/pH diagram, suggesting that the couple HS-/SO42- controls Eh at normal SO4
2-concentrations (above about 0.5 mM and around 5 mM).
(iii) Eh calculated from the couples SO42-/HS- and Fe(OH)3/Fe2+are rather close to the
measured Eh in most cases. In contrast, the Eh calculated from the Fe3+/Fe2+ couple is
oxidising, i.e. a positive Eh, which is the result of erroneous Fe3+ values obtained by
subtraction of Fe2+ from Fetotal.
(iv) There are high uncertainties in EhSO4/HS for Forsmark samples because HS- data are
near or at the analytical detection limit. pH is an important factor in modelled Eh values
and in the cumulative uncertainty about redox interpretation. A potential difference of about -50 mV could for example be explained by an error in pH of about 0.7.
(iv) There are typical differences of -30 to -50 mV and +50 mV between measured Eh
and EhSO4/HS and EhFe(OH)3/Fe2+ respectively. Therefore ±100 mV is a cautious
assumption for the uncertainty on redox estimations from Eh measurements and from
redox modelling.
Some other general conclusions are:
(i) Uncertainty in all hydrochemical data arises from the effect of mixing with flushing or other extraneous water. The perturbations of pH and redox by such mixing are non-linear and not reliably estimated or predicted and are thus included in the overall uncertainty estimate.
(ii) Salinity and the underlying measurements, namely electrical conductivity, TDS and chloride, are less prone to significant uncertainties than pH and redox. The estimated maximum overall uncertainty quoted by SKB is ±10% and this seems to be reasonable but is valid only for samples which comply with SKB’s acceptability criterion of <1% flushing water (or perhaps up to <5%).
(iii) Raw data for chloride and TDS could be corrected for dilution by flushing water, using the simple tracer data and/or results from the drilling impact (DIS) study method; SKB have done this only for one set of water samples from Simpevarp.
(iv) There have not been sufficient data reported so far for DOC, colloids, microbes and other parameters that relate to SKB’s ‘suitability criteria’ or other important aspects of site geochemistry to make an independent assessment of the uncertainties.
Sammanfattning
Det arbete som redovisas i denna rapport är en del av SKIs kompetensutveckling inför granskning och utvärdering av data som kommer att ingå i SKBs underlag för platsval och ansökan om att bygga ett slutförvar för använt kärnbränsle. Målsättningen har varit att sammanföra ett antal olika sätt att tolka och utvärdera vattenkemiska data, speciellt vad gäller de parametrar som betyder mest för att avgöra lämpligheten i ett platsval och för att förstå geokemin och grundvattnets egenskaper på en vald plats. Arbetet har fokuserats på att göra en fristående värdering av osäkerheter i rapporterade data och att därvid ta hänsyn till fel i provtagnings- och analysförfaranden ävensom tillfälliga och systematiska felkällor. De insikter och principer som redovisas och diskuteras här bör kunna användas för att utvärdera vattenkemiska nyckelparametrar hos SKBs
kandidatplatser i Forsmark och Laxemar.
Utvärderingen påbörjades med en sammanställning och allmän granskning av data från Simpevarp, Forsmark och Laxemar, samt från äldre “historiska” borrhål i Äspö
området. Detta arbete följdes av mer specifika tolkningar genom geokemiska
beräkningar för att pröva kvalitén hos huvudparametrarna pH och redox/Eh (som markör
för löst syre). De geokemiska modellberäkningarna har utförts med allmänt tillgängliga datorprogram.
Datakällor och deras handhavande har också värderats. Speciellt gäller detta tillgång till SKBs databas ”SICADA”. Direkt access till SICADA har inte kunnat upprättas så som ursprungligen var meningen. Istället har utdrag ur SICADA använts i den form de erhållits från SKB, såväl som data från SKBs P- och R- rapporter.
För att uppnå kompatibilitet mellan våra modelleringsresultat och SKBs data krävs naturligtvis rättvisande användning av de geokemiska modelleringsprogrammen. Därför var det en viktig startåtgärd att kontrollera underliggande termodynamiska databaser gentemot varandra och mot andra allmänt accepterade databaser. Log K data för utvalda fasta faser och lösliga komplex från de olika databaserna jämfördes. Allmänt sett är kompatibiliteten stor, men det finns några signifikanta och i ett fåtal fall stora
avvikelser. Den nuvarande situationen har dock bedömts som adekvat för detta arbete. Tolkningen av redox jämvikter beror bl.a. av att relevanta fasta faser säkert identifieras och att det är möjligt att karakterisera dem termodynamiskt.
Programmet MEDUSA och databasen HYDRA har använts för att beräkna och rita ett antal Eh/pH diagram för järn och svavel systemen gällande grundvatten i Forsmark.
Geokemisk modellering med PHREEQCI programmet gjordes av två anledningar som hade samband med osäkerheten hos de hydrokemiska nyckelparametrarna: (i) för att justera pH med avseende på CO2 förluster vid provtagning under antagande av att
in-situ grundvatten bör vara i jämvikt med kalcit, och (ii) för att utvärdera hypotetiska Eh
med antagande av att Eh bestäms av redoxparen Fe3+/Fe2+, Fe(OH)3/Fe2+ respektive
SO42-/HS-. Detta för att kunna värdera indikationer på hur kontroll och buffring av
redox sker, samt för att uppskatta inverkan av andra redox känsliga parametrar.
Beräkningarna utfördes på rapporterade grundvattendata från Forsmark och Simpevarp, samt också på data från Äspö HRL. Inga data hade ännu rapporterats från nya borrhål i Laxemar vid tiden för denna geokemiska modellering.
Det skall framhållas att syftet med beräkningarna är att utforska och illustrera den teoretiska bakgrunden till de geokemiska tolkningarna och att förstå vilka antaganden, förenklingar och osäkerheter som förekommer när vattenkemiska data, speciellt redox och pH, tolkas. Även om syftet inte enbart är att upprepa beräkningar av redox värden med liknande beräkningsmetoder som beskrivs i SKBs platsbeskrivningsrapporter, kan den överensstämmelse som erhålls genom att göra detta skapa tillförsikt. Detta gäller både grundläggande överensstämmelse mellan beräkningssätten och slutsatsen att resultatavvikelser på ±10 mV kan hänföras till mindre skillnader i termodynamiska data och andra beräkningsunderlag.
Några av slutsatserna från den genomförda geokemiska modelleringen är:
(i) pH data som kompenserats för CO2 förlust ligger typiskt 0.2 till 0.4 pH enheter lägre
än uppmätta värden. Detta implicerar en osäkerhetsaspekt hos uppmätta pH-värden. (ii) De flesta uppmätta pH/Eh par för Forsmark ligger nära HS-/SO42- linjen i ett Eh/pH
diagram. Detta implicerar att redox paret HS-/SO42- kontrollerar Eh vid normala SO4
2-koncentrationer (över ca. 0.5 mM och omkring 5 mM).
(iii) Eh beräknat från paren SO42/HS- och Fe(OH)3/Fe2+ ligger ganska nära de uppmätta
Eh värdena i de flesta fall. Som kontrast skall nämnas att Eh beräknat från redox paret
Fe3+/Fe2+ blir oxiderande, dvs. positivt, om de felaktiga Fe3+ värden används som erhålles om Fe2+ subtraheras från Fetotal.
(iv) Osäkerheten i EhSO4/HS för Forsmark prover är hög eftersom HS- data ligger nära
eller på den analytiska detektionsgränsen. pH är en viktig faktor för enskilda beräknade Eh värden och dessutom för den ackumulerade osäkerheten vid tolkningar av redoxdata.
Exempelvis kan en potentialdifferens på ca. -50 mV förklaras av ett fel i pH på ca. 0.7 pH enheter.
(iv) Typiska avvikelser mellan uppmätta Eh och beräknade EhSO4/HS respektive
EhFe(OH)3/Fe2+ ligger på -30 to -50 mV respektive +50 mV. Därför torde ±100 mV vara en
försiktig angivelse av osäkerheten mellan redox uppskattningar från Eh mätningar och
motsvarande redox beräkningar. Ytterligare allmänna slutsatser är:
(i) Provkontamination med spolvatten och annat främmande vatten påverkar alltid alla vattenkemiska data. Störningarna i pH och redox genom sådan vattentillblandning är icke-linjära och kan inte uppskattas eller förutses på ett säkert sätt. De inräknas därför i den övergripande uppskattningen av osäkerheten.
(ii) Salinitet och den bakomliggande mätningen, nämligen av elektrisk konduktivitet, TDS och klorid, är mindre utsatta för signifikanta osäkerheter än pH och redox. Den uppskattade maximala totala osäkerheten som anges av SKB är ±10% och denna verkar vara rimlig. Dock gäller den endast för prover som överensstämmer med SKB’s
acceptanskriterium på <1% spolvatten (eller möjligen upp till <5%).
(iii) Rådata för klorid och TDS kan korrigeras för utspädning med spolvatten. För korrektion används enkla tracer data och/eller resultat som erhållits med “drilling impact” (DIS) metoden; SKB har genomfört denna korrektion enbart för en uppsättning av provvatten från Simpevarp.
(iv) Ännu så länge har tillräckliga data ej rapporterats för DOC, kolloider, mikrober och andra parametrar som relaterar till SKB’s ‘suitability criteria’ eller andra viktiga
aspekter av platsgeokemin för att kunna göra en fristående värdering av osäkerheterna i dessa parametrar.
Contents
1 Introduction... 1
1.1 General Background ... 1
1.2 Detailed Objectives and Scope of Work... 2
1.3 Contents of Report ... 4
2 Data Acquisition Methods and Reporting ... 5
2.1 Method Documents (MDs) ... 5
2.2 Reporting of Data Acquisition ... 6
2.3 Data Processing and Storage... 8
2.4 Field Technical Review, June 2006 ... 8
3 Data and Uncertainties in In-Situ Compositions ... 10
3.1 SKB’s Data for Key Parameters ... 10
3.2 Reported Uncertainties... 10
3.3 Sampling Artefacts, Flushing Water Effects and CO2 Outgassing... 11
3.4 Geochemical Modelling of pH and Redox ... 13
3.4.1 Geochemical Modelling Software ... 13
3.4.2 Review of Thermodynamic Databases ... 14
3.4.3 Modelling of pH and Redox in Forsmark... 15
3.4.4 Modelling of pH and Redox in Forsmark and Simpevarp Groundwater Samples... 17
3.5 Ranges of Uncertainties ... 20
3.5.1 pH ... 20
3.5.2 Redox... 21
3.5.3 Salinity... 22
3.5.4 Other Parameters (DOC, colloids, microbes)... 22
4 Spatial Variability... 23
4.1 Limited Distribution of Data... 23
4.2 Geochemical Conditions at Repository Depth... 23
5 Summary and Conclusions... 24
6 Bibliography ... 28
Appendix 1: Method Documents (MDs)... 30
Appendix 2: SKB’s P reports ... 33
Appendix 3: Temporary spreadsheet ... 36
Appendix 4: Comparison of log K values... 41
1
Introduction
1.1 General Background
The work described in this report is a development of SKI’s capability for the review and evaluation of data that will constitute part of SKB’s case for selection of a suitable site and application to construct a geological repository for spent nuclear fuel. It has been carried out by Studsvik Nuclear AB and Intellisci Ltd in collaboration on separate orders from SKI.
The collaborative work between the authors was started as a planning meeting at Studsvik on November 18, 2004. The objectives of this meeting were to establish a working contact between the participants and to define literature entries, computer programs and databases to be used in this work. Working meetings between the authors were held at Studsvik on January 17-18, 2006 and at Intellisci on April 3-4, 2006. One of the categories of site-specific data which is being acquired by SKB for its candidate siting areas at Forsmark and Laxemar is chemical compositions of
groundwaters. Some of these hydrochemical parameters have a direct significance to the performance of the engineered barrier system (EBS) and have therefore been included in a list of ‘suitability indicators’ that SKB identified for evaluation in site investigations [1]. Among these suitability indicators are pH, dissolved oxygen and salinity. A broader set of geochemical parameters that are obtained from site investigations are of indirect importance for site characterisation and ‘site understanding’.
The geoscientific background for SKI’s requirements with respect to the suitability indicators and other geochemical data has been discussed in a previous report in which issues relating to sampling, analyses and interpretation were covered [2]. SKI put large emphasis in the evaluation of these criteria and to understand and to help this work the intention is to have modelling work going on. This is done in order to assure the robustness of the SKB’s conclusions and via consultants to judge the quality and comprehensiveness of the flow of SKB data and criteria and to develop a reference tool for the judgment of various safety critical processes.
The aim of the present report is to illustrate a method for evaluating key hydrochemical parameters for the SKB sites Forsmark and Laxemar. This evaluation is carried out initially with a compilation and general inspection of data and then a more specific interpretation by means of geochemical calculations which test the robustness of certain parameters, namely pH and redox/Eh (which is a proxy for dissolved oxygen).
Geochemical model calculations have been carried out with widely available computer software. The work is a continuation of that reported in [3] for which the focus was on planning of subsequent work, on the review and selection of a computer program and thermodynamic database, and on preliminary geochemical model calculations. The present report accounts for work performed.
Preparatory tasks in the preliminary phase of the project (before the present report) included agreeing approaches for the selection and basic checking of data, for reviewing and selecting thermodynamic databases, and for calculating chemical equilibria. In
particular, the method for calculating redox/Eh as represented by Fe, S and other
redox-sensitive geochemical parameters was examined so as to assess evidence for control and buffering of redox and for reactivity of other redox-sensitive parameters.
Data sources and their handling were also considered, especially access to SKB’s SICADA database. However, direct access to SICADA has not been established in the way that was originally intended. Instead, extracts from SICADA provided by SKB as well as data from SKB’s P-reports have been used in the present work.
1.2 Detailed Objectives and Scope of Work
Summary of objectives
− To have a compilation of the relevant site-specific hydrochemical parameters from SKB’s sites and of the data commentaries provided by SKB in SICADA and P-reports;
− To add independent comments on data suitability for use in site assessment; − To test the internal consistency of hydrochemical data with general geochemical
concepts as an additional way of assessing uncertainties;
− To be able to advise SKI about the robustness and significance of SKB’s data and the resulting conclusions about site suitability on the basis of understanding the
uncertainties in data due to the practicalities of sampling and measurement and due to the geochemical context of measurements.
Scope of work to reach the objectives
− Compilation of relevant data from SKB’s spreadsheets published with the
hydrochemistry R-series reports supporting Site Descriptive Models (SDMs) and from raw data in the site investigation P-reports, plus recommendations and comments from field staff and/or interpretation team on data representativity and other aspects of data quality (e.g. drilling water contents, instrument calibration and malfunction).
− Check for data completeness – understand reasons for data “gaps” by reference to SICADA, SKB reports, and by enquiry to SKB; examine field and analytical data for redox species: Eh, Fe(total), Fe2+, SO42-, HS-, CH4, Utot and Mn for anomalous values
and raise queries with SKB if necessary; consider reliability of redox-sensitive species especially Fe and S data.
− Assessment of geochemical modelling software; the most widely used of the geochemical modelling codes, PHREEQCI v.12 [4] was selected; KTH’s MEDUSA/HYDRA code [5] was also used.
− Comparison of thermodynamic databases supplied with PHREEQCI v.12 and used in other projects for equilibrium modelling of geosphere species, reactions and
minerals.
− Evaluation of reported data for key geochemical parameters that are of primary significance for performance assessment.
− Observation of the practicalities of field data acquisition, instrument calibration and data processing in a visit to the Forsmark site (in conjunction with a Field Technical Review, FTR, for SKI/INSITE).
− Examination of pH data for evidence of shift due to CO2 loss or other perturbations;
use of geochemical speciation and equilibrium software to adjust pH on basis of in-titration of CO2 to calcite equilibrium, noting sensitivity to perturbation.
− Interpretation of the chemical equilibria that are expected to be involved in
controlling pH and redox in the system using geochemical equilibrium modelling of redox couples: Fetot or Fe2+/Fe(OH)3, HS-/SO42-, CH4/CO2, Utot/UO2 using reported
and adjusted pH values; assessment of uncertainty range for redox couples corresponding to uncertainty range of pH; assessment of overall uncertainty in reported redox and estimate range of reliability.
− Use of Pourbaix-type diagrams to examine where the reported data plot relative to the species predominance boundaries for expected equilibria in pH-Eh space.
− Assessment of the overall reliability and adequacy of presently-available data for suitability indicators, especially pH, Eh, salinity, DOC, etc.
− Comment on the spatial distribution of data (areal distribution, depth distribution especially with respect to repository depth, correlation with geological units, major structural features, etc).
− Review of geochemical equilibria and ongoing mineral alterations in the
groundwater system to understand the water-mineral reactions that reach equilibrium in the undisturbed groundwaters, and also those reactions that have varying degrees of kinetic controls. (Phase 2 task)
− Review of SKB’s geochemical model for the buffering of redox conditions at repository depth and for the attenuation of dissolved oxygen in an oxygenated infiltration scenario; assessment of SKB’s mineralogical database for this model.
(Phase 2 task)
− Assessment of the effects of future changes in groundwater salinities on the speciation of ligands and radionuclides. (Phase 2 task)
1.3 Contents of Report
Chapter 2 describes the information and data that SKB produces and that have been the basis for the preparation of this report. Methods Documents (MDs) are the main source of information about sampling, analytical and data processing procedures. SKB’s series of P reports, publishing raw data and preliminary discussions of site investigation tasks, and R reports, publishing the site descriptive models (SDMs), plus the SICADA
database are the data sources.
Chapter 3 contains the main body of this report, which is the discussion of various aspects of uncertainties in the groundwater composition data that are reported from SKB’s sites. Reported data for the key parameters are compiled into a temporary database that serves the purposes of this report. Causes of uncertainty in hydrochemical data are discussed, including sampling artefacts such as flushing water mixing and outgassing. Geochemical modelling is used to examine two specific aspects: effect of CO2 outgassing on pH, and consistency between redox data from Eh measurements and
redox-sensitive solutes. Ranges of overall uncertainty in pH and redox are estimated. Chapter 4 makes some general comments about the role of data uncertainty in
understanding spatial variability of geochemical conditions.
Chapter 5 contains a summary of this work and presents a bullet point list of the main conclusions and other comments.
Appendix 1 lists the MDs that are relevant to data acquisition.
Appendix 2 lists SKB’s P reports which describe acquisition of data referred to in this report.
Appendix 3 contains the temporary spreadsheet of hydrochemical data and geochemical modelling results.
Appendix 4 is a tabulation of log K data for selected solution complexes and solid phases, extracted from various thermodynamic databases.
2
Data Acquisition Methods and Reporting
This section describes SKB’s documentation of methods for acquiring hydrochemical data and the report and database sources from which we have compiled data for the key hydrochemical parameters, i.e. parameters that relate to pH and redox and therefore have a direct influence on site suitability and safety performance. It also summarises SKB’s comments concerning data reliability and quantification of uncertainties in the data.
The methods by which water samples are taken, processed and analysed are described by SKB in their ‘Methods Documents’ (MDs). The list of relevant MDs is tabulated here and their topics are summarised. Activities where methods documentation seems to be missing are identified. It would be useful to know whether these are available but not seen by us, or if SKB has yet to complete them.
The main sources from which the data in this report have been compiled are SKB’s printouts from the SICADA database (usually provided as spreadsheets and tabulations in Site Descriptive Model ‘R’ reports) and raw data tables and descriptions in ‘P’ reports which contain raw site investigation data and field observations that relate to data reliability.
A list of available P reports is compiled. There are only a few ‘orphan’ data which have been referred to by SKB in interpretation reports but for which there are no supporting P reports with details of data acquisition.
The original intention was to use direct electronic access to SICADA as the primary means of obtaining data and supporting quality information so as to be independent of SKB’s data extraction routes. The procedure for this turned out to be very difficult and cumbersome, so in actuality SKB’s most recent data extracts from SICADA were used along with the opportunity to raise questions with SKB about specific data issues.
2.1 Method Documents (MDs)
The set of Method Documents or MDs accounted in Appendix 1 describes the handling equipment, procedures, analytical methods, data reduction and reporting employed as SKB performs and reports analyses on groundwater samples taken from boreholes in the candidate sites. The set is a selection of those MDs that are considered to be necessary to fully understand the procedures and to be able to make well-based
judgements of the quality and applicability of produced data. There are also other MDs available but those have been omitted as being less important for the purpose intended here.
The MDs that are available to us at the time of reporting are indicated in the fourth column.
One of the most important of those is considered to be SKB MD 430.017-01 (Nov 2001). The translated title is ‘Description of method for complete chemical characterization using a mobile field laboratory’. This MD describes the
hydrochemical characterization using mobile sampling and field analysis equipment of which SKB has two identical complete units in operation (usually one unit based at Forsmark and one at Laxemar). Each comprises two trailers: one trailer is a mobile laboratory for limited field analyses and processing of water samples for analyses at external laboratories. The other trailer contains equipment to operate the ‘Chemmac’ sampling system which includes ‘surface Chemmac’ and ‘borehole Chemmac’ units for monitoring and sampling respectively of water pumped to the surface from a borehole interval isolated by inflatable packers and of water downhole in the isolated interval. Both Chemmac units monitor the fundamental parameters pH, Eh and temperature.
Dissolved oxygen and electrical conductivity (EC) are also monitored by the surface Chemmac.
MD 430.017-01 contains a good discussion of accuracy of results. Most statements and comments can be supported without qualification and do not require any additional justifications or insights. There are, however, a few statements about criteria for data quality for which the justifications need further explanation or that raise additional questions:
- Why is the addition of flushing water limited to a maximum of 1% of the sampled water? Is this a practical limit?
- It is stated that some chemical parameters, namely Fe(II), alkalinity, HCO3- and HS-,
require analysis within the first day after sampling. This is true, but the motivations for the accepted delay time should be given.
- Have all steps of the procedures employed when using external laboratories been evaluated (certification)?
Analyses of ionic solutes are performed in accordance with SKB MD 450.001. Well proven methods of analysis are used. In addition to limited analyses at the internal SKB laboratory, external laboratories are used which, in the first instance, are accredited. Detection limits and analytical uncertainties may vary but seem to be reasonable for both internal and external laboratories.
In relation to other MDs, there are a few additional questions that are noted in the right hand column of Appendix 1:
- MDs 422.001-02 and 451.013-03, etc. How exactly is ‘treatment, selection and QC of SICADA data’ done?
- MD 434.006-01. How is the electrochemical connection between reference and working electrodes arranged?
2.2 Reporting of Data Acquisition
SKB’s ‘P’ series of reports are the preliminary route for reporting data and supporting information from the site investigations. They are produced by site investigation staff to report outputs from individual tasks (as indicated on the corresponding Activity Plans). In the hydrochemistry part of the investigation, the tasks are for example sampling of water from percussion boreholes, hydrochemical logging with the tube sampling system, and full hydrochemical characterisation. P reports that include
activity reports on hydrochemistry tasks and contain some hydrochemical data (even though much of the data have too low quality and are not used in interpretations) are listed for Simpevarp, Forsmark and Laxemar in Appendix 2.
SKB’s formal route for reporting and interpreting ‘approved’ data is the Site
Descriptive Model (SDM) reports. These are published in the R report series [6-10]. Data from the v1.2 updates of the SDMs for Forsmark and Laxemar were used in this work [9, 10].
There are only a few data that have been used in Site Descriptive Model reports for which the provenance has not been reported in P reports. These are:
Forsmark
HFM05 (0-200.1m) (only lab pH and major element data reported in R-05-17 [9]) PFM000001/7/8/9/10/39 (Private wells) (pH values in SDM report)
Laxemar
HLX18/22/24 (referred to in R-06-12 [10] but no complete data set available)
KLX01 (272-277m) (Chemmac pH, Fe & S species, U isotope values in SDM report) KLX01 (456-461m) (ditto)
KLX01 (680-702.1m) (ditto but only lab pH, plus Eh value)
KLX01 (830-841m) (ditto but only lab pH)
KLX01 (910-921m) (ditto but only lab pH and no U isotope values) KLX01 (999-1078m) (ditto but only lab pH)
KLX02 (798-802m) (ditto but only lab pH and no U isotope values) (2002 sampling) KLX02 (1155-1165m) (ditto but only lab pH) (1999 sampling)
KLX02 (1345-1355m) (ditto but only lab pH) (1999 sampling) KLX02 (1385-1392m) (ditto but only lab pH) (1999 sampling) KLX04 (104-109m) (referred to in R-06-10 but no data available) KLX04 (510-515m) (referred to in R-06-10 but no data available) KLX04 (971-976m) (referred to in R-06-10 but no data available) Simpevarp
KSH02 (422.3-423.3m) (referred to in R-06-12 [10] but no complete data set available). From this comparison of data used in Site Descriptive Models with what has been reported so far in P reports, it is evident that many data from KLX01 and KLX02 have not been subject to the same level of detailed reporting as has been the case for data from the boreholes in the present site investigations. KLX01 and KLX02 were drilled in 1988 and 1993 respectively. KLX02 has been retested and resampled at various times (i.e. in 1997, 1999, 2002) since the initial post-drilling testing. The data referred to above for which there is insufficient supporting information are for samples taken between 1988 and 1990 for KLX01 and in 1999 and 2002 for KLX02.
Downhole Chemmac measurements of Eh in KLX02 during 1993-4 that were reported
in SKB report TR-95-05 [11] have apparently been discounted (i.e. they have not been used in the SDMs for Laxemar), although the reasons for this are not fully explained in the SDMs or in TR-95-05. Eh values for KLX01 (680-702m, tested 1988) and KLX02
(798-802m, tested 2002) have been used in the Laxemar SDM v1.2 (R-06-12, [10]) although the origin and reliability of these data are not adequately explained.
2.3 Data Processing and Storage
As noted above, the reported uncertainties in analyses seem to be reasonable for both internal and external laboratories. A high quality of analytical data is of course necessary as the basis for data entries into the SICADA database. Various data processing steps are involved from the basic raw data stage, via calibration, quality checking, and other methods of data adjustment and selection, to the final data set in the SICADA database.
Raw data for pH and Eh are processed with the program package HILDA. Values of Eh
and pH are calculated from millivolt readings from the corresponding electrodes by applying known values of calibration constants. An MD for HILDA data processing, its usage of calibration constants and how these constants are derived, was not available to this study but the program was seen in use during the field technical review visit in June 2006 (see below).
In general, the collected body of MDs covers most tasks in hydrochemical data acquisition and reporting from the in situ water sample, via downhole and surface monitoring, sampling equipment and methods, to analyses in field and remote laboratories. The methods used for data processing and calibration calculations in HILDA and SICADA appear to be valid and also to be robust against introducing inadvertent errors. However it has not been possible in this study to follow the detail in all of the data handling procedures prior to the final parameter values in SICADA. SICADA does not offer the level of transparency and easy access that would facilitate full review of the data handling procedures and database.
2.4 Field Technical Review, June 2006
The purpose of a Field Technical Review (FTR) is to provide SKI with first-hand knowledge of the methods and technologies that SKB is deploying to acquire data in their site investigations. FTRs are an opportunity for SKI’s advisers, who are involved in the review and evaluation of SKB’s outputs and interpretations of site investigation, to see field methods in ‘real world’ operation, to discuss scientific and technical details with SKB’s field staff and to clarify understanding.
An FTR visit was made to Forsmark in June 2006 and it is fully reported in [12]. Its aims were to (i) understand the procedures for making field measurements and taking samples for the key hydrochemical parameters (pH, Eh, redox-sensitive species, uranine
tracer, chloride, colloids, microbes, organics, dissolved gases, etc) and (ii) discuss the procedures for calibrating and processing data and for selecting data that are
representative of in situ conditions. The scope of the FTR visit covered:
− Up-to-date Methods Documents (MDs) for the procedures and technologies involved in acquisition of hydrochemical data, plus some clarifications of details in these for our information;
− Deployment of the Chemmac tool and system for downhole and surface monitoring of unstable hydrochemical parameters and for water sampling for complete chemical characterisation, plus the issues that account for the success or failure of these operations and also the procedures involved in checking and calibrating electrodes; − Analyses carried out in the on-site laboratory for a limited range of determinands,
and clarifications of some aspects of the data provided by these analyses;
− Processing of data from the Chemmac system with the HILDA software, applying calibrations to raw data, plus the ways that processed data are selected for reporting; − The various methods and instrumentation that SKB have been using to obtain water
samples from boreholes, the experience that has limited the success rate of sampling, and the measures being attempted by SKB for future sampling to achieve an
adequate distribution of reliable samples and data.
The FTR concluded that the methods, equipment, expertise of personnel, and processing and documentation of data are appropriate for the tasks, and that consistency in these and other aspects between the sites is desirable. Obtaining adequate and reliable data is perhaps turning out to be more problematic at both sites than was envisaged. Data adequacy, representativeness and overall confidence will continue to be issues of concern in SKB’s site descriptive models and in the safety assessments. The two main interrelated issues of concern are (i) the performance of the Chemmac tools in achieving an adequate number, distribution and reliability of redox and pH measurements, and (ii) sampling groundwaters that are a representative distribution and that are ‘contaminated’ by negligible amounts of flushing water.
The key to providing assurance that Eh data are representative is the reproducibility of
responses from multiple electrodes downhole and at the surface, combined with demonstration that Eh data are consistent with analyses for the redox-sensitive solutes
such as Fe2+ and HS- and for indicative microbial populations. SKB have taken this approach in interpretations in the hydrochemical Site Descriptive Model reports. The same criterion of reproducibility from multiple electrodes, downhole, at surface and in the laboratory, is applied to assess reliability of pH data. The internal consistency of redox couples with Eh, and the consistency of carbonate equilibria with pH, and their
implications for data uncertainties are examined further in this report.
A lot of effort goes into clean-up pumping to obtain measurements and groundwater samples with the lowest achievable amounts of extraneous water. The additional procedures to quantify flushing water with uranine tracer and to calculate the overall impact with the DIS method are impressive, although so far the latter has been used in only a few cases. A more systematic estimation of the impacts, negligible or otherwise, of extraneous water on hydrochemical and isotopic parameters would further quantify the overall reliability and uncertainties in many parameters that have direct and indirect significance in the assessment and understanding of sites.
3
Data and Uncertainties in In-Situ Compositions
In the following sections, the uncertainties in key hydrochemical parameters areconsidered for each site. To some extent, rather different approaches are used for these evaluations for each site, with respect to geochemical calculation methods and graphical illustration, although they lead to comparable overall implications. The present
intention is that these will be subsequently discussed and compared under a common heading in a final report for this project area.
Originally it was decided that the reference site for geochemical data used in the introductory and training work [1] would be Simpevarp. However, because more preparatory work had already been done on Forsmark data, for which an approved database had been published by SKB, and also because Simpevarp ceased to be a primary candidate for SKB, it was decided to focus on Forsmark data and then to add Laxemar data as they became available.
3.1 SKB’s Data for Key Parameters
A compilation of hydrochemical data from SKB’s site investigations is in Appendix 3. It shows sample information and the principal hydrochemical parameters. These data have been compiled from many different sources (mostly P reports) and are not a direct extract from SICADA, though many data are SICADA extracts that have been reported with the Site Descriptive Models. The compilation has been checked in reasonable detail for transcription errors between the SKB sources and this spreadsheet. Data from this spreadsheet have been used in the geochemical modelling which is reported below. It is emphasised that they have been compiled for this work only and that the overall selection of data has not been checked or approved by SKB. Nevertheless we consider it to be a useful compilation for considering issues of reliability and uncertainties.
3.2 Reported Uncertainties
SKB has reported general uncertainty ranges for analytical methods in [13]. The general uncertainty ranges suggested by SKB for the main hydrochemical parameters are in Table 1.
Uncertainty ranges on specific measurements of pH and Eh are given in the P reports
and are shown in the data table in Appendix 1. For Chemmac measurements of pH and Eh, the uncertainties have been estimated by SKB from the variations between
measurements with different electrodes in the multi-electrode array in the Chemmac tools (downhole and/or surface) and from the residual drift in measurements occurring at the end of the monitoring period.
Typical uncertainties for Chemmac pH data are reported as ± 0.1 to 0.2 and occasionally much higher although in these cases the Chemmac pH data are usually regarded as unreliable because the large-scale drift or electrode discrepancies would usually be associated with an unquantifiable bias. Uncertainty in laboratory measurements of pH is not reported by SKB; in addition to the measurement uncertainty, the possibility of
bias due to pH drift caused by CO2 outgassing or ingassing has to be considered. This
will be investigated later on in this report. Surface Chemmac pH readings may also be slightly biased relative to downhole Chemmac readings due to CO2 outgassing as the
rising water is depressurised.
Table 1. SKB’s general estimates of analytical and overall uncertainties in hydrochemical data
(from P-05-198 [13])
Parameter Measurement uncertainty Estimated overall
uncertainty1 Dissolved oxygen ± 0.2 mg/L 20% Na 4% 10% K 6% 15% Ca 4% 10% Mg 4% 10% Cl (titration/IC) 5%/6% <10%/10% SO4 6% 15% HCO3 4% <10% Fe(tot), Fe2+ 15% (>30 microg/L) 20% Mn 8% 10% HS- ±0.03 mg/L (<0.2 mg/L) DOC 8% 30% 3 H 0.8 or 0.1 TU 1
Estimated overall uncertainty covers sampling and sample handling, as well as analytical uncertainty; it has been estimated by SKB’s expert judgement.
Typical uncertainties for Chemmac Eh data are reported to be ± 10 to 30 mV.
Uncertainties greater than this, e.g. 50 to 100 mV, are likely to be associated with continuing drift of electrode readings and/or inconsistencies between different types of electrodes, so the validity of the uncertainty estimates may be questionable. In many such cases of questionable data reliability, SKB has not attributed an Eh value. The
comparability of Eh measurements from downhole and surface Chemmac sensors, and
their relationship to ‘in situ’ chemical conditions, could be influenced by a number of factors relating to depressurisation, temperature and oxygen leakage in the rising tubing, as well by differences in performance and calibrations of electrodes in the different tools. Apart from direct comparison of Chemmac outputs, the other approach to investigating uncertainties and internal consistency of redox equilibria is to compare direct Eh measurements with Eh values calculated from redox-sensitive couples, i.e.
Fe2+/Fe3+ [or Fe2+/Fe(OH)3], HS-/SO42-, CH4/CO2, and Utot (effectively UVI/UO2).
These redox equilibria are investigated later in this report.
3.3 Sampling Artefacts, Flushing Water Effects and CO
2Outgassing
Physical perturbation and/or chemical contamination during sampling are one of the main sources of uncertainty in hydrochemical data. Physical perturbation (e.g. temperature change, depressurisation, agitation) may cause chemical reactions and outgassing which in turn may cause changes of pH and Eh (see above) and precipitation
of solids or formation of colloids. Chemical contamination and thus reduction of how representative a sample is of in situ conditions in the tested interval may occur due to in-mixing of formation waters from elsewhere in the borehole, mixing with residual
drilling or flushing water, in-gassing of oxygen and other atmospheric gases, or reaction with components of the sampling set-up.
SKB’s sampling equipment design and procedures implement many measures, based on many years of experience and development, to minimise perturbation and contamination of water samples. Examples of these measures are low flow rates to minimise agitation especially around electrode sensors, checking hydraulic pressures inside and outside packered intervals to test for leakage, use of local shallow groundwater as drilling water, and dosing of drilling water with uranine tracer.
Nevertheless to a greater or lesser extent these artefacts and effects influence all water samples taken from deep boreholes and are likely to enlarge the overall uncertainties in their representativeness. The problem is exacerbated in cases where the sampled interval has low transmissivity, which has been the case so far for most of the boreholes at both Forsmark and Laxemar.
Uncertainties introduced due to physical perturbations of pressure and temperature are likely to affect pH, redox, alkalinity and dissolved gases primarily. Reduction of pressure as borehole water is pumped or lifted from a deep interval causes outgassing. The additional uncertainty introduced into data is difficult to quantify except possibly for the case of CO2 loss which can be modelled geochemically (see below). Reduction
of temperature from formation conditions to the surface is a maximum of about 15°C (i.e. maximum formation temperature of about 20°C and minimum handling
temperature of about 5°C). Although solubilities of most solids decrease with
decreasing temperature, the opposite is the case for calcite so precipitation should not be caused by slight cooling and thus should not affect uncertainty in pH and alkalinity. Physical agitation and general effects of transferring water samples (including filtering) could cause iron oxyhydroxide to precipitate as solid or colloid, thus introducing uncertainty into the representativeness of Fe data (and also a slight effect on pH which decreases as OH- is removed into Fe-ox). In-line filtering of water flow from the Chemmac system and use of specified procedures for the respective samples (MD 452.001) should eliminate or minimise perturbations of Fe and pH data. If Fe-ox precipitates are observed in the samples at the time of pH measurement in the field laboratory, then this should be reported along with the pH value.
The three most general sources of chemical contamination that make a borehole sample chemically unrepresentative of the tested formation interval are mixing with
drilling/flushing water, mixing with water from elsewhere in the borehole or formation, and introduction of oxygen. Drilling/flushing water is taken from a nearby shallow (100 to 200m depth) percussion-drilled borehole and is therefore likely to be less mineralised than deeper groundwaters being sampled. It is tagged with uranine tracer and is circulated once only, so progressive in-mixing of formation water does not occur. It is also flushed with nitrogen gas to remove dissolved oxygen. Most likely
contamination is with solutes that are characteristic of shallow fresh groundwater, e.g. NO3-,3H, higher HCO3- with higher 14C. NO3- is not a primary parameter for
interpretation so is not of high significance.
3
H is interpreted as a tracer of young (<50 years old since recharge) groundwater and thus of relatively rapid downflow as it is detected at depth. Maximum 3H levels in
recently-recharged shallow groundwaters in these regions are around 35 TU and values are more usually 10-15 TU. The detection limit for 3H is 0.1 or 0.8 TU depending on the analytical lab and method used. Therefore 1% of such water could introduce 0.1 to 0.3 TU and 5% could introduce 0.5 to 1.5 TU in a deep water sample. Uncertainty in interpreting 3H significance should therefore be considered to be at these levels, since flushing water contents as indicated by the tracer are often accepted above 1% and up to 5% (see Appendix 3).
Changes to HCO3- due to mixing with flushing water are not of primary significance in
hydrochemical interpretation: for example, deep brackish/saline water typically has HCO3- between 10-100 mg/L whereas fresh shallow groundwater typically has 200-300
mg/L. 5% in-mixing of flushing water would therefore raise alkalinity by a minor amount; there would be a corresponding effect on pH but the small change would be covered by the general uncertainty attributed to pH. A more significant uncertainty would be introduced into the interpretation of 14C contents in deep groundwaters. 5% in-mixing of flushing water into a deep saline water with negligible in-situ 14C could raise14C in a water sample to 10 pmC or even more. This would have a significant impact on the interpretation in terms of groundwater ages.
Given proportions of flushing water in-mixing, as indicated by the concentrations of uranine tracer, it should be possible to adjust (or ‘correct’) analytical raw data for the effect of in-mixing to obtain an improved estimate of in situ groundwater composition. Such an adjustment is only practicable for non-reactive solutes that mix linearly. It would also make the assumption that in-mixed contaminating water is all traced, i.e. is derived only from flushing water; in-mixed formation water from other intervals in the open borehole would not be traced in this way. Such a calculation has been reported by SKB only for two samples from one interval in KSH01A (see data line marked ‘calc’ in Appendix 3). Drilling water content was about 10%, so the adjusted major solute concentrations were increased proportionately by about 10-12%. pH was also adjusted resulting in an increase of about 0.4 pH units. The method for adjusting pH is not known, but possibly a geochemical modelling calculation was used, involving mixing of the two component waters and readjustment to calcite equilibrium, i.e. similar to the method used to correct for CO2 outgassing.
3.4 Geochemical Modelling of pH and Redox
3.4.1 Geochemical Modelling Software
The main tool for the modelling work was the PHREEQCI program (v2.12.5-669) with the included thermodynamic database files llnl.dat, phreeqc.dat and wateq4f.dat [4]. The rationale is that PHREEQCI and associated databases are widely used, maintained and well established since a long time; it is also the geochemical modelling program used by SKB. Therefore, there is already a large body of directly comparable PHREEQC/PHREEQCI modelling results available for comparison with the present work. A description of PHREEQCI is given in [1] and a more detailed description can be found in [4].
The thermodynamic program package MEDUSA/HYDRA [5] was also used to construct Pourbaix diagrams for the Fe-S-Cl system as a graphical way of assessing variations of redox equilibria in Eh-pH space.
3.4.2 Review of Thermodynamic Databases
A computer program needs a good and generally accepted database. Coming with PHREEQCI are the thermodynamic databases llnl.dat, wateq4f.dat and phreeqc.dat. The llnl.dat data base is the largest of those but is not completely compatible with the program and there can be errors using it.
Comparisons of log K data for solid phases from the different thermodynamic databases mentioned above were made. Selected complexes and solid phases were compared, essentially of data that will be of significance for the objectives of this work. Values from the PHREEQCI databases have been compared with those found in the HYDRA [5] and PSI/NAGRA databases [14]. It is important that comparisons are made for exactly the same complexes, solid phases and reactions. Because of this, some log K values are directly extracted and others are calculated from other values. The selected data and comments on the comparisons can be seen in Appendix 4. The HYDRA database is the ‘best equipped’ database, containing the largest number of values, and is used as the reference so that Appendix 4 shows deviations of log K values in other databases from those in the HYDRA database. In general, there is a large degree of comparability between the databases, as would be expected because many of the thermodata are from the same original sources. For 35% of the complexes and solid phases, Minteqv4 (Mv4) database has the largest deviation from HYDRA, whilst the llnl database has the next largest deviation in 30% of the cases. In 15% of the cases, the deviation was sufficiently large that it gives rise to doubt over validity of data on one side or the other; half of these cases involved comparison of Mv4 with HYDRA. The databases included in the PHREEQCI package differ in extension and coverage. In many cases, there are large similarities or exact equalities between log K values from the different databases, but there are also some significant and in a few cases large differences. Identical thermodata are probably imported from the same source outside (or inside) of the PHREEQCI package. The causes of differences are not elucidated here, but could for example be sign errors when recalculating source data as well as considering/not considering chemical species in source data that can have an influence but are neglected. One example of the latter is in the case of log K for hematite: the complex ion Fe(OH)4- is considered in the reaction in the PSI/NAGRA database, but not
in others. This strongly influences the reported log K value in this case. Other causes of differences could be, when applicable, which solid phase condition was considered in the source work. Therefore it is important to clarify the status of a participating solid phase.
The PHREEQCI package is widely used in this kind of work and the included databases differ in varying degrees both in completeness/extension and in single values of log K. Therefore it is important to clarify which database has been used when reporting specific PHREEQCI results to facilitate subsequent comparisons with other results.
SKB have stated in their hydrochemical site descriptive model reports that they have used the wateq4f database, and they have justified this choice clearly and satisfactorily (Appendix B in Appendix 4 of SKB R-04-74 [8]).
The ultimate wish would be a complete review of all available thermodynamic data bases and a resulting, well motivated selection of data to formulate one trusted database to be used by PHREEQCI and other thermodynamically based modelling programs. However this is unlikely to be the case in the near future since there is so much ongoing research that revises thermodata and/or the speciations that are involved in equilibria, and each individual bit of experimental work is restricted to particular solution conditions and temperature range. The present situation is however adequate for present purposes. Errors in thermodynamic data as such are unlikely to be the major source of uncertainties in the outcomes from modelling, though the interpretation of redox equilibria is clearly dependent on identifying the relevant solid phases and being able to characterise these thermodynamically.
3.4.3 Modelling of pH and Redox in Forsmark
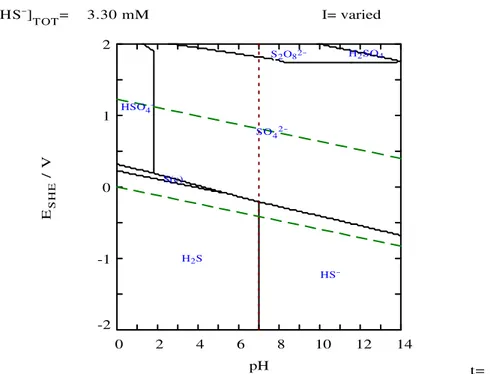
A set of Eh/pH diagrams for the iron, sulphur and chlorine systems were calculated with
MEDUSA [5] at 25 ºC for the Forsmark data from the water samples from borehole intervals KFM01A/115, KFM01A/180, KFM02A/116, KFM02A/512, KFM03A/450, KFM03A/642 and KFM03A/990. The HYDRA database included in MEDUSA was used and the total concentrations of the iron and the sulphur systems as accounted in the Forsmark selected data set in Appendix 3 have been applied. The parameter values used in each Eh/pH diagram are listed in Appendix 5, which also shows an illustrative
selection of diagrams. Some diagrams have been left out of the appendix, especially those only showing dissolved species and those with unlikely solid phases (e.g. Fe-ox-Cl solids). Details about borehole references and concentrations can be found in Appendix 3.
The specific pH and Eh data as selected and approved by SKB for modelling in the
Forsmark data set (Appendix 3) were used in the present modelling work. The same pH data have been adjusted by modelling CO2 loss using the saturation index method (see
next section).
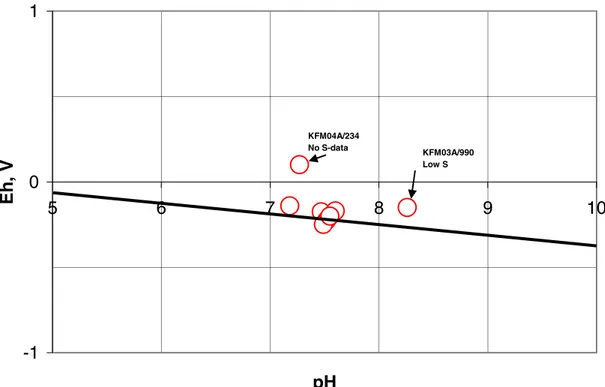
The set of diagrams in Appendix 5 show that there are, as expected, slight influences of variations in the total concentrations of the components. However, most measured pH/Eh points are located close to the HS-/SO42- line as also shown in Figure 1. Also
-1 0 1 5 6 7 8 9 10 pH Eh , V KFM04A/234 No S-data KFM03A/990 Low S
Figure 1. Compilation of pH/Eh data points from the selected set of groundwater data for
Forsmark. The line represents the equilibrium of the couple HS-/SO42- when pH > 7.
Some comments on Figure 1:
- Most measured pH/Eh points are located close to the HS-/SO42- line, also as a
function of pH. This would be expected if the couple HS-/SO42- determines Eh.
- Exceptions are for KFM04A/234, for which HS-/SO42- data are absent and for
KFM03A/990 for which HS-/SO42- concentrations are very low.
- It thus seems as if the HS-/SO42- couple determines Eh at ‘normal’ concentrations
(above about 0.5 mM and around 5 mM).
- If extreme data (KFM04A/234, KFM03A/990) are excluded, the spread in Eh would
be around 150 mV. The spread in pH would be around 0.5 units.
- This spread in data would indicate that measured values fall within acceptable limits compared with what would be expected.
- If extreme values are included the spread is larger. Such values, however, seem in the selected cases to be a result of deviating/extreme conditions and not necessarily a result of bad sampling/analysis/data handling.
3.4.4 Modelling of pH and Redox in Forsmark and Simpevarp Groundwater Samples
Geochemical modelling with PHREEQCI was used for two purposes connected with uncertainties in key hydrochemical parameters: (i) to adjust pH to compensate for CO2 outgassing on the basis of an assumption that in situ groundwater should be at
equilibrium with calcite, and (ii) to evaluate the hypothetical Eh on the basis of assumed
control by Fe3+/Fe2+, Fe(OH)3/Fe2+ and SO42-/HS- redox couples.
Adjusting the reported pH to compensate for CO2 outgassing was done by using the
mixing-reaction mode of the computer program to theoretically ‘titrate’ CO2 back into
the water until calcite equilibrium was reached. Of course, if a solution is already saturated or over-saturated with calcite, then this exercise is not valid. However the majority of samples, in terms of their reported data, are under-saturated which supports the hypothesis that CO2 outgassing might have occurred and would have led to rising
pH and over-saturation with respect to calcite. These calculations were carried out with reported groundwater data from Forsmark and Simpevarp sites and also from the Äspö HRL. No data were yet reported from new boreholes at the Laxemar site at the time of carrying out this geochemical modelling.
The resulting ‘adjusted’ pH values are shown in Table 2, in the column headed ‘Model pH at SIc =0’. Adjusted pH data for Forsmark, Simpevarp and Äspö samples are
typically 0.2 to 0.4 pH units lower than the measured values.
Eh was calculated according to the thermodynamics of the redox couples SO42-/HS-,
Fe3+/Fe2+ and Fe(OH)3/Fe2+. The latter calculation was done with thermodynamic data
for the solubility of amorphous Fe(OH)3 suggested by Grenthe et al. [15), based on a
study of redox in deep groundwaters from various of SKB’s early exploratory sites. Analytical data for the calculation of Eh for each of the redox couples with PHREEQCI
were compiled from SKB reports (see Appendix 1), except that Fe3+ concentrations used here were obtained by subtraction of Fe2+ from Fetotal. In a few cases Fe2+ Fetotal
and therefore no value can be given for Fe3+. In all cases it is evident that calculating Fe3+as the very small difference between two much bigger very similar values gives rise to very large uncertainty so that these calculated values for Fe3+ are generally invalid. SKB have not analysed Fe3+directly because concentrations are so low that analyses using conventional methods would be unreliable for the purpose of redox calculation.
Measured and modelled redox values for groundwater samples from the
Simpevarp/Äspö and Forsmark areas are compiled in Table 3 and are shown in Figures 2 and 3 respectively. Data are compiled from SKB’s P and R reports. Eh data in
parentheses are reported by SKB as unreliable and should be disregarded.
It is emphasised that the purpose of these calculations is to explore and illustrate the theoretical geochemical basis of this modelling and of the resulting inferences about redox conditions, redox indicators and redox buffering. It is also particularly to understand what are the assumptions, simplifications and uncertainties in interpreting hydrochemical data. The aim is not to compare directly calculated redox values with those calculated by similar methods and reported in SKB’s site descriptive model
reports. There are various understood and acceptable reasons why there might be small differences between model results here and those reported by SKB. Typically,
differences of ±10 mV in calculated Eh are not surprising and have no significance for
these purposes other than to illustrate one aspect of uncertainties.
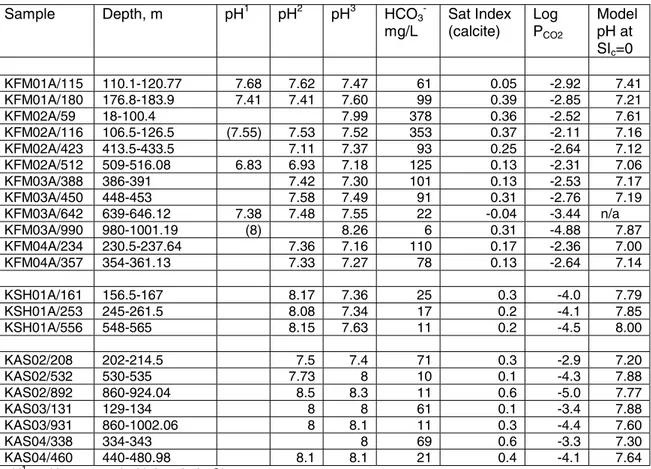
Table 2. Data for pH adjustment calculations based on assumption that in situ waters are
saturated with respect to calcite.
Sample Depth, m pH1 pH2 pH3 HCO3
-mg/L Sat Index (calcite) Log PCO2 Model pH at SIc=0 KFM01A/115 110.1-120.77 7.68 7.62 7.47 61 0.05 -2.92 7.41 KFM01A/180 176.8-183.9 7.41 7.41 7.60 99 0.39 -2.85 7.21 KFM02A/59 18-100.4 7.99 378 0.36 -2.52 7.61 KFM02A/116 106.5-126.5 (7.55) 7.53 7.52 353 0.37 -2.11 7.16 KFM02A/423 413.5-433.5 7.11 7.37 93 0.25 -2.64 7.12 KFM02A/512 509-516.08 6.83 6.93 7.18 125 0.13 -2.31 7.06 KFM03A/388 386-391 7.42 7.30 101 0.13 -2.53 7.17 KFM03A/450 448-453 7.58 7.49 91 0.31 -2.76 7.19 KFM03A/642 639-646.12 7.38 7.48 7.55 22 -0.04 -3.44 n/a KFM03A/990 980-1001.19 (8) 8.26 6 0.31 -4.88 7.87 KFM04A/234 230.5-237.64 7.36 7.16 110 0.17 -2.36 7.00 KFM04A/357 354-361.13 7.33 7.27 78 0.13 -2.64 7.14 KSH01A/161 156.5-167 8.17 7.36 25 0.3 -4.0 7.79 KSH01A/253 245-261.5 8.08 7.34 17 0.2 -4.1 7.85 KSH01A/556 548-565 8.15 7.63 11 0.2 -4.5 8.00 KAS02/208 202-214.5 7.5 7.4 71 0.3 -2.9 7.20 KAS02/532 530-535 7.73 8 10 0.1 -4.3 7.88 KAS02/892 860-924.04 8.5 8.3 11 0.6 -5.0 7.77 KAS03/131 129-134 8 8 61 0.1 -3.4 7.88 KAS03/931 860-1002.06 8 8.1 11 0.3 -4.4 7.60 KAS04/338 334-343 8 69 0.6 -3.3 7.30 KAS04/460 440-480.98 8.1 8.1 21 0.4 -4.1 7.64
pH1 = pH measured with borehole Chemmac system
pH2 = pH measured with surface Chemmac system; these values were used as the basis for modelling the pH adjustment for KSH samples.
pH3 = pH measured in laboratory; these values were used as the basis for modelling the pH adjustment for all samples except the KSH samples.
n/a = no adjustment of pH because Sat Index <0.
It is evident in Figures 2 and 3 that Eh calculated from the couples SO42-/HS- and
Fe(OH)3/Fe2+are rather close to the measured Eh in most cases. In contrast, the Eh
calculated from the Fe3+/Fe2+ couple is oxidising, i.e. a positive Eh, which is confidently
the result of erroneous calculated Fe3+ values for the reason discussed above. EhSO4/HS is
almost always less negative than EhFe(OH)3/Fe2+. If KAS02/892 is discounted, EhSO4/HS is
about 30 to 50 mV less negative than measured Eh in Äspö samples. It should also be
noted that HS- values from Forsmark samples are very low, at or close to the detection limit, whereas the historical values for Äspö area samples are rather higher. The reason for the difference is not evident and should be investigated, but the higher uncertainties due to near-detection limit HS- should be propagated into the calculated EhSO4/HS for
EhFe(OH)3/Fe2+ values are within +10 to -50 mV of the measured Eh in Äspö samples, but
are about 100 mV more negative for the three Simpevarp samples, noting that Fe2+ values are higher for these samples. This raises a question about reasons for real
differences in Eh at the two adjacent areas and/or sources of error in measured Eh values
and analysed Fe2+ values. Another important factor in modelled EhFe(OH)3/Fe2+ values and
in the cumulative uncertainty about redox interpretation is pH, to which the Fe(OH)3
-Fe2+ equilibrium is sensitive. Reported pH values for Simpevarp are lower than those for Äspö (Table 3).
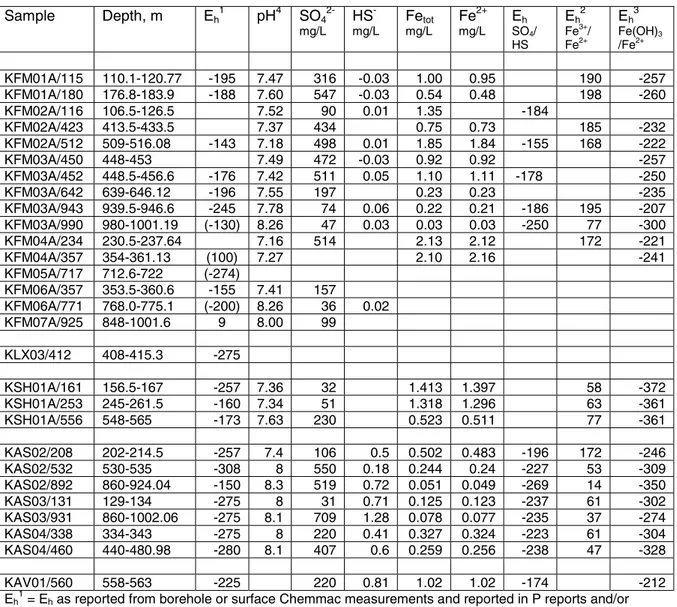
Table 3. Measured Eh and redox-sensitive solutes and results from geochemical modelling of
Eh for the SO42-/HS-, Fe3+/Fe2+, and Fe(OH)3/Fe2+ redox couples for groundwater samples from
boreholes at Forsmark, Simpevarp, Äspö and Ävrö.
Sample Depth, m Eh 1 pH4 SO4 2-mg/L HS -mg/L Fetot mg/L Fe2+ mg/L Eh SO4/ HS Eh 2 Fe3+/ Fe2+ Eh 3 Fe(OH)3 /Fe2+ KFM01A/115 110.1-120.77 -195 7.47 316 -0.03 1.00 0.95 190 -257 KFM01A/180 176.8-183.9 -188 7.60 547 -0.03 0.54 0.48 198 -260 KFM02A/116 106.5-126.5 7.52 90 0.01 1.35 -184 KFM02A/423 413.5-433.5 7.37 434 0.75 0.73 185 -232 KFM02A/512 509-516.08 -143 7.18 498 0.01 1.85 1.84 -155 168 -222 KFM03A/450 448-453 7.49 472 -0.03 0.92 0.92 -257 KFM03A/452 448.5-456.6 -176 7.42 511 0.05 1.10 1.11 -178 -250 KFM03A/642 639-646.12 -196 7.55 197 0.23 0.23 -235 KFM03A/943 939.5-946.6 -245 7.78 74 0.06 0.22 0.21 -186 195 -207 KFM03A/990 980-1001.19 (-130) 8.26 47 0.03 0.03 0.03 -250 77 -300 KFM04A/234 230.5-237.64 7.16 514 2.13 2.12 172 -221 KFM04A/357 354-361.13 (100) 7.27 2.10 2.16 -241 KFM05A/717 712.6-722 (-274) KFM06A/357 353.5-360.6 -155 7.41 157 KFM06A/771 768.0-775.1 (-200) 8.26 36 0.02 KFM07A/925 848-1001.6 9 8.00 99 KLX03/412 408-415.3 -275 KSH01A/161 156.5-167 -257 7.36 32 1.413 1.397 58 -372 KSH01A/253 245-261.5 -160 7.34 51 1.318 1.296 63 -361 KSH01A/556 548-565 -173 7.63 230 0.523 0.511 77 -361 KAS02/208 202-214.5 -257 7.4 106 0.5 0.502 0.483 -196 172 -246 KAS02/532 530-535 -308 8 550 0.18 0.244 0.24 -227 53 -309 KAS02/892 860-924.04 -150 8.3 519 0.72 0.051 0.049 -269 14 -350 KAS03/131 129-134 -275 8 31 0.71 0.125 0.123 -237 61 -302 KAS03/931 860-1002.06 -275 8.1 709 1.28 0.078 0.077 -235 37 -274 KAS04/338 334-343 -275 8 220 0.41 0.327 0.324 -223 61 -304 KAS04/460 440-480.98 -280 8.1 407 0.6 0.259 0.256 -238 47 -328 KAV01/560 558-563 -225 220 0.81 1.02 1.02 -174 -212
Eh1 = Eh as reported from borehole or surface Chemmac measurements and reported in P reports and/or
R SDM reports; values in parentheses ( ) are reported to be unreliable measurements.
Eh2 = modelled Eh for the Fe3+/Fe2+ couple using a Fe3+ value calculated as the difference between Fetot
and Fe2+.
Eh3 = modelled Eh for the Fe(OH)3/Fe2+ couple using the thermodynamic data for amorphous Fe(OH)3
recommended by Grenthe et al. [15]. pH4 = pH measured in the laboratory.