SKI Report 2005:42
Research
Phenomenological Studies on
Melt-Structure-Water Interactions (MSWI)
during Postulated Severe Accidents:
Year 2004 Activity
APRI 5 Report
B.R. Sehgal
H.S. Park
A.K. Nayak
R.C. Hansson
D. Chiferaw
A. Stepanyan
R.S. Rao
A. Karbojian
April 2005
Forskningsprojektet APRI-5 är ett samarbetsprojekt mellan följande organisationer: • Statens kärnkraftinspektion • Ringhals AB • OKG Aktiebolag • Forsmarks Kraftgrupp AB • Barsebäck Kraft AB
Projektet är underställd en styrgrupp med representanter från SKI och kraftbolagen enligt följande:
Mauritz Gärdinge, OKG (ordförande) Oddbjörn Sandervåg, SKI
Ninos Garis, SKI
Anders Henoch, Ringhals Ingvar Berglund, FKA Erik Larsen, BKAB
SKI Report 2005:42
Research
Phenomenological Studies on
Melt-Structure-Water Interactions (MSWI)
during Postulated Severe Accidents:
Year 2004 Activity
APRI 5 Report
B.R. Sehgal H.S. Park A.K. Nayak R.C. Hansson D. Chiferaw A. Stepanyan R.S. Rao A. KarbojianDivision of Nuclear Power Safety Department of Energy Technology Royal Institute of Technology SE_100 44 Stockholm Sweden
April 2005
This report concerns a study which has been conducted for the Swedish Nuclear Power Inspectorate (SKI). The conclusions
CONTENTS
SUMMARY ... 2
1 INTRODUCTION AND RESEARCH OBJECTIVES... 3
2 PROGRESS OF RESEARCH PROGRAM... 6
2.1 In-Vessel and Ex-Vessel Debris Coolability ... 6
2.1.1 POMECO Program ... 6
2.1.1.1 Top Flooding ... 7
2.1.1.2 Effect of non-condensable gas injection on quenching ... 8
2.1.1.3 Top flooding with side water injection ... 8
2.1.1.4 Top and bottom flooding with the downcommers ... 9
2.1.2 COMECO Program ... 13
2.1.3 SIMECO Program... 17
2.1.4 SIMECO Experiment ... 17
2.1.4.1 Two-layer simulations... 18
2.1.4.2 Three-layer simulations ... 18
2.1.4.3 Steady-state temperature distribution in the liquid pool ... 19
2.1.4.4 Heat flux distribution in the sidewall... 20
2.1.4.5 Upward and downward heat fluxes ... 21
2.2 Ex-Vessel Steam Explosion... 23
2.2.1 MISTEE Experimental Program ... 23
2.2.1.1 Metallic melt tests ... 23
2.2.1.2 Oxidic melt tests ... 26
2.2.1.3 Development of simultaneous visualization system ... 27
2.2.2 Steam Explosion Analysis with the COMETA Code ... 28
2.2.2.1 Simulation of the FARO L-33 Test ... 29
2.2.2.2 Simulation of TROI experiments... 32
3 SUMMARY OF YEAR 2004 RESEARCH PROGRAM ... 35
4 RESEARCH PLAN OF YEAR 2005 RESEARCH PROGRAM ... 38
SUMMARY
This report presents descriptions of the major results obtained in the research program “Melt-Structure-Water Interaction (MSWI)” at NPS/KTH during the year 2004. The pri-mary objectives of the MSWI Project in year 2004 were to study (1) the in-vessel and ex-vessel melt/debris bed coolability process when melt is flooded with water, and (2) the energetics and characteristics of steam explosions. Our general approaches are to establish scaling relationships so that the data obtained in the experiments could be extended to prototypical accident geometries and conditions, develop phenomenological or computa-tional models for the processes under investigation and validate the existing and newly-developed models against data obtained at KTH and at other laboratories.
In 2004, several experimental programs, such as the COMECO (COrium MElt COolabil-ity), POMECO (POrous MEdia COolability) and MISTEE (Micro-Interactions in STeam Explosion Experiments) programs were continued. The SIMECO (SImulation of MElt Coolability) program was restarted in 2004. The construction of the POMECO-GRAND (POrous MEdia COolability) facility was delayed due to lack of finances. However, exist-ing POMECO facility was modified to study 3-D effects on debris coolability. In this re-port, the results from the COMECO experiment with high temperature oxidic melt, from the POMECO experiments for the multi-dimensional effects on debris bed coolability, from the SIMECO experiment for three-layer pool configuration and from the MISTEE experiments for steam explosion characteristics and loads are described. For analytical efforts, results from the COMETA code for the entire process of the steam explosions are discussed.
1 INTRODUCTION AND RESEARCH OBJECTIVES
Reactor safety’s concern with severe accidents, since the TMI-2 accident led to almost twenty years of intense research efforts, which have resolved a number of severe accident issues which are related to containment performance. These include for example, LWR containment failure due to in-vessel steam explosions and direct-containment heating, BWR Mark I containment failure due to melt attack. Lately, research has been concen-trated on accident management and a number of LWR plants, around the World, have adopted severe accident guidelines (SAMGs) and strategies. These include for instance, hydrogen control with igniters and catalytic recombiners, water addition to the Mark I drywell to prevent liner failure, vessel depressurization for DCH protection etc. There are still several severe accidents issues, which remain unresolved. A suggested prioritization [1] for the unresolved key issues is as follows:
(1) In-Vessel and Ex-vessel Melt/Debris Coolability, (2) Ex-vessel Steam Explosion Loads,
(3) Basemat Melt-Through,
(4) Lower Head Failure Mode and its Timing, and (5) Core Quenching
Perhaps, the issue which most affects the mitigation strategy in the current plants is that of ex-vessel melt/debris coolability, since the stabilization and termination of the accident depends on it. The current SAM measures either avoid flooding the PWR vessel cavity and the BWR drywell or depend on such action for coolability, except that the flooding action opens the issue of the vulnerability of containment to steam explosion loads. Cur-rently, neither mitigative measure is clearly preferred.
Therefore, the general objectives of the research we have performed at Royal Institute of Technology (KTH), Sweden in the research project MSWI (Melt-Structure-Water Interac-tions during Severe Accidents in LWRs) project under the auspices of the APRI program, jointly funded by HSK, SKI and the Swedish power companies are to obtain data and de-velop validated models for the resolution of five issues listed above. In the year 2004, the emphasis of the research work at KTH was placed on the experimental effort on phenom-ena and parameters, which govern the droplet fragmentations during the explosion phases of steam explosion, in-vessel and ex-vessel melt/debris coolability and melt pool convec-tion. These experimental efforts were supplemented with analysis development efforts with the various codes including COMETA for steam explosion.
The specific objectives of each tasks have performed in the year 2004 are listed below.
In-Vessel and Ex-Vessel Debris Coolability (POMECO Program)
The POMECO facility at KTH is designed to investigate the coolability of a particulate porous debris bed simulated by sand beds. This year the POMECO experiments aimed to investigate the effect of multi-dimensional configuration of particulate debris beds, which have radial stratification on coolability since radially-stratified debris beds have beeb
ob-tained in the FARO tests after interaction 0f a melt jet with water. In doing so, the previ-ous POMECO facility which modeled uniform and axially-stratified debris beds was modified. The modified POMECO facility has the same test section of the POMECO fa-cility with additional heaters and radially stratified debris beds. In addition, Water entry into the bed is made from the sides of the bed in order to have a 3-D distribution of cool-ing. The facility employs more thermocouples to measure the local temperature transients in multi-dimensional debris bed configurations.
Specific phenomena associated with the configuration of radially stratified porous debris beds with multiple water injection are investigated; (a) quenching and dryout phenomena during top flooding, (b) effect of water injection at multiple locations at sides of the facil-ity, (c) both top and bottom flooding using downcomers, (d) effect of non-condensable gas injection. The measured data are compared to thses obtained in the previous debris bed experiments with homogeneous and axially stratified porous debris beds.
In-Vessel and Ex-Vessel Melt Coolability (COMECO Program)
The more realistic demonstration of coolability process has been tested in the COMECO facility at KTH, which employs high-temperature binary oxidic melt as corium simulant with internal heating. The main objective of the COMECO experiments in the year 2004 is to investigate the water ingression and coolability behavior of the melt pool with different kinds of flooding; such as top and bottom flooding. The COMECO facility employs one
downcomer unit cell. The COMECO facility also employs the TiO2–MnO2 melt, which
has a different material structure than that of the CaO–B2O3 melt. We believe that there
may be differences in the water ingression efficiency in the melt pool due to material
structure differences. The TiO2–MnO2 and CaO–WO3 melts have ceramic structure when
they cool down, while the CaO–B2O3 melt is of glass structure as it cools. There are also
differences in the viscosity of these melts; the CaO–B2O3 melt has much higher viscosity.
The COMECO experiments with different flow rates and subcooling will be tested. This program will continue into 2005.
Melt Pool Convection (SIMECO Program)
The SIMECO experiments in KTH had investigated the natural convection heat transfer at the boundaries of an internally heated stratified (two-layer) pool in the bottom head of the reactor vessel. In the year 2004, the SIMECO experiment investigated the natural convec-tion heat transfer behavior in a three-layer stratified pool which was recently observed in the MASCA project.
Steam Explosion Loads (MISTEE Program)
The MISTEE experiments at KTH have been performed to investigate the characteristics of single drop steam explosion using advanced visualization techniques and measurement instruments. In the year 2004, the MISTEE experiments aimed to investigate the steam explosions with a single metallic melt droplet to evaluate the steam explosion energetics. At the same time, the uncertainty analysis to quantify the X-ray radiographic measurement is performed. The effect of thermo-physical properties of melts using various oxidic melts
are starting to be investigated. Preparation of melting and delivery methodology is also developed.
Steam Explosion Loads (COMETA Analysis)
A mechanistic computer code for steam explosion process, called COMETA, developed at JRC, Ispra, Italy, has been transferred to KTH, Sweden to systemically investigate the steam explosion processes in various geometries at different scales and to improve key models for steam explosions using database from the MISTEE experiments. In the year 2004, the COMETA analyses aimed to investigate the characteristic difference between two sets of steam explosion experiments with corium, i.e., those performed in JRC, Ispra, called FARO and the other in KAERI, Korea, called TROI. In contrast to the FARO tests, the TROI tests showed energetic explosions with corium composition.
2 PROGRESS OF RESEARCH PROGRAM
2.1 In-Vessel and Ex-Vessel Debris Coolability 2.1.1 POMECO Program
In this project, we investigated the influence of radial stratifications of the bed on the quenching using smaller size particles with prototypic porosity distribution, which has never been studied adequately in previous studies. These studies are important in order to bring further insight in debris bed quenching in stratified configurations and generation of data for model development and code validation. The most important task is to find out an effective method of quenching the heat generating debris bed. For this, we carried out ex-periments in a facility named as POMECO (POrous MEdia COolability) as shown in Fig 2.1.1. The bed was composed of sand with lower porosity layer of particles at the center of test section and with higher porosity layer of particles at the periphery. The porosities and sizes of the sand particles chosen were close to those observed in a corium debris bed. The sand bed was heated volumetrically with power density closer to the decay heat generated in corium. To study the influence of non-condensable gases generated during an MCCI on quenching, two different gases such as air and argon were injected at the bottom of the bed during the quenching conditions. The gas flow rate was simulated to that actually gener-ated during the later stages of MCCI from both basaltic and lime stone sand concretes.
Fig.2.1.1 Schematic of POMECO facility
Experiments were conducted with and without gas injection rates when the bed was flooded from the top. It was found that top flooding alone might not be able to quench the bed even after many hours. To find out an effective method of quenching, water was in-jected at multiple locations from the side of the bed using side pipes. Besides, a series of experiments were conducted on the quenching of the bed with top flooding and bottom flooding using downcomers with and without non-condensable gases addition to the bot-tom of the bed. The size and location of the downcomers on the quenching behavior and their effectiveness on the quenching were investigated. Finally, the quenching period for
high porosity (0.38) downcomers high po-rosity (0.38) low porosity (0.26) Side pipes
different conditions was measured and compared with that of a homogenous bed and axi-ally stratified bed.
0 1000 2000 3000 4000 5000 6000 50 100 150 200 250 300 350 400 450 500 550 T e m p e ratu re ( oC) time (s) 15 cm 21 cm 27 cm 33 cm 39 cm 45 cm high porosity region
0 1000 2000 3000 4000 5000 6000 50 100 150 200 250 300 350 400 450 500
Low porosity region
distance from top of bed
Te mpe rat ur e ( oC) time (s) 15 cm 21 cm 27 cm 33 cm 39 cm 45 cm (a) (b) Fig.2.1.2 Quenching behavior for top flooding
2.1.1.1 Top Flooding
For the top flooding tests, all downcomers were closed in the facility. After the bed was
heated to an approximate average temperature of around 400 to 450 0C, water at a
tempera-ture of around 90 0C was flooded to the top of bed. The height of water column above the
bed was nearly 0.5 m, which was kept constant throughout the test. Figs. 2.1.2 (a) and (b) show the typical temperature history in the bed in the high and low porosities regions spectively. The time period for quenching was found to be higher in the low porosity re-gion (about 5300 s) as compared to that in the high porosity rere-gion (about 4950 s). Previ-ous POMECO experiments showed that for a homogenPrevi-ous bed with the porosity of 0.26 and mean particle size of 0.8 mm, the quenching period was about 1650 s for top flooding.
0 2000 4000 6000 8000 10000 12000 14000 16000 18000 50 100 150 200 250 300 350 400 450 500
High porosity region distance from top
te m per at ure ( oC) time (s) 15 cm 21 cm 27 cm 33 cm 39 cm 45 cm (a) 0 2000 4000 6000 8000 10000 12000 14000 16000 18000 50 100 150 200 250 300 350 400 450 500 T em p era ture ( oC) time (s) 15 cm 21 cm 27 cm 33 cm 39 cm
45 cm (b) Low porosity region
(a) (b)
Fig.2.1.3 Effect of non-condensable gas on quenching (top flooding, air flowrate is 50 LPM). When the porosity was larger (0.4) and the particle size was smaller (0.2 mm), the quench-ing period was about 9300 s, which is much longer than that with low porosity region. This implies that the quenching period is controlled more by the sizes of particle rather than the porosity. In the present case, the size of the low porosity sand and the high porosity sand was similar. So the difference in quenching period was mainly due to difference in the
po-rosities of the two layers. Moreover, it can be observed from the figures that the quenching behavior of the two layers are similar, i.e. the quenching first occurs at the top and then the front propagates to the bottom of the bed like that of a homogenous bed with top flooding. Hence there is no cross flow across the boundary between the two layers.
0 1000 2000 3000 4000 50 100 150 200 250 300 350 400 450 500 Te m per at ur e ( oC) time (s) 15 cm 21 cm 27 cm 33 cm 39 cm 45 cm
(a) High porosity region
0 1000 2000 3000 4000 50 100 150 200 250 300 350 400 450 500 Tem perat u re ( oC) time (s) 15 cm 21 cm 27 cm 33 cm 39 cm 45 cm
(b) Low porosity region
(a) (b)
Fig.2.1.4 Quenching with top flooding and water injection at the side of bed
2.1.1.2 Effect of non-condensable gas injection on quenching
The effect of non-condensable gases on the quenching behavior with top flooding was studied which is shown in Fig. 2.1.3 for the high porosity and low porosity regions. The airflow rate was about 50 LPM. The quenching rate is negligible as can be seen from the transient temperature history of the bed. So CCFL conditions exist both in the low and high porosity regions. The slight cooling observed at the bottom of the bed, mainly in the low porosity region, is caused by convection heat removal due to the low temperature air.
2.1.1.3 Top flooding with side water injection
First, we investigated the quenching behavior of the bed when it was flooding from the top and at the same time water was injected using the side pipes. As shown in Fig.2.1.1, these side pipes inject water symmetrically in opposite side of the bed at four different points (two each side of the bed). The diameter of the side pipes is about 10 mm and the injection
0 200 400 600 800 1000 50 100 150 200 250 300 350 400 450 500
(a) High porosity region
distance from top of bed
te m per at ur e ( oC) time (s) 15 cm 21 cm 27 cm 33 cm 39 cm 45 cm 0 200 400 600 800 1000 50 100 150 200 250 300 350 400
450 (b) Low porosity region
distance from top
te m p er ature ( oC) tim e (s) 15 cm 21 cm 27 cm 33 cm 39 cm 45 cm (a) (b)
points are at mm from the top of the bed. Fig. 2.1.4 shows the quenching behavior in the high and low porous regions respectively. The time period of quenching in the low porous layer was little higher than that in the high porous region similar to that observed during top flooding. However, the time period of quenching was reduced significantly with side pipe injection. Similar to that of top flooding, the quench front propagates from top to bot-tom of the bed in both low and high porous regions. But in the high porous region, the wa-ter penetration was found to be faswa-ter in the top layer of the bed (up to depth of 270 mm) as compared to that in the bottom layer of the bed.
2.1.1.4 Top and bottom flooding with the downcommers
Next, we investigated the quenching behavior of the bed with top flooding and bottom flooding using downcomers. First, the bottom flooding was carried out using the center large downcomer only and the other six small downcomers were closed. Figs. 2.1.5 (a) and (b) show the typical temperature behavior of the bed during quenching for the high poros-ity and low porosporos-ity regions respectively. The presence of downcomer in the center of the bed wherein the low porosity region is located helps in better quenching. But the time for quenching in the low porosity region is still found to be longer than that in the high poros-ity region. Comparing these results with that of with top flooding only, it is evident that bottom flooding helps in significant reduction of quenching period of the debris bed. Pre-vious POMECO experiments reported a quenching time of nearly 1200 s for the homoge-neous bed with porosity of 0.26 for the same mixture composition as used here. However, they employed a smaller downcomer with diameter 30 mm instead of 54 mm as used in the present case. Moreover, use of a large size downcomer along with presence of a larger po-rosity region in the periphery of the bed has augmented the quenching rate. The quench front propagates downwards from the top due to top flooding and upwards from the bottom of the bed due to bottom flooding simultaneously. The center region quenched at the end.
Next, we investigated the effects of size of downcomers and their locations on the quench-ing rate. So instead of usquench-ing a large downcomer, we put six small downcomers of size 12 mm symmetrically in the bed as shown in Fig. 2.1.1. These downcomers now are located at the periphery of the bed with two in the central low porosity region and two in each of the
0 200 400 600 800 1000 1200 1400 50 100 150 200 250 300 350 400 450 500
(a) high porosity region
distance from top
te m per at ur e ( oC) time (s) 15 cm 21 cm 27 cm 33 cm 39 cm 45 cm 0 200 400 600 800 1000 1200 1400 50 100 150 200 250 300 350 400 450 500
distance from top
tem p era ture ( oC) time (s) 15 cm 21 cm 27 cm 33 cm 39 cm 45 cm (b) Low porosity region
(a) (b)
peripheral high porosity regions. The center downcomer was closed. Figs. 2.1.6 (a) and (b) show the temperature variation in the bed during quenching for the high porosity and low porosity regions for the same radial and axial locations as described before.
The time period of quenching for both low and high porosity layers are higher as compared to the previous case. The combined flow area of the six smaller downcomers is smaller as compared to the center large one. This may affect the bottom flooding rate and hence the quenching period. On the other hand, employment of all downcomers together (i.e. the six small downcomers and the center large one) reduces the quenching time significantly as shown in Figs. 2.1.7 (a) and (b). Another interesting feature of this result is that the differ-ence in quenching rate in the low and high porosity regions is much smaller unlike the pre-vious cases.
Hence from the above results it is evident that the quenching of a heat generating radially stratified bed may not be effective with top flooding alone when especially the debris bed is generating non-condensable gases due to MCCI. Of course, with water injection at the periphery of the bed reduces the quenching period, however, the most effective means of quenching of the bed can be achieved by bottom flooding of the bed using downcomers in
0 100 200 300 400 500 600 700 800 100 150 200 250 300 350 400 450 500
Distance from top (a) High porosity region
tem p er atu re (o C) time (s) 15 cm 21 cm 27 cm 33 cm 39 cm 45 cm 0 100 200 300 400 500 600 700 800 50 100 150 200 250 300 350 400 450
(b) Low porosity region
distance from top
te m pe rature ( oC) time (s) 24 25 26 27 28 29 (a) (b)
Fig.2.1.7 Quenching behavior with top flooding and bottom flooding with all downcomers
0 200 400 600 800 1000 50 100 150 200 250 300 350 400 450 500
distance from top
temp erat ur e ( oC) time (s) 15 cm 21 cm 27 cm 33 cm 39 cm 45 cm 0 2 4 6 8 10 0 2 4 6 8 10
high porosity region
0 200 400 600 800 1000 1200 1400 50 100 150 200 250 300 350 400 450 500
distance from top
te mper at ur e ( oC) time (s) 15 cm 21 cm 27 cm 33 cm 39 cm 45 cm high porosity region
(a) (b)
Fig. 2.1.8 Effect of non-condensable gas on quenching (top flooding and bottom flooding with all downcomers, air flow rates are (a) 50 and (b) 125 LPM).
addition to the top flooding. These downcomers provide an effective passive means of re-moving the decay heat by two-phase natural circulation.
The effects of non-condensable gas on quenching during top and bottom flooding condi-tions were studied for different airflow rates. Fig. 2.1.8 shows the quenching rate for two different airflow rates in a high porosity layer, when all downcomers were open. There is a systematic increase in quenching time with increase in airflow rate observed at all axial locations. The overall quenching time is also higher as compared to the case when no air was injected (Fig. 2.1.7(a)). Similar behavior is also observed in a low porosity region. The non-condensable gases trigger the CCFL and hence affect the flooding.
The effect of non-condensable gases on quenching behavior when the center downcomer is only opened can be seen in Figs. 2.1.9 (a) and (b) for the high and low porosity regions respectively. The quenching rate is delayed both in the low and high porosity regions with non-condensable gas injection. But one interesting observation here is that in the high po-rosity region, the quenching front propagates from top to bottom like the case with top flooding. It means, the air does not allow water to penetrate to the bottom of the bed earlier unlike the previous case or that without air injection (Fig. 2.1.3 (a)). But in the low poros-ity region, the penetration of air into the bed is more difficult and hence it does not affect the quenching characteristics significantly.
In order to understand the effects of gas properties on the quenching behavior, we injected argon which is about 20 % heavier than air and repeated the quenching experiments with top flooding and bottom flooding with center downcomer open only, which were already performed with air. Fig. 2.1.10 shows the quenching behavior of the bed with Argon flow rate of 40 LPM in both low and high porosity regions respectively. This flow rate corre-sponds to approximately the mass flow rate for 50 LPM of air. The time period of quench-ing in the high porosity region was same as that in the air where as in the low porosity re-gion, the quenching rate with argon was found to be little smaller. Unlike in the low poros-ity region, the quench front propagation in the high porosporos-ity region was found to take place from top to bottom similar to that with air. The quenching rate in the top layer was also found to be smaller as compared to that in the bottom layers in the high porosity region.
0 200 400 600 800 1000 50 100 150 200 250 300 350 400 450 500
(a) high porosity region
distance from top
te m per at ur e ( oC) time (s) 15 cm 21 cm 27 cm 33 cm 39 cm 45 cm 0 200 400 600 800 1000 1200 50 100 150 200 250 300 350 400 450 500
(b) Low porosity region
te m perat ure ( oC) time (s) 15 cm 21 cm 27 cm 33 cm 39 cm 45 cm (a) (b)
Fig. 2.1.9 Effect of the non-condensable gas on quenching (top flooding and bottom flood-ing with center downcomer only), air flow rate is 50 LPM
Fig. 2.1.11 shows the quenching behavior of the bed when argon at a flow rate of 100 LPM was injected at the bottom of the bed. This corresponds to nearly 120 LPM of air. The time period of quenching was found to be longer than that observed with air both in the high and low porous regions. The quench front propagation was found to be similar like that of the previous case, i.e. flow rate of 40 LPM. Moreover, it is found that higher the flow rate of the non-condensable gas, longer is the quenching period. Another interesting observa-tion is that the quenching period for the top region is found to be longer in the high porous region as compared to that in the low porous region because of the non-condensable gases which prefer to flow in the low resistant high porous region. Hence, there is more chance of CCFL in the high porous region for larger flow of non-condensable gases even though bottom flooding is done using a large size downcomer at the center of the bed.
0 200 400 600 800 1000 50 100 150 200 250 300 350 400 450 500 te mpera tu re ( oC) time (s) 15 cm 21 cm 27 cm 33 cm 39 cm 45 cm
(a) high porosity region
0 200 400 600 800 1000 1200 50 100 150 200 250 300 350 400 450
(b) Low porosity region
te mper at ur e ( oC) time (s) 15 cm 21 cm 27 cm 33 cm 39 cm 45 cm (a) (b)
Fig.2.1.10 Quenching behavior with argon injection (top flooding and bottom flooding with downcomer, argon flow rate of 40 LPM)
0 200 400 600 800 1000 1200 1400 1600 1800 50 100 150 200 250 300 350 400 450 500 550
(a) high porous region
te m p er at ure ( oC) time (s) 15 cm 21 cm 27 cm 33 cm 39 cm 45 cm 0 200 400 600 800 1000 1200 1400 1600 1800 50 100 150 200 250 300 350 400 450 500 550 te m perat ure ( oC) tim e (s) 15 cm 21 cm 27 cm 33 cm 39 cm 45 cm (b) Low porous region
0 2 4 6 8 10 (a) (b)
Fig.2.1.11 Quenching behavior with argon injection (Top flooding and bottom flooding with center downcomer open only, argon flow rate of 100 LPM)
2.1.2 COMECO Program
In the year 2004, one experiment was carried out with the melt prepared from the binary
oxide mixture of CaO (30% by wt.) and B2O3 (70% by wt.), which has properties similar
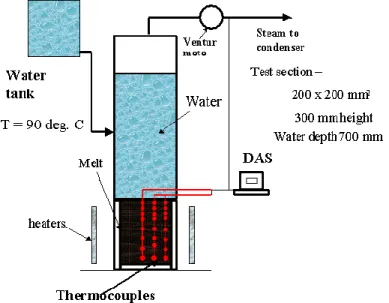
to the prototypical material during the later phase of the severe accident. The schematic of the experimental facility is shown in Fig. 2.1.12. The test facility consists of a test section
of 200x200x300 mm3 and the test section was heated from outside using special type of
Mo-Si heaters to simulate the decay heat. About 14 litres of melt was poured into the test section before it was flooded with water from the top. The steam flow rate was measured using venturi meters, which give an estimation of the quenching rate. A total of 24 K-type thermocouples were employed to measure the temperature at three different radial loca-tions.
Fig. 2.1.13 shows the temperature of the melt at various locations during the experiment. Fig. 2.1.14 shows the temperatures during the initial period of the experiment. As we can see the temperature of the melt in the first three locations from the top drops down to the saturation temperature of water due to water ingression. The temperature at the fourth lo-cation from the top (which is about 122 mm) is also found to drop from the initial tem-perature due to heat conduction from the melt to the overlaying water. The water ingres-sion was not observed at this location.
Figs. 2.1.15 and 2.1.156 show the temperatures of the melt at the other radial positions. They also exhibit similar quenching behavior as in the first radial position. Fig. 2.1.17 shows the steam flow rate measured during the experiment. The flow rate is high during the initial quenching process and later on decreased to a very low value. Figs. 2.1.18 (a) and (b) show the melt structure after the test was over. The crust formed was cut axially from top to bottom. Fig. 2.1.18(a) shows that the crust has a solid rock like structure with no porosity inside. Whereas a lot of fragmented pieces are observed in the top portion (Fig. 2.1.18(b)), which confirms the water ingression up to the depth mentioned previ-ously.
Fig.2.1.13 Quenching of melt during experiments
In the year 2004, experiments with 8%MnO+22%TiO2 melt were also conducted.
Re-cently attempts with MnO+TiO2 melt were failed due to the high temperature of the
melt-ing point of the mixture and it is difficult to achieve with the existmelt-ing furnace. The unex-pected failure of the melt generator and heating system in the COMECO facility was oc-curred during the first experiment for the melt coolability with the very high-temperature
binary oxidic melt, MnO+TiO2 whose liquidus temperature is 1380 oC. The temperature of
the crucible inside the induction furnace reached ~ 1500 oC which caused it structural
fail-ure. The capacitor and electric unit within the induction furnace overheated and failed. Two heaters in the COMECO facility also failed during experiment and dismantling. In this period of the project, the COMECO melt generation system was under repair. It is expected that some delay on the COMECO experiments for ex-vessel coolability of mol-ten pool will occur due to the failure of the induction melt generator system.
0 3000 6000 9000 12000 15000 0 200 400 600 800 1000 1200 te mp erat ure ( o C) time (s) 9 (27 mm) 10 (47 mm) 11 (70 mm) 12 (122 mm) 13 (170 mm) 14 (222 mm) 15 (274 mm) 16 (322 mm)
Fig.2.1.15 Quenching of melt at second radial position during the experiment
0 3000 6000 9000 12000 15000 0 200 400 600 800 1000 1200 te mp er at ur e ( o C) time (s) 17 (27 mm) 18 (47 mm) 19 (70 mm) 20 (122 mm) 21 (170 mm) 22 (222 mm) 23 (274 mm) 24 (322 mm)
0 3000 6000 9000 12000 15000 0,00 0,02 0,04 0,06 0,08 0,10 0,12 stea m fl ow ra te (k g/s) tim e (s)
Fig.2.1.17 Steam flowrates during the experiment
(a) (b)
Fig.2.1.18 Photos for (a) axial view and (b) top portion of melt structure after the experi-ment
2.1.3 SIMECO Program
A hypothetical core melt accident in a light water reactor may result in accumulation of core debris in the lower head of the reactor pressure vessel. If the core debris is un-quenched, it will heat up due to the internal heat generation and forms a melt pool. The core melt pool formed consists of a oxidic region at the bottom and a metal layer on the top. The thermal loads exerted on the vessel wall by the natural circulation in the pool have been studied for many years. The primary interest was the assessment of the feasibil-ity of an accident management scheme to retain the melt within the lower head by cooling the vessel outside wall with water. The RASPLAV Program conducted in Russia,
em-ployed prototypic (UO2-ZrO2) melt materials in a 200 kg slice facility to study the thermal
loads imposed by the prototypic melt on a cooled vessel wall. These experiments con-firmed that the natural convection heat transfer behavior in prototypic melt was similar to that observed in simulant materials. In order to investigate the effects of stable stratifica-tion on the heat transfer of the lower curved boundary of a reactor vessel and to the top boundary of the liquid pool, the SIMECO Program was extended in the year 2004. This program consists of performing experiments on convection in stratified pools with internal heat generation. Previously, one- and two-layers experiments were performed in the SIMECO facility.
2.1.4 SIMECO Experiment
The SIMECO experimental facility consists of a slice type vessel, which includes a semi-circular section and a vertical section, representing the lower head of the reactor vessel. The size of the facility is scaled to be 1/8 of prototype PWR type reactors. Fig. 2.1.19 shows a schematic of the facility. The diameter and height of the test section are respec-tively 62.0 cm and 53.0 cm. The width of a slice is 9.0 cm. The front and back faces of the facility are insulated in order to decrease heat losses. Thickness of the vessel wall is 2.3 cm. The vessel’s sidewall represented by a thick brass plate, is cooled by a regulated water
loop. On the top of the vessel a heat exchanger with regulated water loops is employed to measure the upward heat transfer. The sideways and downward heat fluxes are measured by employing array of thermocouples at several different angular positions. Practically isothermal boundary conditions are provided at pool boundaries. Cable type heater with 3 mm in diameter and 4 m in length provides internal heating in the pool, inside the vessel. A heat exchanger mounted on the exit of cooling water, is employed to increase cooling capacity of the water. The isothermal bath is designed to provide constant temperature. A circulation pump was mounted in order to establish necessary flow rate. One digital and one analog flowmeters are mounted to control water flow through the wall of the slice, while one analog flowmeter is controlling the flow in the upper heat exchanger. Total number of 64 K-type thermocouples is mounted to obtain the data on average heat flux on the sidewall and on the top of the pool, inlet and outlet water temperatures, as well as tem-peratures inside the vessel, and the upper heat exchanger.
2.1.4.1 Two-layer simulations
Paraffin oil and water were used as simulants for the stratified two immiscible fluids in the pool. Paraffin oil with lower density was put on the top of the water layer. Choice of these simulants is determined by different factors such as specific heat coefficient, miscibility,
toxicity, as well as density. The density difference between paraffin oil (880 kg/m3) and
water (999.1 kg/m3) is about 12%. These ratios were closer to that of prototypic melt
lay-ers observed in the RASPLAV program.
The height of the lower pool (water) was kept constant at 22 cm, and the thickness of the upper layer (paraffin oil) was kept 5 cm. The heater is located on the 4 cm elevation, and has height of 20 cm, so the heat was supplied partly to the water layer (18 cm), as well as partly to the upper layer – paraffin oil (2 cm). Cooling water mass flow through the side-wall was chosen to be 8.5 l/min, and the mass flow in the upper heat exchanger is kept at 3.0 l/min. The heater power was varied from 900 W to 1300 W. The corresponding Rayleigh number (Ra) was estimated by the relation as given by
k H Q g Ra V αν β 5 = (2.1.1)
which is found to be in range from 6.01x10¹² to 8.7x10¹² in these experiments so that
tur-bulent convection is clearly established in the liquid pool. Values of all the properties are taken for the pool average temperature at steady state.
2.1.4.2 Three-layer simulations
Paraffin oil, water, and chlorobenzene, were employed as simulants for stratification of three immiscible fluids. As said before, choice of these simulants is determined by differ-ent factors such as specific heat coefficidiffer-ent, miscibility, toxicity, as well as density. The
density difference between paraffin oil (880 kg/m3) and water (999,1 kg/m3) is about 12%,
and between water and chlorobenzene (1106 kg/m3) is about 11%.
The height of the lower pool (chlorobenzene) was kept constant at 4 cm, the thickness of the middle layer (water) is 18 cm, and the thickness of the upper layer (paraffin oil) was 5 cm. Since, the heater is located on the 4 cm elevation, and has height of 20 cm, so the heat was supplied to the whole middle layer, as well as partly to the upper layer (2 cm), as in case of two-layer tests. The bottom layer is kept unheated. Cooling water mass flow
through the sidewall was kept equal to 8.5 l/min and the mass flow in the upper heat
ex-changer was kept at 3.0 l/min. The Rayleigh number (Ra) ranges from 6.01x10¹² to
8.7x10¹², the same as in case of two-layer experiments. Therefore, there is turbulent
con-vection in this set of experiments as well. Each experiment was started with three sepa-rated layers as the initial condition. Then the experiment is continued until the steady state was reached, which is defined as a global heat balance greater than 90%, and a thermal evolution lower than one degree per hour.
2.1.4.3 Steady-state temperature distribution in the liquid pool
The temperature distribution in the liquid pool has been measured, by means of thermo-couples, mounted along the centerline of the vessel. Typical temperature field profile along the center of the pool during the whole experiment is shown in the Fig. 2.1.20.
Similar tests were conducted at different powers. The temperature field inside the pool during steady state is shown in Fig. 2.1.21(a) for these powers and the corresponding Rayleigh numbers are also shown in the figure. It can be observed that the temperature rises gradually along the height of the pool, until it reaches the interface between two up-per liquids, i.e. water and paraffin oil. At that point the temup-perature suddenly drops due to the interface resistance to the upward heat flow. Then there is a slight increase in tempera-ture in the upper paraffin layer due to convection.
0 2000 4000 6000 8000 10000 0 10 20 30 40 50 60 70 80 90 C45 C46 C40 C47 C48 Tem per atu re , C 0 Time, sec
Fig. 2.1.20 Temperature profile inside two-layer pool at Ra=6.01x10¹²
0 5 10 15 20 25 30 10 20 30 40 50 60 70 80 90 100 Tem p er at ure, C 0 Height, cm Ra=6.01*1012 Ra=8.63*1012 Ra=7.35*1012 Ra=7.82*1012 Ra=8.68*1012 0 5 10 15 20 25 30 0 10 20 30 40 50 60 70 80 90 100 Tem perature, 0C Height, cm Ra=6.01*1012 Ra=6.63*1012 Ra=7.35*1012 Ra=7.82*1012 Ra=8.68*1012
Fig.2.1.21 Temperature field inside the vessel (centerline) in (a) two-layer experiments and (b) three-layer experiments
Similar temperature distribution is observed in the three-layer experiments as shown in Fig. 2.1.21 (b). However, the temperature drop at the interface between the water and par-affin oil is found to be smaller in case of three layer experiments as compared to that in the two layer experiments at a given power. This shows that the thermal resistance is lower for a pool with clorobenzene. A significant difference to be mentioned is the higher temperature rise in the bottom chlorobenzene layer (below 5 cm). The maximum pool temperature for both experiments is almost the same, but there is difference between tem-perature values in the bottom of the vessel which could be due to the difference in thermal physical properties between water and chlorobenzene.
2.1.4.4 Heat flux distribution in the sidewall
The heat flux was estimated from the measured temperature distribution along the side-wall as given below.
dx T T k
q=− wall − p (2.1.2)
This is determined for different Rayleigh numbers for both two and three layer tests. Fig. 2.1.22(a) shows the heat flux distribution along the vessel wall in the two layer ex-periments. It can be seen from Fig. 2.1.22(a) that the maximum heat flux is observed around in the region of 57 degrees, suffering from maximum thermal load. The heat flux increases along with the radius, reaching its maximum, and then decreases again in the upper part of the sidewall.
Similar results are seen for the heat flux distribution in case of three layer experiments as
shown in Fig. 2.1.22(b). However, at higher Rayleigh numbers (Ra=7.82x10¹², and
Ra=8.68x10¹²), the maximum heat flux is observed around 64 degrees, which is different
from what we had obtained, from two-layer experimental results. But for lower Ra
num-bers (Ra=6.01x10¹² to 7.35x10¹²), the location of peak heat flux remains almost the same.
Apparently, one can observe that at low Raleigh numbers there is less heat directed to the side wall in the lower parts of the vessel in three layer experiments as compared to that in two layer experiments. This can be explained by the existence of the lower chlorobenzene layer in place of water in three-layer experiments, which helps in better heat diffusion and redistribution. However at high Raleigh numbers the heat flux distributions in the lower part of vessel are similar.
0 20 40 60 80 100 120 0 5000 10000 15000 20000 25000 30000 35000 q, W /m 2 angles Ra=8.68*1012 Ra=6.01*1012 Ra=6.63*1012 Ra=7.35*1012 Ra=7.82'1012 0 20 40 60 80 100 120 0 5000 10000 15000 20000 25000 30000 35000 q, W /m 2 angles Ra=8.68*1012 Ra=6.01*1012 Ra=6.63*1012 Ra=7.82*1012 Ra=7.35*1012
Fig.2.1.22 Heat flux distribution in the side wall for (a) two-layer experiments and (b) three-layer experiments
2.1.4.5 Upward and downward heat fluxes
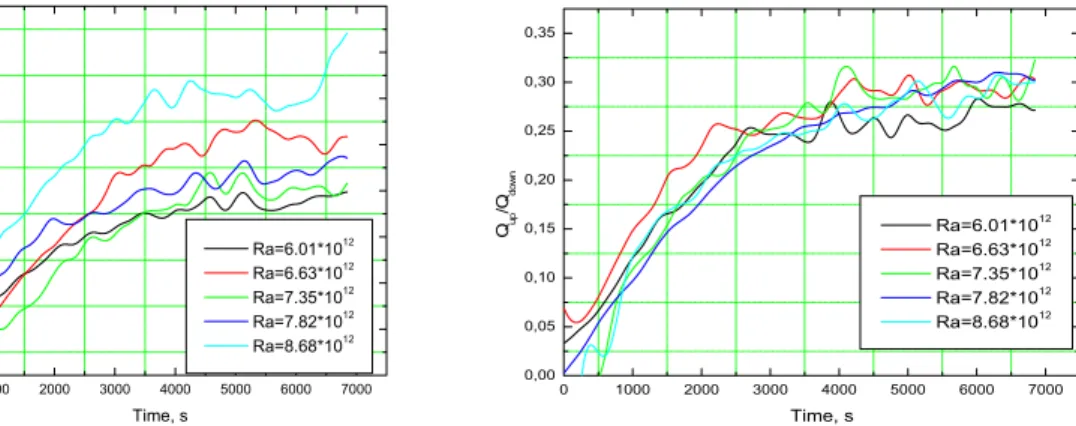
Another important issue is to investigate and discuss the upward and downward heat fluxes in the vessel during transient convection. In order to understand the cooling
mecha-nism, we are introducing the Qup/Qdown characteristic ratio, which was calculated for both
two- and three-layer experiments.
Fig. 2.1.23(a) shows the transient Qup/Qdown ratio at different powers for two layer
experi-ments. The highest upward to downward heat transfer rate is observed at Ra=7.82x10¹²,
and the lowest at Ra=6.01x10¹². Moreover, it is evident that the downward heat transfer
rate is much larger than the upward heat transfer rate because of presence of interface re-sistance. For experiments with three stratified layers pool, we can observe in Fig.2.1.23(b) that the Qup/Qdown ratio is almost similar for all cases. One still can see that the higher the Ra number the higher is the heat transfer rate, but the difference is marginal.
Fig. 2.1.24 shows the comparison of the Qup/Qdown ratio for both two and three-layer cases
under the same Ra number. One can easily observe that the upward heat transfer for three layer experiments is higher, than that for two-layer experiment for the same power input.
0 1000 2000 3000 4000 5000 6000 7000 0,00 0,05 0,10 0,15 0,20 0,25 0,30 0,35 0,40 Qup /Qdo w n Time, s Ra=6.01*1012 Ra=6.63*1012 Ra=7.35*1012 Ra=7.82*1012 Ra=8.68*1012 0 1000 2000 3000 4000 5000 6000 7000 0,00 0,05 0,10 0,15 0,20 0,25 0,30 0,35 Qup /Qdo w n Time, s Ra=6.01*1012 Ra=6.63*1012 Ra=7.35*1012 Ra=7.82*1012 Ra=8.68*1012
Fig.2.1.23 The Qup/Qdown ratios in (a) two-layer experiments and (b) three-layer
experi-ments 0 1000 2000 3000 4000 5000 6000 7000 0,00 0,05 0,10 0,15 0,20 0,25 0,30 0,35 Qup /Qdo w n Time, s Ra=7.82*1012 , two_layer Ra=7.82*1012 , three_layer Ra=6.01*1012 , three_layer Ra=6.01*1012, two_layer
This can be due to the lower thermal resistance in the three-layer pool, which allows the heat to be directed up. Previous experiments with two miscible fluids showed the
Qup/Qdown ratio increased to the value of 1.5 when the layers mixed. However the
experi-ments with immiscible two- and three layers show that when there are separate layers with interfaces, there is a large resistance to the heat flow upwards and the Qup/Qdown values are in the range of 0.2 to 0.4 only.
2.2 Ex-Vessel Steam Explosion
2.2.1 MISTEE Experimental Program 2.2.1.1 Metallic melt tests
In the year 2004, a series of metallic tests with Tin as a simulant melt has been conducted to refine the quantification of X-ray images and to build database for the comparison to tests with oxidic melts. To investigate the ability of nanofluid as a steam explosion sup-pression agent, a series of film boiling experiments with a high-temperature stainless sphere which quenches in nanofluid with various concentrations was conducted. Devel-opment of techniques to prepare and deliver a single droplet of various high-temperature oxidic melts for oxidic melt tests was a focus in the last period of the year 2004. In ana-lytical efforts, the COMETA code has been successfully installed at KTH and performed a series of verification runs against the experimental data obtained from the FARO and the KROTOS tests in JRC-Ispra, Italy and from the TROI tests, in KAERI, Korea, were per-formed.
A facility, called MISTEE (Micro Interactions in Steam Explosion Experiments) shown in Fig. 2.2.1 with a continuous high-speed X-ray radiography system is used for the single drop vapor explosion experiments. Molten tin mass of 0.7g is chosen in this series of tests to guarantee the delivery of a single drop into water through the crucible bottom hole. The external trigger, located at the bottom of the test chamber, is a piston that generates a sharp pressure pulse similar to a shock wave. The trigger hammer is driven by a rapid dis-charge of a capacitor bank, consisting of three capacitors that impact on the piston to gen-erate a pressure pulse.
The visualization system of photography and radiography consists of a continuous X-ray source tube (max. 320 keV, 22mA), an X-ray converter and image intensifier and a high-speed video camera (max. 8000fps for 4 s). The resolution of the X-ray image is 56 line pairs per centimeter. The image size of the high-speed camera at 8000 fps is 80x70 pixels.
The uncertainty involved in the quantification of X-ray visualization has been analyzed. In general, the intensity of the detected X-rays, I, after the transmission of the incident X-ray
beam, Io, in a medium, obeys the attenuation law as follows
⎭ ⎬ ⎫ ⎩ ⎨ ⎧ − =
∑
i i i I I 0exp µδ (2.2.1)where, δi and µi are the thickness and the mass attenuation coefficient of i-th materials.
The total X-ray intensity detected at the converter, however, consists of the intensity of the
X-rays that penetrated through the test section and were attenuated, IA, and the intensity of
the X-rays that were scattered by the object and surrounding shields IS;I = IA +IS. The
image contrast, proportional to the transmitted X-ray beam, is transformed into digitized gray levels. Therefore the digitized gray level, G, can be generally expressed as,
(
)
0 0exp G I G I I G I G i i i DC S A DC + ⎭ ⎬ ⎫ ⎩ ⎨ ⎧ − = + + = + =α α α∑
µ δ (2.2.2)where α, GDC, and G0 are the proportional constant, dark current of the imaging system
and the image offset, which represents the gain of the image gray level due to the scattered
X-rays and the CCD dark current, i.e., αIs+GDC., respectively. The basic arrangement of
our XR system (X-ray tube and converter) with a test section that has multiphase mixture of water, vapor and melt during the vapor explosion process. Combining the equations, the normalized gray level of the image can be expressed in terms of the thickness of the melt droplet as, { M M} e{ M M} e G G G G G NM M ≅ −µ δ =β −µ δ − − ≡ ∆ 00 . (2.2.3)
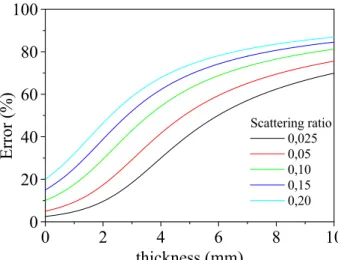
Fig. 2.2.2 shows the error in respect to the tin thickness and scattering ratio, for the current X-ray settings of our system (120 kV). For such high energy X-rays, scattering is of great importance and must be taken into account. The scattered photons create a loss of contrast and definition, resulting in large measurement errors. The average gray levels in a row,
0 2 4 6 8 10 0 20 40 60 80 100 Scattering ratio 0,025 0,05 0,10 0,15 0,20 Error (%) thickness (mm)
transverse direction, shows a quite low fluctuation, around 4.8%, but on the average in a column, longitudinal direction, it rises to around 29%.
The non-uniformity of the background is due to the camera noise (dark current), uneven illumination through the image (output screen response and intensity distribution of X-ray radiation – maximum in the center) and CCD response to light (each pixel response var-ies). That means that the background subtraction and offset correction should be per-formed pixel by pixel and not using an average number.
Figure 2.2.3(a) shows the brightness distribution of the radiography image of a tin piece,
and Figure 2.2.3(b) shows the same image after G0 correction. It is clear the significant
reduction of the image noise, has been achieved.
• Fluctuation of the optical brightness between pixels ∆εpixel
• Contrast ratio on the fluorescent screen ∆εscreen
• Deviation between the actual and measured thickness, ∆εδ
• Statistical error of the X-ray beam ∆εstat
(a) (b)
Fig. 2.2.3 (a) tin phantom gray level; (b) tin phantom after image processing
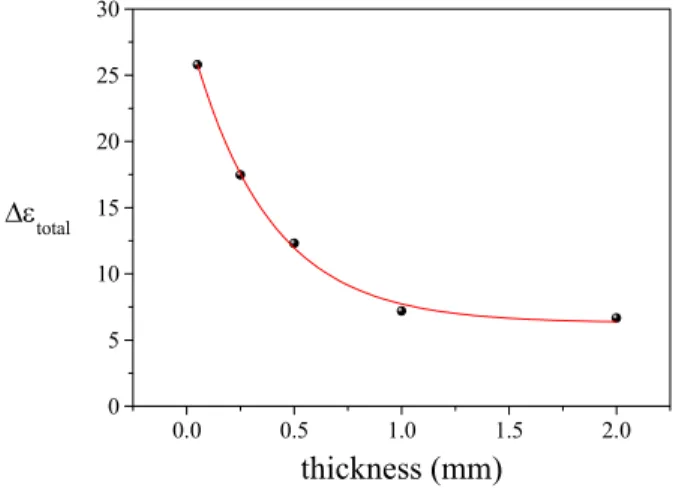
0.0 0.5 1.0 1.5 2.0 0 5 10 15 20 25 30 ∆εtotal thickness (mm)
Fig. 2.2.4 Total uncertainty of the measurement.
posi-tion
posi-tion
posi-tion posi-tion
The achievable measurement accuracy depends on the statistical error of the X-ray beam
∆εstat, contrast ratio on the fluorescent screen ∆εscreen, on the fluctuation of the optical
brightness between pixels ∆εpixel, and the deviation between the actual and measured
thickness, ∆εδ. The correlation for the total uncertainty ∆εtot is given by:
(
) (
2) (
2)
2(
)
2(
)
2 δ ε ε ε ε ε = ∆ + ∆ + ∆ + ∆∆ tot stat screen pixel (2.2.4)
As shown in Fig. 2.2.4, for a higher thickness the error decreases, this can be explained by the fact that the optical brightness approaches its saturation, represented by the asymptotic part of the calibration curve, giving an almost constant gray level. For the thinner
phan-tom, scattering becomes significant since it creates a loss of contrast even after the G0
cor-rection.
2.2.1.2 Oxidic melt tests
At present various binary oxidic melt as listed in Table 2.2.1 has been tested to develop the techniques to generate and deliver a single drop melt for the MISTEE experiments.
The binary oxide, CaO-B2O3, has high viscosity compared to corium and exhibits the
characteristics of glass-type oxides. It has relatively low melting point. The other oxides
such as Al2O3, WO3-CaO and MnO-TiO2 have the characteristic of ceramic type of oxides
similar to the corium. However, the melting temperatures of these oxides except the WO3
-CaO are much higher. The characteristics of steam explosions, fragmented debris mor-phology and FCI energetics for those oxidic melt will be tested until the end of the project.
Table 2.2.1 Thermo-physical properties of single and binary oxidic melts for the MISTEE experiments comparing to Corium and Tin
Recently, a MnO-TiO2 melt at the initial temperature of approximately 1400 oC was
suc-cessfully delivered into water at 50 oC and visualized with high-speed photography and
X-0.53 0.87 32 59.5 0.257 232 6507 1000 Sn - - - - 0.9 1377 (liq.) 4500 1400 MnO-TiO2 (78-22w/o) 6500 (sol.) 2500 (liq.) 2027 7320 (liq.) ρ, kg/m3 - 0.15 0.5 1.02 σ, N/m - 100~300 4 3.7 µ, mPa/s 1200 (liq.) 1135 (sol.) 1030 (liq.) 980 (sol.) 2500 2600 (liq.) 2500 (sol.) Tmp, oC 70 460 1000 360 hfus, kJ/kg 0.5 2.20 (liq.) 1.53 (sol.) 1.4 0.54 (liq.) 0.41 (sol.) Cp, kJ/kgK 1200 1100 2800 2600 Tref, o C - 3.0 (liq.) 2.1 (sol.) 8 9.6 (liq.) k, W/mK WO3-CaO (82-18w/o) CaO-B2O3 (30-70w/o) Al2O3 Corium (80UO2-ZrO2)
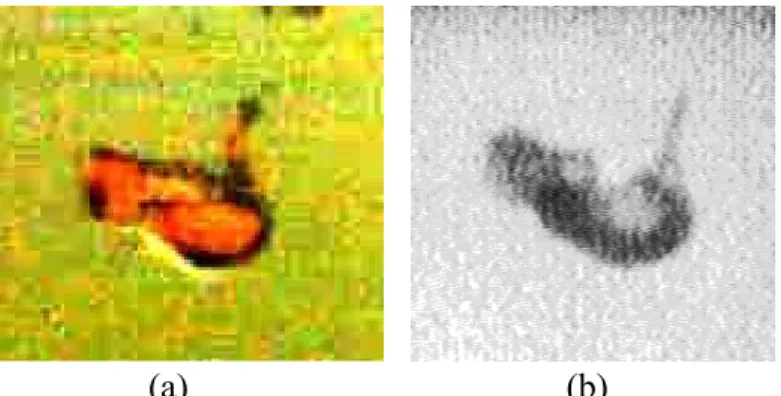
ray radiography simultaneously. The image in Fig. 2.2.5(a) showed the high temperature melt drop which was deformed during the penetration into water. The Fig. 4.5(b) showed that the droplet has an internal cavity.
2.2.1.3 Development of simultaneous visualization system
In this year, one significant improvement of our X-ray radiography system in the MISTEE facility has been achieved by adding additional high-speed CMOS camera (Redlake HG50LE Color CMOS Camera, 100,000 fps maximum). This improvement provides the simultaneous synchronized visualization (see Fig. 2.2.6) using two high-speed cameras, one for X-ray radiography and another for photography, called SHARP (Simultaneous
High-Speed Acquisition with Radiography and Photography) (see Fig. 2.2.6) where
syn-chronized visual data for vapor bubble and melt fragment dynamics, will enable the accu-rate quantification of the steam explosions.
(a) (b)
Fig. 2.2.5 MnO-TiO2 melt drop (~1400 oC) into water: (a) photograph image and (b) X-ray
image.
One high-speed camera (photography) visualizes the dynamic behavior of vapor film sur-rounding a melt drop during the vapor explosion process. This information will provide data on the interaction zone of steam-melt-water mixture as well as the transient steam bubble dynamics. The data on interaction zone will be used to quantify the volume frac-tions of each component involved in vapor explosion derived from the image data from the X-ray radiography. The data on the transient bubble dynamics in combination with dynamic pressure signals will be used to estimate the energetics or explosivity, of the va-por explosion, in terms of explosion conversion ratio (the ratio of work done by the explo-sion process on the environment to the total initial energy content of the melt droplet). The other camera (X-ray radiography) visualizes the melt fragmentation process during the explosion phase of vapor explosion. This image data will provide the visual informa-tion on the fine fragmentainforma-tion and triggering processes and eventually be quantified after a series of calibration tests. This transient fragmentation data will be used to evaluate the current-existing analytical fragmentation models and to propose a new model if necessary. In addition, the X-ray image data will provide the characteristic and location of initial triggering and small-scale propagation processes. Dynamic behavior of finely fragmented melt particles will be also important data to evaluate the existing analytical explosion models which employ local heat transfer among the fine particles, un-fragmented melt, vapor and water in the interaction zone.
Image processing is one of important tasks because the quantification of the fine fragmen-tation of a melt-drop during the vapor explosion is based on the images taken by both phtography and X-ray radiography. In particular, the X-ray images have significant amount of background image noise because of the X-ray back scattering and inefficiency of scintillation detector and phosphor screen. In addition to this, to quantify the data, a series of calibration tests with known geometry and material contents have to be pe-formed.
This system will be the main visualization system to be used in the coming investigation of the MISTEE program.
2.2.2 Steam Explosion Analysis with the COMETA Code
In year 2004, we employed the computer code, COMETA (Core MElt Thermalhydraulic Analysis) developed by JRC (Joint Research Center), at Ispra in Italy, for simulation of the steam explosion phenomena in the L-33 test where an intermediate scale explosion was observed in the facility. Subsequently, the code was applied to investigate the influ-ence of melt fragmentation size and hydrogen concentration on the explosion.
Recently in the TROI test series carried out at KAERI (Korean Atomic Energy Research Institute) in Korea, intermediate scale steam explosions were observed using various ditions of molten corium compositions. The geometry of the TROI set-up, operating con-ditions and corium compositions and its melt temperature were quite different from that of the FARO L-33 test. It may be noted that the earlier FARO tests with corium did not ex-hibit any steam explosion except the L-33 test. On the other hand, most of the tests carried out in the TROI facility showed steam explosions. Therefore in order to further understand the explosion phenomena, we simulated the TROI tests using the code. The dynamic
pres-sure for the TROI 13 test was predicted and the prespres-sure profile was compared with the actual tests. Next, we simulated the TROI operating conditions in the FARO L-33 test in order to understand the effects of operating conditions on the dynamic pressure. We re-tained the mass of melt, hydrogen concentration, drop size and water depth same as that in the L-33 test. But the melt temperature, test section pressure, water subcooling was the same as that in TROI. We found that the melt superheat, subcooling of the water and working pressure play significant roles in causing an explosion. Another important differ-ence between the above two tests was that the depth of water in TROI was much smaller than that in FARO. To study that, we varied the water depth in the FARO geometry for a given operating condition of TROI wherein explosion was observed.
2.2.2.1 Simulation of the FARO L-33 Test
The main objective of the FARO research program was to assess melt-coolant interaction and quenching phenomenology in water-cooled reactors severe accidents. The main com-ponents of the test facility includes the furnace, the intersection valve unit, the release
ves-sel, the interaction test section and the venting system. The direct heating UO2/ZrO2
granulate compacted between the electrodes generates melt. Then the melt is discharged through an orifice in the center into the release vessel through the release tube. The release vessel is located inside the dome-shaped upper head of the FAT vessel. The FAT test sec-tion consists of a vessel of 1.5 m internal diameter and height of about 2 m.
In order to compare the test results with the tests of the previous TERMOS vessel, an in-ternal cylinder of inin-ternal diameter of 0.71 m is inserted. Only this cylinder is filled with water and the outer annulus space is part of free volume. A debris catcher is mounted in the lower part of the internal vessel. The volume occupied by the water above the debris catcher is 0.628 m3 and the corresponding free surface is 1.62 m. A detailed description of the facility is given in the reference and Table 2.2.2 shows the operating conditions of the FARO L-33 Test.
Table 2.2.2. The FARO L-33 test operating conditions
Melt composition 80 % UO2 + 20 % ZrO2
Melt mass (kg) 100 Release diameter (m) 0.05 Pressure (MPa) 0.41 Subcooling (K) 124 Water depth (m) 1.62 Melt temperature (K) 3098 Triggering time (s) 1.128
One of the important parameters which could play a role in the steam explosion is the amount of hydrogen produced in the L-33 test. Subsequent to the tests, it was estimated that about 29.8 g of hydrogen could have been produced. However, this value depends on the mass of the fragmented melt mass which was unknown. Hence, in the simulation this value was varied in order to understand its effect on the steam explosion behavior.
Fig. 2.2.7 shows the melt jet leading edge trajectory as predicted by the COMETA code and its comparison with the L-33 data. The jet reaches the bottom of the test section, i.e. in the catcher at around 1 s as seen both by experiment and predictions. The prediction shows it to be little earlier.
0 500 1000 1500 2000 2500 0 0.2 0.4 0.6 0.8 1 1.2 Tim e (s ) H e
ight above bottom melt catcher (mm)
L-33 C O M E T A _5 L-33
Fig. 2.2.7 Simulation of melt jet trajectory using the COMETA
16 36 56 76 96 4,2 4,5 4,8 5,1 5,4 5,7 6,0 tim e - 1.1 s prem ix void fraction non-condensable fraction pressure pr es su re ( ba r)
volume num ber
16 36 56 76 96 -0,05 0,00 0,05 0,10 0,15 0,20 0,25 0,30 0,35 0,40 frac tio n Fig. 2.2.8 Thermal hydraulic behavior during the premix phase at 1.1 s in FARO L-33 test.
The thermal hydraulic phenomena during melt-water interaction at 1.1s is shown in Fig. 2.2.8. As expected, water vaporizes in the volumes 16 to 35 wherein the melt flows. The void fraction is almost zero elsewhere in the water pool. The non-condensable void frac-tion is higher at the central volume wherein the melt-water interacfrac-tion takes place. The non-condensable gases are carried to the surrounding regions by diffusion. The pressure is almost constant throughout the water pool. This is slightly higher at the central location due to presence of larger non-condensable gas and steam.
1.126 1.128 1.130 1.132 1.134 1.136 1.138 -20 0 20 40 60 80 100 pr es su re (b ar ) time (s) FARO data 940 mm from bottom COMETA, CH2=0.36 gm/kg, Ddrop=0.4 mm COMETA, CH2=0.78 gm/kg, Ddrop=0.2 mm 1 ,1 2 6 1 ,1 2 8 1 ,1 3 0 1 ,1 3 2 1 ,1 3 4 1 ,1 3 6 -1 0 0 1 0 2 0 3 0 4 0 5 0 6 0 press u re ( b ar ) tim e (s ) F A R O d a ta 4 9 0 m m fro m b o tto m C H2 = 2 0 % , Dd ro p = 0 .4 m m C H2 = 4 3 % , Dd ro p = 0 .2 m m 1,126 1,127 1,128 1,129 1,130 1,131 1,132 1,133 1,134 1,135 1,136 -20 -10 0 10 20 30 40 50 60 70 pressur e ( bar ) tim e (s)
FA R O data 715 m m from bottom
C H2 = 0.36 gm /kg, Ddrop = 0.4 m m
C H2 = 0.78 gm /kg, Ddrop = 0.2 m m
Fig. 2.2.9 Comparison of COMETA prediction with FARO data at 490, 715 and 940 mm from bottom of test section (from the top plot).
It is reported that two of the most important parameters which can influence the pressure spike during the melt water interactions, are the hydrogen production and the drop sizes during fragmentation of the melt. Both these parameters are too difficult to predict accu-rately. In fact, the sizes of the drop formed during fragmentation can vary from a lower limit to an upper limit. In the simulation, an average size of the drop was considered. Fig. 2.2.9 shows the comparison of the pressure transient at different positions on the ves-sel wall after trigger was activated at the bottom of the pool (volume 16). In all these cases, two different hydrogen concentrations were considered, i.e. 0.78 gram of hydrogen per kg of melt and 0.36 gram per kg of fragmented melt. Similarly, two different drop sizes were considered, i.e. drop size of 0.2 mm and 0.4 mm. These values were chosen in order to understand their influence on the pressure spike. From these results it is clear that a small value of hydrogen concentration and drop size gives a larger value of pressure spike. However, the hydrogen concentration of 43 % and drop size of 0.2 mm shows closer agreement to the measured value at the lower as well as at the upper parts of the vessel.
2.2.2.2 Simulation of TROI experiments
The configuration is similar to that of FARO facility. However, the melt compositions, facility dimensions and operating conditions were different from the FARO facility. In
most of the FARO tests, the UO2/ZrO2 ratio was 70/30 unlike in FARO wherein it was
80/20. The operating pressure in TROI was near atmospheric which was much lower than the FARO (about 4 bar). The water subcooling was much lower in TROI than that in FARO. While the test section diameter in both facilities were of the same order, the depth of water pool in FARO was 1.62 m and that in TROI it was only 0.67 m. These variations could bring significant changes in the dynamic pressure behavior in both facilities follow-ing the trigger. In this work, we have simulated the TROI 13 test explosion behavior usfollow-ing the code COMETA for which the dynamic pressure profile is available. Table 2.2.3 shows the main operating conditions for the test. It may be noted that this test had the problem of correct measurement of the melt temperature and the premix time phase is not exactly known. The amount of hydrogen generated in TROI 13 test has been reported to be less than 1 gram, which is much smaller than that of the FARO L-33 test. In the code, we used 0.001 gm per kg of melt, which is almost negligible.
Table 2.2.3 The TROI-13 test operating conditions
Melt composition 70 % UO2 + 30 % ZrO2
Melt mass (kg) 7.7 Release diameter (m) 0.056 Pressure (MPa) 0.1 Subcooling (K) 81 Water depth (m) 0.67 Melt temperature (K) 3500
Before analyzing the dynamic pressure behavior after trigger is actuated, it is essential to know the thermal hydraulic behavior during the premix phase. The dynamic pressure be-havior during the premix period is shown in Fig. 2.2.10. It may be noted that at about 0.95 s, the pressure starts oscillating when the melt interacts with the water during its passage resulting void formation. This implies that the mixture was almost ready to explode had there been an external trigger at this time.
The peak pressure measured in TROI 13 was about 7 MPa. The duration of the highest peak was about 1 ms and it took 1.22 s for the occurrence of energetic steam explosion after the actuation of puncher. In the predictions, we have varied the drop diameter like the previous case. For smaller drop diameter, the predicted and measured peak pressure spike is closer; however with increase in drop diameter, the peak pressure on the wall reduces As said before, the TROI operating conditions were much different from FARO. The melt temperature was much higher than that in FARO and the operating pressure was atmos-pheric in TROI while the operating pressure was about 4 bars in FARO. The peak pressure spike in TROI-13 was much higher than that observed in FARO L-33 test. In order to un-derstand how the operating conditions influence the explosion behavior, we have simu-lated the operating conditions of TROI in FARO geometry. In this work, we have varied the melt superheat and water depth and their effects on the explosion behavior have been investigated.
Fig. 2.2.11 shows the dynamic pressure profile at the bottom of the FARO test section wall for the melt temperature of 3800 K keeping the hydrogen concentration of 43 % (same as that in FARO). The melt temperature in 12 was 3800 K and that in TROI-13 was more than 3500 K. So we kept the melt temperature in this case at 3800 K. The operating pressure was kept at 1 bar similar to that of TROI case. It is interesting to note that a second pressure spike is observed at about 1.133 s which is not observed for the corresponding case in FARO. The peak pressures were slightly lower than the correspond-ing case in FARO due to higher void formation under low pressure conditions. Reduction
22 33 44 55 66 77 88 99 110 121 0,4 0,6 0,8 1,0 1,2 pressure pres su re (bar) volume number 0,0 0,2 0,4 0,6 0,8 1,0
steam void fraction non-condensable fraction
fr
ac
tion
of melt temperature to 3000 K as that in TROI-14 does not show any pressure spike. This implies that a larger melt superheat causes a larger pressure spike. However, with the same conditions reduction of hydrogen concentration can cause a stronger pressure spike. Another difference between the TROI and FARO operating conditions was the depth of water pool as said before. To understand the influence of water depth on dynamic pressure profile, we varied the water pool depth from 1.2 m to 2m in FARO. The results indicate that the pressure spike is a maximum at about 1.6 m when the melt is able to reach the bottom of the pool and the fragmentation is complete to cause a spontaneous explosion.
1.128 1.130 1.132 1.134 1.136 1.138 1.140 -10 0 10 20 30 40 50 60 70 80
TROI melt temperature 3800 (K)
TROI operating conditions in FARO geometry
pressure (bar) time (s) vol 21 vol 41 vol 61 vol 81 vol 101
Fig. 2.2.11 Effect of TROI operating conditions in FARO geometry on the dynamic pres-sure profile