http://www.diva-portal.org
Postprint
This is the accepted version of a paper published in Materials Characterization. This paper has been peer-reviewed but does not include the final publisher proof-corrections or journal pagination.
Citation for the original published paper (version of record): Hernando, J C., Ghassemali, E., Diószegi, A. (2017)
The morphological evolution of primary austenite during isothermal coarsening. Materials Characterization, 131: 492-499
https://doi.org/10.1016/j.matchar.2017.07.030
Access to the published version may require subscription. N.B. When citing this work, cite the original published paper.
Permanent link to this version:
The morphological evolution of primary austenite during
isothermal coarsening
Juan Carlos Hernando
1a*, Ehsan Ghassemali
1band Attila Diószegi
1c1 Department of Materials and Manufacturing, Jönköping University, Gjuterigatan 5, SE
551 11, Jönköping, Sweden
aJuan-Carlos.Hernando@ju.se, bEhsan.Ghassemali@ju.se, c Attila.Dioszegi@ju.se
*Corresponding author
Abstract
The morphological evolution of primary austenite in an industrial hypoeutectic lamellar cast iron was studied under isothermal conditions for coarsening times varying from 0 min to 96 h. The dendritic austenite structure formed during the primary solidification suffered major morphological changes during the isothermal coarsening process. After a sufficient coarsening time, dendrite fragmentation, globularization, and coalescence of austenite were studied using electron backscatter diffraction (EBSD) technique. This study confirmed that the secondary dendrite arm spacing (SDAS) is an inappropriate length scale to describe the primary austenite coarsening process for longer times. The application of shape independent quantitative parameters confirmed the reduction of the total interfacial area during microstructural coarsening. The modulus of the primary austenite, M , which represents the volume-surface ratio for the austenite phase, and the spatial distribution of the austenite particles, measured as the nearest distance between the center of gravity of neighboring particles, D , followed a linear relation with the cube root of coarsening time during the whole coarsening process. The mean curvature of the austenite interface, characterized through stereological relations, showed a linear relation to M and D , allowing the quantitative characterization and modeling of the complete coarsening process of primary austenite.
Keywords: Primary austenite, Microstructure evolution, Dendritic coarsening, Dendrite fragmentation, EBSD.
2
1 Introduction
Primary dendrites, formed during solidification are typically found in the microstructure of metallic alloys. These dendritic microstructures are responsible to a certain extent for the final properties of cast components. Even if the component is subjected to a heat treatment, the properties of the primary dendritic microstructures will still affect its final performance [1]. During solidification, the dendritic microstructures form within the liquid phase and the evolution of this two phases region, called the mushy zone, is governed by a coarsening process [2]. Understanding the coarsening process and any related morphological changes in the dendritic structures of cast iron alloys during solidification is of technological importance to predict and tailor the final component properties. The coarsening process, also known as Ostwald ripening, is a diffusion controlled phenomenon occurring in a wide range of two-phase systems. The driving force for coarsening is minimization of the interfacial free energy of the system, which initially is not in thermodynamic equilibrium due to its large interfacial area [3]. To minimize the free energy of the system, the interfacial area per volume tends to decrease, leading to a mass diffusion process that is associated with the curvature dependence of the equilibrium concentration, represented by the Gibbs-Thomson equation, Eq. 1 [3]:
(1)
where is the composition of the liquid at the solid-liquid interface, is the composition at the flat interface, is the capillary length, which is dependent on material parameters and H is the mean interfacial curvature, calculated as the mean of the two principal curvatures and , defined as 1/ and 1/ , where and are the principal radii of curvature.
Variations in the mean interfacial curvature, H, result in concentration gradients that lead to a diffusive transport of solute and to an evolution of the microstructure. These diffusional fluxes take place from regions of high interfacial curvature to regions of low interfacial curvature [1]. Through this diffusional process that includes dissolution and re-precipitation in the solid state, the overall length scale of the system increases and the total interfacial area decreases [4].
The microstructural coarsening process has been thoroughly studied in systems of dispersed globular particles, where the radius of the particle affects the interfacial solute concentration. In this case, the particle radius is predicted to evolve following a linear
3 relation with the cube root of the time over which solid and liquid coexist, / , and is proportional to a coarsening constant, [5, 6].
For most cast alloys, topologically complex structures such as dendrites are present in the microstructure. The coarsening of the primary dendritic phase of these alloys has been traditionally described in terms of secondary dendrite arm spacing (SDAS) [7]. Compared to the average particle radius for spheroidal particles, which is proportional to / , the SDAS shows a similar response to the coarsening process time. Therefore, and due to the practical difficulty to measure three-dimensional microstructures, SDAS has been generally considered as a valid length scale for characterization of the coarsening process in components for engineering applications [7-12].
However, during coarsening, a continuous evolution of the dendrite morphology takes place. First, the smaller arms are re-melted [7], leading to a dendrite fragmentation [13]. The original dendrite structure no longer exists at this point and detached solid particles adopt a globular shape [14]. Subsequently, these globular particles will after sufficiently long time coalesce into larger globular particles, to minimize the interfacial area per volume [9]. Under these conditions, the SDAS is no longer a suitable parameter to describe the coarsening of the microstructure.
Shape independent size scales have been suggested to describe coarsening. Marsh and Glicksman [12] found that the specific surface area of the dendritic structures, S , was proportional to the decay of curvature, and followed a linear relation to / . This relation was proven valid for conserved volume fraction systems, despite the severe morphological change in the microstructure, from fine dendrites to globular particles [12]. Voorhees and co-workers have used tridimensional reconstructions of dendritic microstructures [15] to study the coarsening process under isothermal conditions in binary systems such as Pb-Sn [1] or Al-Cu [16]. Calculations of S , characterization of the evolution of the mean curvature, H, the Gaussian curvature distribution [4], and description of the fragmentation process have been reported recently [17].
Hypoeutectic grades of lamellar cast iron are typical engineering alloys with a dendritic microstructure. In these grades, the growth and evolution of the primary phase during solidification are key factors determining the final microstructure [18] and therefore the component properties. The coarsening process of primary austenite in graphitic irons in as-cast conditions has been recently studied [19], also at different cooling rates, through interrupted solidification experiments [20] using stereological methods. However, the continuous precipitation of solid phase during solidification did not allow the
4 characterization of the complete evolution of the dendritic microstructure during coarsening.
The main stereological parameters used in those works, which are also applied in this investigation, are based on the widely acknowledged relation of the volume of a phase in the field of view [21]:
/ / (2)
where is the total volume of austenite within the total analyzed volume and is the total area of austenite within the total analyzed area .
Using a similar approach, the ratio of the volume of the austenite, , to the surface area of the primary austenite, , is defined as the modulus of primary austenite, M , and can be calculated as follows [20]:
/ / M (3)
where is the perimeter of the austenite phase.
M can be compared to the modulus of geometry employed in Chorinov’s analytical calculation of solidification, that relates the volume of a solidifying domain to the cooling surface of the domain [22].
It was demonstrated in [19] that the specific inverse surface area, S , of the primary austenite phase can be approximated by:
S / / (4)
where is the mean perimeter of the austenite phase.
Both stereological parameters showed a linear relation to / for the coarsening of primary austenite during solidification [19, 20].
In recent work [23], the hydraulic diameter of the interdendritic phase, D , was used to measure the interspace existing between the dendrites during coarsening:
D ⁄ ⁄ ⁄ (5)
Direct application of these parameters proved the relation between the coarsening process of the primary austenite phase and the mechanical performance of the alloy [23].
5 An additional stereological relation to study the coarsening process was introduced by Cahn [24] and DeHoff [25]. By different methods, both authors proposed an equivalent stereological relation to estimate the mean value of H, denoted as (H), of a distribution of particles with positive curvature in a 2D random planar section [26]. To estimate H, a test line must be swept across the planar section of interest to count the number of interceptions with particles , and the number of particles per unit area . Then H can be estimated by [27]:
H / (6)
Note that is the number of interceptions with particles per unit length and not the number of particles intercepted.
The aim of the present work is to study the morphological evolution of the primary austenite dendritic structures in lamellar graphite iron during isothermal heat treatment, presenting the tools required for the characterization of the coarsening phenomena by means of a two-dimensional investigation combined with stereological relations. The isothermal coarsening process of the primary austenite is studied for long times, by following the microstructural evolution. EBSD was used to characterize the dendrite fragmentation and coalescence. Quantitative characterization of the isothermal coarsening process was achieved using stereological relations, S , M , D and D , the spatial distribution of the austenite particles, allowing the modeling of the mean value of H during isothermal coarsening.
2 Experimental Procedure
An industrial hypoeutectic lamellar cast iron typically used for production of automotive components was produced under industrial foundry conditions with the chemical composition shown in Table 1. Cylindrical samples of ϕ50 × 100 mm were cast into sand molds. From these, cylindrical test-pieces were machined.
Table I: Chemical composition of the alloy. CE = C + (Si + P) / 3.
Element C Si Mn P S Cr Mo CE
Wt pct 3.34 1.78 0.58 0.034 0.086 0.149 0.225 3.94 After machining, the samples were subjected to a re-melting process followed by a cooling process leading to a primary solidification event and a subsequent isothermal treatment. The whole procedure was conducted using a vertical tube electrical resistance furnace, under argon gas to preserve the chemical composition of the alloy. The samples
6 were introduced into the furnace inside an alumina crucible and re-melted in a heating cycle of 90 min from room temperature to 1723 K (1450 °C) and held for 30 min. Then the samples were cooled down inside the furnace, leading to the primary solidification. The solidification process was halted when the thermal coherency temperature was reached. The thermal coherency temperature was identified in three preliminary experiments involving thermal measurements with two thermocouples, one placed at the geometrical center of the sample and a second thermocouple placed in the same planar section of the sample but in contact with the wall of the crucible. The thermal coherency was identified as the maximum temperature difference between center and wall thermocouple prior to eutectic solidification [28]. At this point, the coherent dendritic primary austenite structure was formed. Then an isothermal temperature treatment at 1448 K (1175 °C) was applied. This temperature is approximately 15 K above the equilibrium eutectic temperature estimated as 1434 K (1161 °C) in a Fe-C-Si phase equilibrium diagram for the chemical composition used. Samples were coarsened for 30 min, 1.5 h, 3 h, 6 h, 12 h, 24 h, 48 h, 72 h, and 96 h. One sample was produced for each coarsening time. These time intervals were chosen to promote the full development of the coarsening process, including long times. After the end of the isothermal treatment, the sample was quenched into water. An additional sample for 0 min of isothermal treatment was also produced to represent the original as-cast dendritic microstructure immediately prior to the isothermal treatment. This corresponded to 2 min of primary solidification [20].
The quenched samples were sectioned perpendicularly to and at the center of the longitudinal axis. After a mechanical grinding and polishing, the samples were color-etched at 381 K (108 °C), for approximately 2 min with Motz's reagent, consisting of 10 g NaOH, 40 g KOH, and 10 g picric acid dissolved in 50 mL of distilled water. Etching made the primary austenite discernible from the eutectic liquid. The full cross section of the etched sample was inspected by optical microscopy. Representative color-etched micrographs of samples coarsened for 2 min, 3 h, and 96 h showing the microstructural evolution are shown in Fig. 1a, Fig. 1b and Fig. 1c.
7
Fig. 1: Representative color-etched micrographs of the samples as a function of coarsening time: a) 0 min, b) after 3 h, and c) after 96 h.
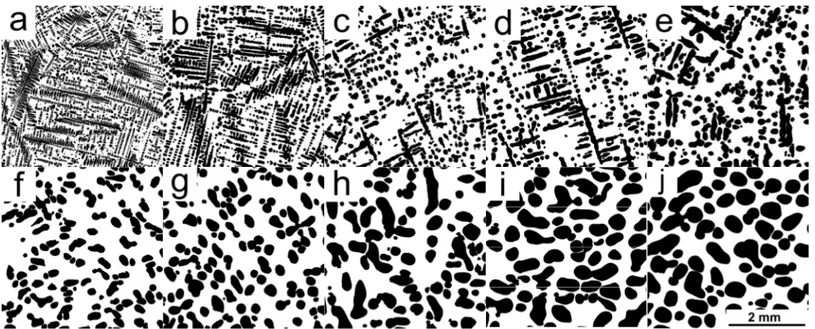
The color-etched micrographs were transformed into binary images, where dendrites were represented as black color objects. A Wacom Cintiq interactive pen display was used for this. Representative binary images of the coarsened microstructures are shown in Fig. 2. Quantitative analysis of the microstructure was performed by measuring features on the binary images. This analysis was done with the OLYMPUS Stream Motion Desktop software 1.9.1. For SDAS characterization a minimum of 7 measurements per sample with at least 3 parallel secondary arms per measurement were made.
EBSD analysis was performed on the samples coarsened for 0 min, 30 min, 6 h, 24 h, and 48 h. Samples were prepared by mechanical polishing followed by electrochemical polishing. Using an accelerating voltage of 20 kV and a step size of 1 µm, the investigation was carried out by an EDAX detector mounted on a JEOL 7001F scanning electron microscope. An area of approximately 0.6 mm × 3.3 mm was scanned for each sample. EBSD maps were further analyzed using the TSL-OIM v.7.3 software package.
3 Results and Discussion
This section is divided into two main parts, the first contains the qualitative analysis of the evolution of the microstructure, including the EBSD characterization of the samples, and the second contains the quantitative characterization of the coarsening process using the different morphological parameters presented in Section 1.
3.1. Evolution of the Microstructure
The initial dendrite structure obtained, shown in Fig. 1a and Fig. 2a, corresponds to 0 min of isothermal treatment. The microstructure shows the dendritic structure existing at the exact moment the isothermal treatment was started. Fig. 1a and Fig. 2a confirm that
8 the dendritic structure had reached and passed the dendritic coherency at that time. The samples were then subjected to the isothermal treatment after this dendritic coherency had been reached, and thus a coarsening process at constant solid fraction was promoted, avoiding other sources of morphological change in the structure except the isothermal coarsening process. The observed dendritic microstructure shown in Fig. 1a and Fig. 2a was formed by several coherent austenite grains, where each one of them showed a unique crystallographic orientation for all its dendritic structures, i.e. for the primary and secondary arms.
From the sequence of micrographs in Fig. 2, the reduction of the primary austenite surface can be measured as isothermal treatment time progresses. The primary austenite showed an increasing length scale, Fig. 2a, Fig. 2b and Fig. 2c, followed by a prominent loss of the dendritic structure, and after 3 h of isothermal coarsening, Fig. 2d, it is very difficult to find secondary dendrite arms in the microstructure. This process of dendrite fragmentation, created independent detached austenite entities, Fig. 2e, Fig. 2f, and Fig. 2g. This observation is supported by the fact that the total fraction of austenite in the central section of the samples decreased with increasing coarsening time due to sedimentation of the detached particles. After a longer coarsening time a further coarsening process by coalescence of the detached particles can also be seen in Fig. 2h, Fig. 2i and Fig. 2j.
Fig. 2: Representative binary images of the microstructures of the coarsened samples as a function of time: a) 0 min, b) 30 min, c) 1.5 h, d) 3 h, e) 6 h, f) 12 h, g) 24 h, h) 48 h, i) 72 h, and
9
3.1.1. EBSD Characterization of Dendrite Fragmentation
Although dendrite fragmentation, also known as dendrite multiplication, is a well-known phenomenon occurring during coarsening [14, 17], analysis of the two-dimensional micrographs presented in Section 3.1 cannot provide conclusive evidence of its occurrence. The apparent absence of dendritic structures in Fig. 2g–j, could merely be an artifact due to the limitations of a two-dimensional investigation. If dendrite fragmentation is occurring during coarsening, the austenite particles are expected to have a different crystallographic orientation as the coarsening progresses.
To confirm that dendrite fragmentation does in fact occur during the primary austenite coarsening process an EBSD characterization of the coarsened samples was performed. EBSD maps showing the crystallographic orientation of the primary austenite and cementite encountered in the samples coarsened after 0 min, 30 min, 6 h, 24 h, and 48 h are shown in Fig. 3.
The crystallographic orientation of the primary austenite confirmed a progressive loss of coherency, dendrite fragmentation and coalescence of the austenite particles. Fig. 3a corresponds to the original structure after 0 min of isothermal coarsening, showed large austenite grains with a common crystallographic orientation as can be seen from the uniform color of the austenite phase in the EBSD map.
The effect of the coarsening process after 30 min can be seen in Fig. 3b where the length scale of the primary austenite has increased. However, the austenite still showed a dendritic structure with a high degree of coherency. Even austenite regions that might appear to be detached from the main dendrite body showed a coherent crystallographic orientation. This means that the small austenite particles were still attached to the primary arms and share a common crystallographic orientation. After 6 h, the dendritic structure was no longer observable and the crystallographic orientation of the primary austenite particles starts to show a variation as can be seen in Fig. 3c. The dendrite fragmentation can be confirmed after 24 h of coarsening, Fig. 3d, where globular particles with different crystallographic orientations are observed in the EBSD map. Fig. 3e shows signs of coalescence of three particles with the same crystallographic orientation, indicated with arrows.
10
Fig. 3: Orientation of austenite grains of samples. Inverse pole figures after: a) 0 min, b) 30 min, c) 6 h, d) 24 h, and e) 48 h of isothermal treatment (a–e from top to bottom). RD and RA stand for Radius Direction and Rotational Axis of the sample, respectively. The reader is referred to the web
version of this article for interpretation of colors in this figure.
Considering the original coherent dendritic structure, shown in Fig. 1a, Fig. 2a and Fig. 3a, and the absence of nucleation and growth of new austenite particles during the isothermal treatment, the change in the crystallographic orientation shown in Fig. 3d and Fig. 3e can only be a result of the dendrite fragmentation motivated by the coarsening process after a sufficient isothermal time and further rearrangement of the detached particle. Once this dendrite fragmentation occurred, the presence of small convection currents in the liquid phase was sufficient to originate a change in the orientation of the particle and therefore a different diffraction pattern shown in the EBSD maps.
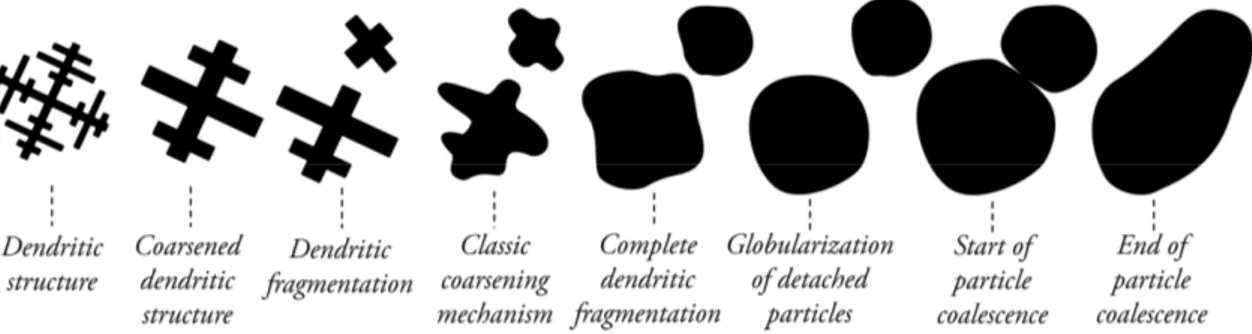
Based on these results an overview of the different stages of the coarsening process is schematically represented in Fig. 4. The first step, reduction of surface area characteristic of Ostwald ripening takes places for austenite dendrites. Subsequently, fragmentation of the dendrite structure proceeds as the coarsening time increases. The detached austenite particles the adopt a globular shape to minimize the free energy of
11 the system. The coarsening process continues, and driven by Ostwald ripening, leads to coalescence of austenite particles after a sufficiently long time.
Fig. 4. Schematic representation of the isothermal coarsening process of primary austenite.
3.2. Quantitative Characterization of the Coarsening Process
Quantitative characterization of the coarsening process was performed on two areas of 19 mm2 extracted from the central section of each sample. Because of the severe
microstructural changes observed at longer coarsening times due to the fragmentation, coalescence and sedimentation of the austenite particles, an extra area of 19 mm2 was
analyzed to improve the reliability of the characterization of the samples coarsened for 24 h, 48 h, 72 h and 96 h. The analysis of such a large area for each sample will provide strong statistical support to the quantitative analysis of the coarsening process, based on the stereological parameters presented in Section 1. Representative images of these areas are shown in Fig. 2.
3.2.1 Secondary Dendrite Arm Spacing (SDAS)
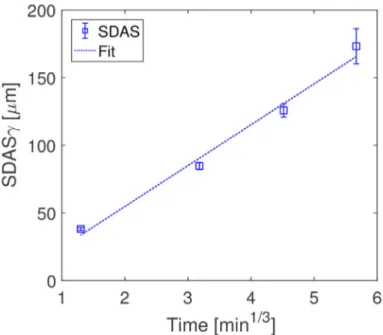
The SDAS was measured in the selected areas for the samples that still showed a dendritic structure and discernible secondary arms (isothermal treatment shorter than 3 h). The loss of dendritic structure and dendrite fragmentation occurred early in the coarsening process and only the first four samples were suitable for SDAS characterization. The SDAS shows the expected behavior, increasing linearly to t1/3, as
depicted in Fig. 5. SDAS cannot be used to characterize the coarseness of the remaining samples, since the secondary dendrite arms no longer exist.
12
Fig. 5: SDAS as a function of time. Error bars show 95% confidence intervals.
3.2.2. Mean Curvature Estimation by Stereology
By application of Eq. 6 to the binary images of the coarsened samples, we found the reduction of H with increasing time. Fig. 6 shows the evolution of inverse H as a function of coarsening time. A linear relation to the cube root of time was observed that continued throughout the coarsening process.
13
3.2.3. Quantitative Stereological Shape Independent Parameters
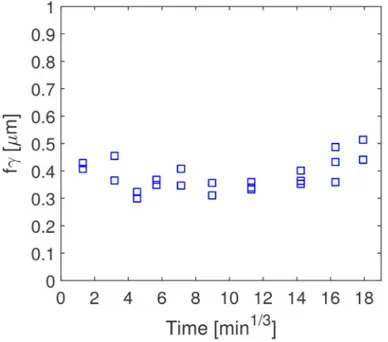
The local area fraction of primary austenite ( ), area of primary austenite (A ), perimeter of the primary austenite phase (P ), and distance to nearest austenite particle (D ) were measured using the image analysis software on the binary images. The shape independent parameters presented in Section 1, the inverse surface area per unit volume (S ), the modulus of primary austenite phase (M ), and the hydraulic diameter of the interdendritic phase (D ), were calculated from the measured parameters and used. The measured local area fraction of primary austenite, f , shows an average value of 0.38 with a standard deviation of 0.05 between the different samples (Fig. 7).
Fig. 7: Measured local area fraction of primary austenite, f , for the selected areas.
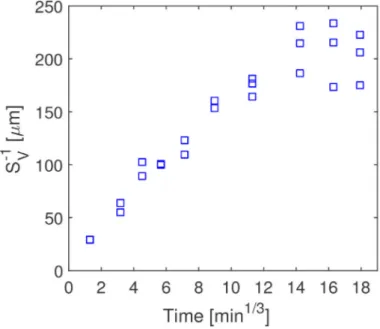
The inverse of the specific surface area, S , has been reported to be an accurate parameter to replace the SDAS in characterization of the coarseness of dendritic structures [1, 11, 14, 15]. Its linear relation to cube root of time is well known to be valid for conserved volume fraction systems [11]. Results from this work, shown in Fig. 8, validate this relation for primary austenite coarsening. However, S shows a larger scatter and does not maintain the linear trend for samples coarsened for longer times. This can be due explained by the strong sensitivity of the surface area on the solid volume fraction measured [12, 29, 30]. The decay seen in the inverse surface area, S , in Fig. 8, for the last two samples can be associated with the increase of local solid fraction, which show values over 0.5 in one of the measured areas, (see Fig. 7). This
14 increases the surface area of primary austenite, and therefore the S decreased, resulting in the last three samples having similar mean values.
Fig. 8: S as a function of time.
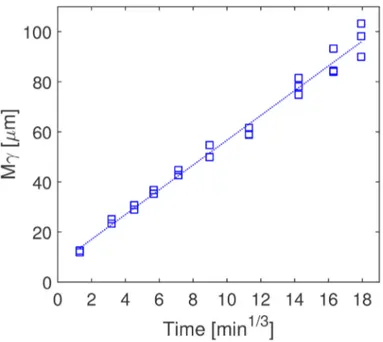
The modulus of the primary austenite phase, M , represents the coarsening of the austenite phase through the relation between the volume of the austenite phase and its corresponding surface. It is therefore independent of the shape and the total volume measured. Despite all transformations in the austenite phase during the coarsening process, this parameter showed a stable relation to the cube root of coarsening time, as shown in Fig. 9. The relation between volume and austenite surface area exhibits a constant increase proportional to the coarsening time:
15
Fig. 9: M as a function of time.
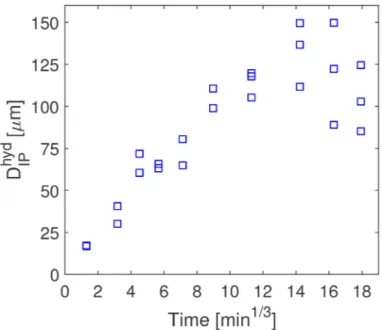
Analysis of the spatial distribution of the microstructure coarsening can be achieved by measuring two parameters: the hydraulic diameter of the interdendritic phase (D ) and the distance to the nearest austenite particle (D ). The hydraulic diameter of the interdendritic phase, D , is an expression of the length scale of the interdendritic phase and represents the coarseness of the interdendritic space between austenite particles. Fig. 10 shows of D as a function of time. A linear relation to the cube root of time is seen for the first 8 samples, but not for the last two samples. This result resembles that obtained for the dependence of S with coarsening time. As can be expected, both parameters take into account the total volume of the sample and the volume occupied by the austenite, making them both sensitive to variation of the austenite volume fraction, i.e. the austenite area fraction in two-dimensional measurements.
16
Fig. 10: D as a function of time.
D measures the distance between the center of gravity of one austenite particle and the centers of gravity of all its surrounding neighbors, and returns the smallest distance. In contrast to the variation of D , D shows a robust relation to the cube root of coarsening time, Fig. 11, since it is not related to the total volume:
D μm C μ μm min t min 33.7 23.3 t (8)
Fig. 11: D as a function of time.
The variation of H, fundamental variable to characterize the coarsening process, is coupled to the shape independent parameters M and D . Both parameters show a linear
17 relation to H as shown in Fig. 12. This way the evolution of H can be predicted with the following empirical laws Eqs. (9) and (10):
H 1 μm C KMγ μm 10 1.5Mγ
(9)
H 1 μm C KDγ μm 8 0.3Dγ
(10)
(a) (b)
Fig. 12: Relation between H and (a) M and (b) D .
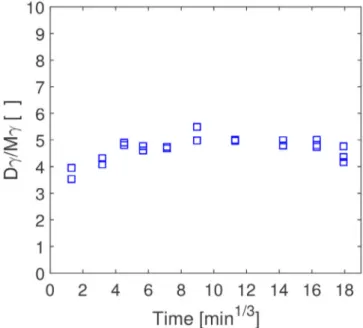
The ratio between D and M , shown in Fig. 13, is observed to be almost constant for all coarsening times. This suggest that the size-related microstructure evolution driven by the reduction in interfacial area, and the rearrangement of the particles during the coarsening process even after dendrite fragmentation, are correlated.
18
4 Conclusions
A robust understanding of the mechanisms governing the morphological evolution of the primary microstructures in cast alloys is of major importance to predict and tailor the final performance of the material. The evolution of primary austenite during coarsening under isothermal conditions at 1448 K (1175° C) for 0 min, 30 min, 1.5 h, 3 h, 6 h, 12 h, 24 h, 48 h, 72 h, and 96 h was investigated in a hypoeutectic lamellar cast iron alloy used for industrial production of automotive components. Two-dimensional investigations combined with stereological relations and EBSD analysis, were and proven to be valid tools for a successful characterization of the primary austenite coarsening process and its main characteristics. The main findings of the study are summarized below:
A qualitative model describing the different steps of the coarsening process of primary austenite is presented. The novel application of EBSD analysis to isothermally coarsened samples, confirmed the dendrite fragmentation and coalescence of primary austenite during coarsening process.
The secondary dendrite arm spacing, SDAS, showed a linear relation to t1/3 when
measurable. However, because of dendrite fragmentation, it is proven that SDAS must be replaced by other shape independent parameters to completely describe the coarsening phenomenon.
The variation of the mean curvature, which is a characteristic of the coarsening process, was illustrated and successfully measured for primary austenite using two dimensional investigations and stereological relations. The evolution of the inverse of H showed an increase proportional to t1/3.
The inverse surface area of primary austenite, S , was proven to be proportional to t1/3 for shorter times. However, due to its dependence on the measured volume
fraction, for the longer coarsening times, the trend was weaker, showing similar values for the samples coarsened for 48 h, 72 h, and 96 h.
The modulus of primary austenite, M , successfully described the reduction of surface area to volume ratio of the austenite phase and showed a stable linear relation to t1/3 for all the samples.
The distance between the centers of gravity of austenite particles, D , also linear to t1/3, was introduced to described the spatial distribution of the austenite
particles during coarsening.
The shape independence of M and D , combined with their stable relation to the mean of H, main physical characteristic of the coarsening process, allows the
19 quantitative characterization and modeling of the complete coarsening process of primary austenite.
This investigation was performed in an industrial alloy, in contrast with most of the alloys used in literature in coarsening studies, which seldom represent real cases with industrial applications. The introduced quantitative stereological parameters were proven to be related to the physical characteristics of the coarsening process and present the necessary tools to characterize the coarsening process based on a two-dimensional investigation. As an alternative to the latest 3D/4D techniques, the two-dimensional tools might be expected to have a higher impact in the research and industrial communities as they are more accessible and easier to apply to complex alloys.
5 Acknowledgements
This research was financed by VINNOVA, the Swedish Agency for Innovation, through the research project CastDesign, grant number 2013-03303. The project, within the Swedish Casting Innovation Center (CIC), is a collaboration between Scania CV AB, Volvo Powertrain Production Gjuteriet AB, Swerea SWECAST and Jönköping University. All support from these institutions is gratefully acknowledged.
6 References
[1] D. Kammer, P.W. Voorhees. The morphological evolution of dendritic microstructures during coarsening, Acta Mater. 54 (2006) 1549-1558.
[2] S. Terzi, L. Salvo, M. Suery, A.K. Dahle, E. Boller. Coarsening mechanisms in a dendritic Al–10% Cu alloy, Acta Mater. 58 (2010) 20-30.
[3] P.W. Voorhees. The Theory of Ostwald Ripening, J. Stat. Phys. 38 (1985) 231-252. [4] J.L. Fife, P.W. Voorhees. The morphological evolution of equiaxed dendritic microstructures during coarsening, Acta Mater. 57 (2009) 2418-2428.
[5] I.M. Lifshitz, V.V. Slyozov. The kinetics of precipitation from supersaturated solid solutions, J. Phys. Chem. Solids 19 (1961) 35-50.
[6] C.Z. Wagner. Theorie der Alterung von Niederschlägen Durch Umlösen, Elektrochemistry 65 (1961) 581–591.
[7] M.C. Flemings, T.Z. Kattamis, B.P. Bardes. Dendrite Arm Spacing in Aluminiun Alloys. AFS Trans. 1991. p.501-506.
[8] M. Chen, T.Z. Kattamis. Dendrite coarsening during directional solidification of Al– Cu–Mn alloys, Mater. Sci. Eng. A 247 (1998) 239-247.
20 [9] K.P. Young, D.H. Kirkwood. The dendrite arm spacings of aluminum-copper alloys solidified under steady-state conditions, Metall. Trans. A. 6 (1975) 197-205.
[10] L. Ratke. Effect of fraction solid on coarsening of secondary dendrite arms, Int. J. Cast Met. Res. 22 (2009) 268-270.
[11] A. Mortensen. On the rate of dendrite arm coarsening, Metall. Trans. A. 22 (1991) 569-574.
[12] S.P. Marsh, M.E. Glicksman. Overview of geometric effects on coarsening of mushy zones, Metall. Mater. Trans. A 27 (1996) 557-567.
[13] T.Z. Kattamis, J.M. Coughlin, M.C. Flemings. Influence of coarsening on dendrite arm spacing of aluminum-copper alloys, Trans. Trans. Metall. Soc. AIME 239 (1967) 1504-1511.
[14] M.C. Flemings. Coarsening in solidification processing, Mater. Trans. 46 (2005) 895-900.
[15] J. Alkemper, P.W. Voorhees. Three-dimensional characterization of dendritic microstructures, Acta Mater. 49 (2001) 897-902.
[16] R. Mendoza, J. Alkemper, P.W. Voorhees. The morphological evolution of dendritic microstructures during coarsening, Metall. Mater. Trans. A 34 (2003) 481-489.
[17] T. Cool, P.W. Voorhees. The evolution of dendrites during coarsening: fragmentation and morphology, Acta Mater. 127 (2017) 359-367.
[18] L. Elmquist, A. Diószegi. Relation between SDAS and eutectic cell size in grey iron, Int. J. Cast Met. Res. 23 (2010) 240-245.
[19] A. Diószegi, V. Fourlakidis, R. Lora. Austenite dendrite morphology in lamellar graphite iron, Int. J. Cast Met. Res. 28 (2015) 310-317.
[20] R. Lora, A. Diószegi. Dynamic coarsening of 3.3C–1.9Si gray cast iron, Metall. Mater. Trans. A 43 (2012) 5165-5172.
[21] E.R. Weibel. Stereological Methods, Academic Press, London, UK, 1979, vol 1, pp 26-27.
[22] N. Chvorinov. Theory of the solidification of castings, Giesserei 27 (1940) 177-186. [23] V. Fourlakidis, A. Diószegi. A generic model to predict the ultimate tensile strength in pearlitic lamellar graphite iron, Mater. Sci. Eng. A 618 (2014) 161-167.
[24] J.W. Cahn. The significance of average mean curvature and its determination by quantitative metallography, Trans. Metall. Soc. AIME 239 (1967) 610-616.
[25] R.T. DeHoff. The quantitative estimation of mean surface curvature, Trans. Metall. Soc. AIME 239 (1967) 617-621.
[26] E.E. Underwood. Quantitative Stereology, Addison-Wesley Publishing Company, Reading, Massachusetts, 1970, pp 225.
21 [27] E.R. Weibel. Stereological Methods, Academic Press, London, UK, 1980, vol 2, pp 101.
[28] N.L.M. Veldman, A.K. Dahle, D.H. StJohn, L. Arnberg. Dendrite coherency of Al-Si-Cu alloys, Metall. Mater. Trans. A 32 (2001) 147-155.
[29] O. Pompe, M. Rettenmayr. Microstructural changes during quenching, J. Cryst. Growth 192 (1998) 300-306.
[30] L. Ratke, A. Genau. Evolution of specific surface area with solid fraction during solidification, Acta Mater. 58 (2010) 4207-4211.