Gender diversity on
Swedish companies’
board of directors
MASTER THESIS WITHIN: Business Administration NUMBER OF CREDITS: 30 hp
PROGRAMME OF STUDY: Civilekonom
AUTHOR: Rebecca Källqvist & Rebecka Äremann JÖNKÖPING May 2017
A study on gender diversity in 60 Swedish listed small,
medium and large cap companies between 2009-2015
Acknowledgements
We would like to thank our supervisor for great support and advice in the process towards finalizing our master thesis.
We would also like to express our gratitude and appreciation to our seminar participants for their constructive feedback and time spent on our thesis.
Jönköping International Business School May 2017
Master Thesis in Business Administration
Title: Gender diversity on Swedish companies’ board of directors Authors: Rebecca Källqvist & Rebecka Äremann
Date: 2017-05-22
Key terms: Gender Diversity, Board of Directors, The Glass Ceiling, Female Human Capital
Abstract
Purpose: The purpose with this thesis is to examine the development of gender diversity on 20
small, 20 medium and 20 large cap Swedish listed companies board of directors between the years of 2009 to 2015. The attributes board size, gender, age and education will be examined to see if there is any gap between male and female board members, hindering gender balance and if gender quotas are needed. The purpose aims to see if gender quotas are needed in Sweden.
Research Design: The thesis contains of a quantitative study consisting of collected secondary
data. The secondary data is selected from the annual reports from 60 different companies, 20 companies from each small, medium and large cap. The variables which has been analysed in order to answer the purpose of the thesis is board size, gender, age and education.
Findings: The findings of this thesis one can conclude that the presence of female members in
the boardroom has increased over the past years. However, this increase in unstable and has not been reality for more than two years in a row. Regarding the age the findings shows that the average age tends to be lower for female members which can enhance the tendency of “the old boys club”. The findings also displays that the educational level is even regarding both females and males and that the female members possess a high level of knowledge.
Contribution: The thesis shows that there is a possible need of securing the enhancement of
gender balance since the development has been uncertain over the past years. The current proposal is gender quotas. However, to include gender quotas in statutory law is not the appropriate way to go since there is resistance from the opposition parties and parts of the business life. The thesis also displays that the argument of females not possessing the accurate educational level is not justified since the female members of the investigated companies possess the accurate educational level and it is the same level as the male members.
Value: In order to ensure equal gender balance in the boardroom to be reality in the future the
authors believe that actions need to be taken. However, the proposal of including gender quotas into statutory law has been neglected and it is negative to force an action from the companies it might be more suitable to benefit the companies, which have equal gender balance instead.
Table of Contents
Abbreviations... vi
1.
Introduction ... 1
1.1 Background ... 1 1.2 Problem ... 2 1.3 Purpose ... 3 1.4 Outline of thesis ... 32.
Women on companies’ board of directors ... 5
2.1 Corporate governance, board composition and gender diversity ... 5
2.2 Discussion about gender quotas in EU and Europe ... 7
2.3 Discussion about gender quotas in Sweden ... 8
2.3.1 Property rights for Swedish shareholders ... 11
3.
Theoretical Framework ... 12
3.1 Glass Ceiling ... 12
3.2 Female Human Capital ... 14
4.
Methodology ... 15
4.1 Research method and approach ... 15
4.2 Sample description ... 15
4.3 Data collection ... 17
4.4 Data analysis ... 17
4.5 Reliability and validity ... 18
4.6 Strengths and limitation of the case study ... 18
5.
Empirical Findings ... 20
5.1 Large Cap ... 20 5.2 Medium Cap ... 23 5.3 Small Cap ... 266.
Analysis ... 29
6.1 Gender distribution ... 29 6.2 Age distribution ... 316.3 Educational level and the possibility of female capital ... 33
6.4 The glass ceiling ... 36
6.5 Reasons for and against gender quotas ... 37
7.
Conclusion ... 39
8.
Discussion ... 41
9.
Reference List ... 43
Appendix 1 ... 54
Tables
Table 4.1 Selected companies ... 16 Table 5.1 Large cap: Total board members, board membes in percentage and
board members age ... 21 Table 5.2 Large cap: Board members education ... 22 Table 5.3 Medium cap: Total board members, board membes in percentage and
board members age ... 24 Table 5.4 Medium cap: Board members education ... 25 Table 5.5 Small cap: Total board members, board membes in percentage and
board members age ... 27 Table 5.6 Small cap: Board members education ... 28
Abbreviations
AGM Annual General Meeting CSR Corporate Social Responsibility EC European Commission
EU European Union
NASDAQ OMXS NASDAQ OMX Stockholm AB NGM Equity Nordic Growth Market NGM AB MBA Master of Business Administration The Code The Swedish Corporate Governance Code
1. Introduction
1.1 Background
The board of directors is a body that controls and runs the company and it is important to have a good board structure in order to have an effective and successful company (Mallin, 2013). A variable associated when it comes to companies’ board structure is board diversity. In broad terms, board diversity can be divided into nationality and gender (Mallin, 2013), whereas the latter will be discussed in this paper. Gender diversity on companies’ board of directors is a topic that is up to date. Today approximately 60 percent of newly graduated business and law students are women (EC, 2015). However, in 2016, the largest publicly listed companies in European Union (EU) had only 23.3 percent of female representation on their board of directors (EC, 2016). This confirms that women are underrepresented in leadership positions within EU’s corporate sector (EC, 2015). The reasons for this phenomenon is complex and it may stem from traditional stereotypes, gender roles, corporate and political cultures (EC, 2016).
The European Commission (EC) first highlighted the need to promote women on EU corporations’ board of directors in 2010. At that time, there was only 11.9 percent female representation on the largest listed companies in the EU (EC, 2015). Thus, in 2011 the EC aimed for the companies to be self-regulated, in order to certify an enhanced gender balance on the board of directors. However, in 2012 the EC could not see any progress whereupon they decided to propose a law for gender quotas, aiming for more gender balance on listed companies’ board of directors (EC, 2015). Gender balance means that there should be at least 40 percent presence of women respectively men on the board of directors (EC, 2012a). The European countries with the highest representation of women on the board of directors in 2016 were, France, Sweden, Italy, Finland, the Netherlands, Latvia, Germany, the United Kingdom, Denmark and Belgium. Thus, these are the only countries in the EU that accounts for at least 25 percent of female representation on the board of directors. The Swedish largest listed companies had approximately 32 percent female representation on their board of directors in 2016 (EC, 2016). In order to promote more female representation on the board of directors, the Swedish Department of Justice submitted a memorandum that endorsed the legislation of gender quotas for listed companies in Sweden (Ds 2016:32). However,
Sweden’s opposition parties, which hold a majority in the parliament, were against the memorandum saying that quota is not the right instrument to promote gender diversity (2016/17:CU6).
Even if there is a movement towards more female presence on the board of directors, women still have problems breaking through the glass ceiling. The glass ceiling restricts women from entering certain positions within the company, in this case a position on the board of directors (Arfken, Bellar & Helmes, 2004; Gutner, 2001). Having more gender diversity should be in the interest of the company since women and men may have different viewpoints, such as values, attitude to risk and characteristics (Arfken et al., 2004).
1.2 Problem
Having gender diversity on the board of directors enables the company to take advantage of a large pool of human capital. It is important for the board to have the right set of human capital since the knowledge pool may be expanded and this may provide the company with a competitive advantage. Thus, having female human capital on the board of directors may enhance this since female board members may bring innovation, value creation and different viewpoints to the boardroom (Campbell & Minguez-Vera, 2008). Having gender diversity on the board of directors may also give the company a better reputation, see to legitimacy and the needs of a larger pool of shareholders (Terjesen, Sealy & Singh, 2009; Bernandi, Bean & Weippert, 2002; Campbell & Minguez-Vera, 2008; Geiger & Marlin, 2012).
However, statistics show that women have problems breaking through the glass ceiling and reaching a position in the boardroom. Why this occur may stem from boardrooms choosing board members that have the same characteristics such as gender, age, experience and background (Arfken et al., 2004; Daily, 1995). Thus, this results in more male representation, even if women have similar characteristics except for gender. Even if there is a movement towards a higher percentage of women on the board of directors, the movement is slow and most boardrooms have not yet reached gender balance of 40 percent. Solutions on how to promote more women on companies’ board of directors are a topic that has been widely discusses in political context, both by the EC and in EU Member States. The most debated solution is whether quotas should be statutory law in order to ensure that women have the same possibilities as men.
There are some Member States in EU and other countries that already have implemented regulations regarding gender quotas. The debate on gender quotas is a topic that is up to date in Sweden since the Swedish opposition parties recently voted against gender quotas in 2017. One of the arguments against gender quotas in the boardroom is that there should be other means than statutory law to promote gender balance and that shareholders should decide who should be on the board (2016/17:CU6).
The Swedish government strive towards equality between women and men in their work life. However, a board is not defined as equal if there is not 40/60-gender balance on the board (EC, 2012a). Since the proposal of introducing 40 percent gender quotas in Sweden has been neglected by the Swedish opposition in 2017, it is interesting to see how the female representation on Swedish listed board of directors have developed. In order to see the development of female presence on the board of directors in Sweden, a study will be made on 20 small, 20 medium and 20 large cap companies listed on NASDAQ OMXS. Companies from each market cap will be examined to see if there are any differences. Hence, studies have mainly been made on large cap companies and it would therefore be interesting to see if there are any differences between the caps. Large cap companies may also have more pressure to reach gender diversity than medium and small cap companies. Furthermore, women and men should have the same possibilities and equal conditions to become a board member. To evaluate equal conditions between female and male board members’ attributes such as age and education will be investigated in the 60 selected companies.
1.3 Purpose
The purpose with this thesis is to examine the development of gender diversity on 20 small, 20 medium and 20 large cap Swedish listed companies board of directors between the years of 2009 to 2015. The attributes board size, gender, age and education will be examined to see if there is any gap between male and female board members, hindering gender balance. The purpose aims to see if gender quotas are needed in Sweden.
1.4 Outline of thesis
Chapter 2 depicts previous research and literature on gender diversity on companies’ board of directors. Corporate governance and board composition is discussed as well as the framework of corporate governance and the current situation in the EU and Sweden. The
effects of the non-existing gender balance is discussed in particular gender quotas and a current memorandum from the Swedish government.
Chapter 3 presents the theoretical framework for this thesis. Hence, the glass ceiling and female human capital is discussed.
Chapter 4 aims to show the reader the methodology used to implement this study. The chapter presents both an overview of the used method regarding theoretical framework and how the data is gathered.
Chapter 5 presents the empirical findings of this thesis. The chapter shows a compilation of the gathered data is tables and graphs. The tables and graphs are explained and discussed throughout the chapter.
Chapter 6 displays the analysis of this thesis. The setup of this chapter follows the same structure as the thesis does and gives the reader a picture of the subjects and how the data brings arguments to answering the purpose
Chapter 7 presents a summary of the most important aspects of the findings and a conclusion of the thesis in relation to the purpose and the gathered data.
Chapter 8 aim to show the reader a discussion of the future influences of the subject and a suggestion of how to proceed with the issue of non-equal gender balance.
2. Women on companies’ board of directors
2.1 Corporate governance, board composition and gender diversity
Corporate governance is defined as the principles, systems and processes of which a company is controlled. One of the main purposes of corporate governance is to reduce conflicts and see to the interest of the company’s shareholders. The board of directors are responsible for maintaining good corporate governance (Mallin, 2013). One way to ensure good corporate governance is to have the right board composition were one part is board gender diversity (Wagana & Nzulwa, 2016).
The construction of the board of directors is important for the company’s future development and the board is seen as the most vital internal control device because of its several responsibilities (Rose, 2007). The board of directors are responsible for controlling and leading a company and its effectiveness is significant for the company’s success in the future. A company consisting of both managers and investors uses the board as their intermediator. Therefore, it is important to choose the right members for the board positions. One challenge when constructing the board of directors is to select members that enhance the diversity of the board. This does not only include gender but also nationality, religion, age, education, experiences, education and characteristics, which enable the board with a wider perspective (Mallin, 2013). It also includes a mixture of human capital, which is associated with the skills and knowledge the members inhabit (Van der Walt & Ingley, 2003). Thus, by having the right set of human capital inside the boardroom, companies can develop key competencies and in turn obtain competitive advantages (Gates & Langevin, 2010). Gender diversity on the board of directors is a topic that has been widely discussed and reasons to include female board members can be viewed from different perspectives. Hence, scholars argue that female board members bring other opinions to the board of directors. This could increase innovation, problem-solving and help identify other stakeholders’ needs (Elstad & Ladegard, 2012; Hillman et al., 2002). Having female representatives on the board of directors could also give encouraging signals to both external and internal stakeholders (Terjesen, Couto & Francisco, 2015; Terjesen et al., 2009). A study made by Branson (2012) suggested that board gender diversity might help to better understand the market place since women hold a majority of the purchasing power (Branson, 2012). Furthermore, a gender diverse board may be beneficial in recruiting and retaining the best female personnel
(Solakoglu & Demir, 2016; Daily, Certo & Dalton, 1999). Scholars also argues that appointing female board members might enhance the independence of the board, which in turn increases the credibility for shareholders and enhances a good reputation (Terjesen, Couto & Francisco, 2015; Terjesen et al., 2009). Moreover, a study made by Elstad & Ladegard (2012) presented that female board presence increases the chances of a company participating in philanthropy issues (Elstad & Ladegard, 2012). Hence, studies suggest that there is a positive correlation between female board presence and companies’ engagement with corporate social responsibility (CSR) (Rao & Tilt, 2016; Bear & Post, 2010). Adams and Ferreira (2009) found that women tend to have less attendance problems than men and they appear to have a substantial impact on the boards’ governance (Adams and Ferreira, 2009). Even though there are positive aspects of having a gender diverse board, studies have a mixed outcome when it comes to gender diversity and firm performance. Whilst some scholars find a positive correlation between gender diversity and firm performance, others find none or a negative relationship (Rao & Tilt, 2015; Adams & Ferreira, 2009). Adams and Ferreira argue that an increase of female board members could decrease the boards’ effectiveness (Adams & Ferreira, 2009). Hence, firm performance might be affected if the decision-making process becomes more inefficient because of gender diversity (Solakoglu & Demir, 2016). This could in turn affect the firm value. Female board presence might also have a negative impact on firm performance, if women are only selected because of societal pressure (Wang & Kelan, 2013).
Furthermore, in the discussion about gender diversity in the boardroom, the critical mass of female directors needs to be taken under consideration. Hence, studies show that at least three women on the board are needed to make a difference and create change in the boardroom. One female member can be viewed as invisible, two females can change the way male board members communicate and three members can actually change the dynamics of the board (Erkut, Konrad & Kramer, 2008). The critical mass may decrease “group-thinking” in the boardroom (Branson, 2012).
2.2 Discussion about gender quotas in EU and Europe
Having equality between men and women is one of EU’s most fundamental values. In 2010, the EC put high value on the issue with unequal gender diversity on the board of directors with implementing the “Strategy for Equality between Women and Men”. The strategy also emphasised the need to promote more female presence on publicly listed EU companies’ board of directors (EC, 2010).
In 2012, EC made a proposal for a directive 2012/0299 (COD) on “improving the gender balance among non-executive directors of companies listed on stock exchanges”. In the directive, EC stated that the process of increasing female presence on company’s board of directors had been very slow. At that time, the largest listed EU companies had 13.7 percent of women on their board of directors (EC, 2012b) and the average annual increase were 0.6 percent since 2003 (EC, 2012a). The improvement progress was also unequal between Member States where Member States with binding measures had the highest progress and Member States with self-regulatory initiatives did not show any noticeable changes (EC, 2012b).
Thus, each Member State approaches the issue with female representation on the board of directors differently. For example, some Member States have established national law whereas other Member States follow the “comply or explain” model. Furthermore, some Member States are targeting large companies and others focus on listed companies etc. The EC stated in the proposal that the variation of approaches had “led to fragmentation of the legislative framework across the EU” (EC, 2012b). This leads to difficulties in comparability and confusion amongst companies, investors and stakeholders (EC, 2012b).
To minimize the different approaches and to promote more female presence on corporations’ board of directors, the directive propose that Member States should implement a minimum quantitative objective of “40 percent presence of the underrepresented gender among non-executive directors” by year 2020 (EC, 2012b). This applies to companies listed on stock exchanges. Thus, the proposal aims for gender equality in companies’ economic decision-making. It also promotes women to break through the “glass ceiling” when aiming for board positions (EC, 2012b). Hence, EC stated that 40 percent is seen as a reasonable number since it exceeds the critical mass of 30 percent, which is necessary in order for female
board members to have an actual impact, and it might not always be possible to have 50 percent gender equality (Directive 2012/0299 (COD)).
In 2013, the European Parliament voted through the proposal with strong majority for gender quotas in the board of directors. In order for the proposal to become law, the proposal needs to be jointly adopted by both the European Parliament and by the EU Member States in the Council. Furthermore, the proposal is still being discussed and the Council needs to have qualified majority for the proposal to go through. Thus, the European Parliament has a minority block against the proposal (EC, 2015).
Norway has been a leading role model for the discussion of implementing gender quotas since they were one of the first countries to implement gender quotas on the board of directors. In 2003, Norway implemented national law regarding gender quotas for all publicly traded limited liabilities companies and state-owned companies, aiming to reach 40 percent female presence in the boardroom (Lansing & Chandra, 2012). Most Norwegian firms did not comply, resulting in that the law was made mandatory in 2006 for state-owned companies and 2008 for publicly traded limited liabilities companies. (Wang & Kelan, 2013; Terjesen et al., 2015). Moreover, if a company does not comply, the company will be denied registration as a business, be forced dissolution and receive fines until the company complies (Terjesen et al., 2015). When the legislation was first implemented, Norway’s largest listed companies had approximately 20 percent female representation in the boardroom, which increased to 43 percent in 2008 (EC, 2015). The success of Norway has motivated EU Member States to implement similar legislation (Lansing & Chandra, 2012). There has been some research about the effect of gender quotas in Norway where some scholars argue that female representatives on the board of directors have had a positive effect on the boards’ effectiveness and strategic control (Wang & Kelan, 2013; Nielsen & Huse 2013). However, other scholars argue that the gender quota have led to an increase of inexperienced females on the board of directors. This has in turn affected the companies’ stock performance (Wang & Kelan, 2013; Ahern & Dittmar, 2011).
2.3 Discussion about gender quotas in Sweden
In the early 1990s, Swedish regulations regarding corporate governance was initially discussed. Due to a revision of the Swedish Companies Act, the process of constructing regulations regarding corporate governance began. Various self-regulating bodies started to
publish different guidelines and recommendations regarding issues, which were linked to corporate governance. In 2003, the first joint group started working together and the first Swedish Corporate Governance Code was published in April 2004 and entered force in July 2005. Following the realization of the Code, the Swedish Corporate Governance Board was established. The Swedish Corporate Governance Board is responsible for revising the Code (Swedish Corporate Governance Board, 2017).
The main task for the Swedish Corporate Governance Board is to monitor and revise the Code and to make sure that the content is applicable in practice. The Code has been revised several times to assure that it is suitable for the directives given by the EU. One major revision occurred in 2008, with the purpose of broadening the applicability of the Code. This enlargement included the decision that all Swedish companies who trade at the NASDAQ OMX Stockholm should follow the regulations in the Code (Swedish Corporate Governance Board, 2017).
The Swedish Company Act is the law, which publicly listed companies in Sweden need to obey. It is applicable as long as the company does not decide something else, which is only partly possible (Swedish Company Act 1 chapter 2 §). The Swedish Corporate Governance Code is a complementary regulation to the Swedish Company Act and it is used as a recommendation for companies on how to maintain good corporate governance. The aim of the Code is to ensure that companies constantly tries to improve their corporate governance and it is especially directed to companies which aims to ensure higher levels of corporate governance than what is stated in the law (Swedish Corporate Governance Code, 2016). The Code generates recommendations and norms, which are of great value for companies, however companies are not forced to obey it. The principle of comply or explain is the principle regulating how to apply the Code. A company can either choose to comply with the regulations in the Code or explain why they deviate from it (Swedish Corporate Governance Code, 2016).
The reputation of having good corporate governance can generate advantages on the market since it implies that the company runs in the best interest of the owners. How the company is governed is also a significant aspect for investors and how they value possible investments in the capital markets. Good corporate governance is, according to the Code, associated with
efficiency. An efficient market generates great conditions for the Swedish economy and its possibilities to develop in the future (Swedish Corporate Governance Code, 2016).
One aspect that is associated with good corporate governance is equal gender distribution in companies’ board of directors. The Swedish government policies strive to combat gender norms and structures. Thus, women should have the same opportunities to reach powerful and influential positions. However, this is not the case. Statistics show that there is an uneven distribution between women and men and there were approximately 32 percent women on Swedish board of directors in 2016 (Ds 2016:32). Having equal gender distribution should be in the interest of the company, since previous studies shows that this can enhance the quality of the board’s work, performance and the monitoring of the board (Kumar & Zattoni 2013).
The Swedish government strives towards having 40 percent of the underrepresented gender in listed companies’ board of directors. The goal was to reach this by spring 2016, and if the goal was not reached, the government would put forward a memorandum for implementing quotas. Since the goal was not met, the Swedish Department of Justice remitted a memorandum, which proposed to change the Swedish Company Act and regulate gender quotas in Sweden. The main target of the memorandum is to enhance the gender balance in publicly listed companies’ board of directors. The memorandum proposes a change in statutory law, stating that publicly listed companies need to have 40 percent of gender balance on the board of directors. If the company does not comply, there will be sanctions in form of fines. The number of female members is dependent on the size of the company but the general rule is that there shall be at least 40 percent presence of the underrepresented gender on the board of directors (Ds 2016:32). This regulation should only apply to the board members appointed at the AGM. Both executive and non-executive board members are included in the 40 percent quota regulation, however, employee representatives are not included (Ds 2016:32).
The Swedish opposition voted against the memorandum about 40 percent gender quotas in January 2017. Some Swedish government consultative bodies believe that there will soon be a reach of 40 percent gender balance whereas others believe that the progress is too slow. Several Swedish government instances, various organizations and publicly listed companies have uttered their opinion regarding the memorandum. The general opinion is that there
should be gender balance on companies’ board of directors, however there is a disagreement in how to accomplish it. The arguments for instituting quotas regarding gender balance are that there is a need for women to take power over the corporate world. The other side suggest that legislation regarding quotas is an infringement in the shareholder’s rights and that it is proven to be moving in the direction of equal gender balance without further mandatory legislation (Government Offices, Referral Institutions, Ds 2016:32).
2.3.1 Property rights for Swedish shareholders
According to the Swedish Company Act, the ownership rights for listed companies belong to the companies’ shareholders. Thus, shareholders have the right to vote for the companies’ interest at the AGM (Swedish Company Act, Ch. 7 § 1). At the AGM, the shareholders vote regarding the upcoming financial year. They also select the new members of the board of the directors as well as a new CEO, as long as it is not stated that the board of directors can be selected in another way (Swedish Company Act, Ch. 8 § 8 p. 47). When the European Convention regarding, fundamental rights were incorporated into the Swedish Constitution, regulations regarding property right was established (Ds 2006:11). It is a fundamental right to have the ability to own movable and immovable property without the government or anyone else interfering in this right (Institution of Government, Ch. 2 § 15).
One of the most fundamental rights for a company’s owners is the property rights. They are entitled to decide upon issues regarding their company. Deciding who gets a seat in the boardroom is one of them. The one opinion which several agrees upon is that legislation regarding gender quotas is interfering with the property rights which the owners are entitled to by law (Government Offices, Referral Institutions Ds 2016:32).
3. Theoretical Framework
3.1 Glass Ceiling
Women have for a long time faced obstacles, such as stereotypes and prevailing attitudes, when aiming for top management positions. Thus, there is an invisible barrier for women causing them to have harder times when reaching for higher positions or a boardroom seat. This barrier is called the glass ceiling, which can be hard for women to break (Daft & Marcic, 2015; Pai &Vaidya, 2009). The original definition of the glass ceiling was defined in 1986 and it states that the glass ceiling is a barrier for women who intend to possess top management or boardroom positions. It not only refers to women but to all minorities facing the same challenges when aiming for higher positions in the corporation (Hymowitz and Schellhardt, 1986). However, it is not directed to a certain kind of individual or certain personality traits, it directs to women as a group who is facing a barrier between them and their goal for a top management position. Women do not only have to face this barrier but there are also several different situations which women should manage in order to be able to start the road to a higher position (Morrison, White & Van Velsor, 1987).
The first situation is the pressure of actually handling the job and fulfil the different tasks associated with it. Top management positions naturally require more effort than lower positions and there are higher responsibilities and more people depending on you. The other object is the difference of being an executive or a non-executive on the board of directors. Not only do they need to perform well in the duties they also act as a role model for other women especially for the executive positions. The pressure of not only performing well but also the stress that if they fail it might limit the chances of the next executive member being a woman is also an obstacle. There are several situations and responsibilities to consider before deciding to aim for the top management positions or a seat in the boardroom (Morrison et al., 1987; Mahboubeh Soleymanpour, Alizadeh, & Esmaeeli, 2015).
The issue with the glass ceiling and the invisible barrier has often been connected to awareness. Several studies have been made on the subject in order to increase the awareness and inform the public about this issue. The information about the glass ceiling was previously never a subject up for discussion among the larger corporations and it was in many ways seen as an unclear phenomenon to keep males on the top management positions (Wilson, 2014). However, this has started to change. When there is an increase of women on top
management positions and in the boardroom, further women will have the possibility to achieve these positions. It may also give the rather sceptical ones a chance to change their mind of women on boards and this might enhance the chances of women being selected. It is proven that women contribute with different views and characteristics, which might enhance the work of the board of directors and benefit the corporation (Morrison et al, 1987; Mahboubeh Soleymanpour et al, 2015).
Another reason included in the glass ceiling theory is the so called “old boys club”. Male operators in companies tend to look after one another through various activities and female representatives are excluded from participating (Lang, 2011). It is said that the “old boys club” can increase the chances of a higher and more attractive status on the labor market since the contacts and the social capital of the old boys’ club has a high value. There is evidence saying that females lack this social capital and this decreases their chances of achieving a higher position in a company and limits their labor opportunities (McDonald, 2011). However, this situation is not an easy issue to discover and in many cases this is a part of the corporate culture. Male members who are selected into a board of directors have an advantage over a female member in the cases where this culture still exists. This situation can reduce the chance of the female member performing as well and effective as the male members and thereby the remaining members might oppose female members in general (Tavakolian, 1993). The age of the board members may also be an influencer to “old boys club”. Hence, some researchers claim that older board members may stereotype women and favour men instead, particularly if the male board members are over 70. Younger male directors are more likely to see the value of female directors (Scott & Marlin, 2012).
3.2 Female Human Capital
Human capital refers to the unique set of skills that humans have. It signifies individuals’ education, expertise and experiences, which can be beneficial to the company where she or he works (Becker, 1964). Thus, companies use these set of skills in order to enhance the company’s performance (Dunn, 2012; Dalton et al., 1998). Women represent a large pool of human capital and today scholars argue that women bring different viewpoints and opinions to the boardroom. However, the traditional assumption when recruiting new individuals to the boardroom has been that females lack important human capital for the position. Earlier more men tended to have higher educational level than women (Terjesen et al., 2009; Burke, 2000). Though, studies made by Eurostat Statistics shows that this is no longer the case (Eurostat Statistics, 2015).
Within EU, approximately 53,5 percent of the bachelor degrees, 57,4 percent of the master degrees and 46,4 percent of doctoral degrees are held by women. In Sweden, approximately 63,2 percent of the bachelor degrees, 56,9 percent of the master degrees and 48,8 percent of the doctoral degrees are held by women (Eurostat Statistics, 2015). However, even if women tend to have more educational experience, scholars argue that they still lack important human capital for positions on the board of directors (Terjesen et al., 2008; Fitzsimmons, 2012). Thus, women may lack experiences from top decision-making positions. Approximately 12 percent females had a CEO position and 15 percent had an executive director position within the largest organizations in EU (EC, 2017). Since women do not have the same top decision-making positions as men, females’ human capital is minimized in terms of “fewer chances to gain new job skills, management and work experience” (Singh et al., 2008; Van Velsor & Hughes, 1990). Thus, in order to fully utilize female human capital, the glass ceiling barrier needs to be diminished, else a large pool of human capital gets lost (Fitzsimmons, 2012).
4. Methodology
4.1 Research method and approach
This research study is based on a quantitative research. A quantitative research method is based on already existing data, mainly numbers, which is collected and analysed in order to answer the assigned research question. Hence, already existing data, in form of attributes, will be collected. The attributes collected in this thesis are; board size, male and female board members, age and education. This study also adopts a deductive approach. The aim with the deductive approach is to provide the reader with descriptive research (Bryman, 2016). Thus, the outcome of this study portrays the development of female presence on selected Swedish companies board of directors and if there is any hinder for women to receive a position on the board with regards to female human capital and glass ceiling theory.
4.2 Sample description
Since the aim of this study is to examine gender diversity on the board of directors in Swedish listed companies, a sample had to be selected. Hence, in 2015 there were 288 listed companies in Sweden and it would be too extensive to analyse all companies’ annual reports over a time period of seven years (Ds 2016:32). Therefore, a selection has been made in order to answer the purpose of this thesis. 20 companies from each small, medium and large market cap were examined, which generated a total of 60 companies. Each market cap is categorized as follows: Large Cap requires a market capitalization of more than one Billion Euro, medium Cap requires a market capitalization between 150 Million Euro and one Billion Euro and Small Cap requires a market capitalization less than 150 Million Euro (Nasdaq OMX Nordic, 2017).
This selection has been made from the authors’ opinions in order to answer the purpose. Since the amount of listed companies in each market cap varies, a decision was made to rank the companies in each market cap based on their announced turnover in 2015 annual report. The companies with the highest turnover were selected. However, some of the companies had insufficient information about the selected attributes, such as board size, gender, age and education, and they were therefore excluded. Companies were also excluded if they were not traded on the NASDAQ OMXS during the selected time period of 2009-2015. Another requirement for the selected companies was that all companies should have their headquarters in Sweden. Information about the companies’ market cap, turnover and
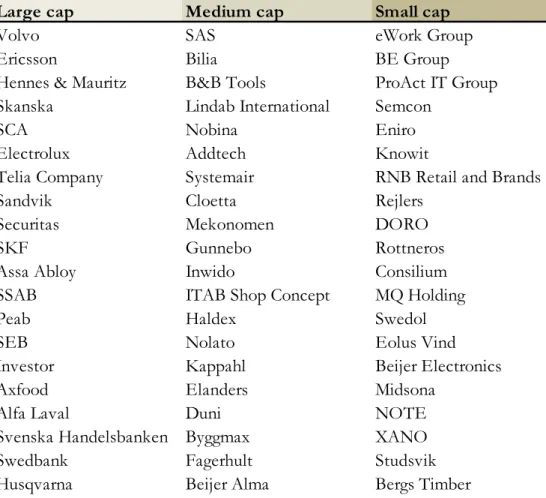
headquarters was retrieved from NASDAQ and Morningstar’s fact sheets (NASDAQ, 2017; Morningstar 2017). Moreover, no regards to the companies’ branch classification have been made. The following companies were examined (Table 4.1).
Table 4.1 Selected companies
Companies ranked based on the highest announced turnover 2015.
Following companies were excluded from the original sample since the requirements could not be retrieved from the annual reports. Atlas Copco, Ica Gruppen, NCC and Boliden were excluded from the original large cap sample. Capio, Scandic Hotels, Beijer Ref, Academedia, Dustin Group, Claes Ohlsson, Coor Service management, Humana, Gränges, Qliro and New Wave were excluded from the original medium cap sample. Arctic Paper, Bong, Midway, Viking Supply ship, Electra Gruppen, KABE Husvagnar, TradeDoubler, Uniflex and Profilgruppen were excluded from the original small cap sample.
Large cap Medium cap Small cap
Volvo SAS eWork Group
Ericsson Bilia BE Group
Hennes & Mauritz B&B Tools ProAct IT Group
Skanska Lindab International Semcon
SCA Nobina Eniro
Electrolux Addtech Knowit
Telia Company Systemair RNB Retail and Brands
Sandvik Cloetta Rejlers
Securitas Mekonomen DORO
SKF Gunnebo Rottneros
Assa Abloy Inwido Consilium
SSAB ITAB Shop Concept MQ Holding
Peab Haldex Swedol
SEB Nolato Eolus Vind
Investor Kappahl Beijer Electronics
Axfood Elanders Midsona
Alfa Laval Duni NOTE
Svenska Handelsbanken Byggmax XANO
Swedbank Fagerhult Studsvik
4.3 Data collection
The data for this case study is collected from the selected companies’ annual reports, between the years of 2009 to 2015. Thus, seven annual reports from each company were examined. Each annual report was downloaded from the company’s website. However, the only section examined in the annual reports were the section about corporate governance, since this part displays information about the structure of the board and its board members. The data collected contains of four variables, such as board size, gender, age and education. All data are presented in excel files and tables.
4.4 Data analysis
The boards’ size, gender, age and education are the variables that have been collected in this case study. The size of the board is of importance in order to see the gender diversity on the board of directors. The board size only includes members selected on the annual general meeting (AGM) hence, employee representatives were not to be included. The size will be analysed for the purpose of receiving the boards’ average gender diversity between men and women and to see how many women in total have a position on the board over each year. Hence, the amount of female and male board members was calculated in both numbers and percentage. Furthermore, a calculation of the increase and decrease of female representatives was made each year. Board members age was examined in order to see if and how much the age difference is between male and female board members. An average age for female respectively male board members was calculated for each year. This was made in order to see if there is any gender age gap between the board members. Moreover, a calculation of the youngest and oldest female and male board member in each market cap was made for each examine years.
Board members’ education was examined in order to see if there is any difference in educational level between female and male board representatives. Following educational levels have been examined; Master of business administration (MBA), master degree, bachelor degree, doctoral degree, two or more degrees, other education and no education. An educational degree that cannot be specified or inferred from the annual report has been sorted under other education. Hence, in order to see the distribution of each educational level between male and female directors, a percentage calculation was made each year. Board members’ education has been presented in tables were F represents women and M represents men.
4.5 Reliability and validity
In order to measure a study’s reliability, three different factors need to be taken into consideration. These are stability, internal reliability and inter-rater reliability. Stability refers to the test-retest method, which means that there should be little variation between the test and a retest. Internal reliability refers to the consistency of the variables (Bryman, 2016). Hence, the same variables such as; board size, male and female board members, age and education has been examined in all selected companies. Inter-rater reliability is when subjective judgement is involved in the translation of data, which may affect the consistency (Bryman, 2016). Some subjective judgement, in form of interpretation, has been made when collecting the educational data. Furthermore, validity refers to the correctness of a study (Bryman, 2016). Since the study is based on data from the companies’ annual reports, one may assume that the information is correct and valid.
4.6 Strengths and limitation of the case study
This study is based on secondary data. The advantage from using secondary data is that it is less time consuming, the data is of high quality and it generates a possibility for a broader and longitudinal analysis. The negative view of the secondary data analysis could be that data is missing or that it is very complex data. Moreover, even if secondary data is most often of high quality, the user needs to be cautious of the quality of the data (Bryman, 2016). The advantages of secondary data exceed the disadvantages for this thesis. Hence, the variables collected are available in the selected companies’ annual reports and by using them enables the authors to make a longitudinal examination, without it being too time consuming. The data is also assumed to be of high quality since it is collected from companies’ annual reports. Since the sample is based on a total of 60 companies, it is important to note that the sample have some difficulties in representing the whole population. However, due to the variables collected in the sample, it would have been too extensive and time consuming to examine a larger sample. Even if 60 companies do not represent the whole population, a trend within each examined company and cap can be made. Additionally, studies on gender presence on the board of directors made by the EC have been made on the largest listed companies in Sweden, which are approximately 26 companies. Hence, the sample of 20 companies in each cap may be justified. Due to the fact that the companies have been selected based on their
turnover, some sample bias may occur. Sampling bias means that some members of the population stand no or little chance of being selected (Bryman, 2016).
5. Empirical Findings
The empirical findings of this thesis have been collected and compiled by analysing the corporate governance section of the selected companies’ annual reports. Seven years, 2009 to 2015 has been analysed and following tables will show the development during these years. The attributes which has been analysed is board size, female presence, age and education. The tables shall give the reader a picture of how the selected attributes have changed over the years as well as between the different market caps.
5.1 Large Cap
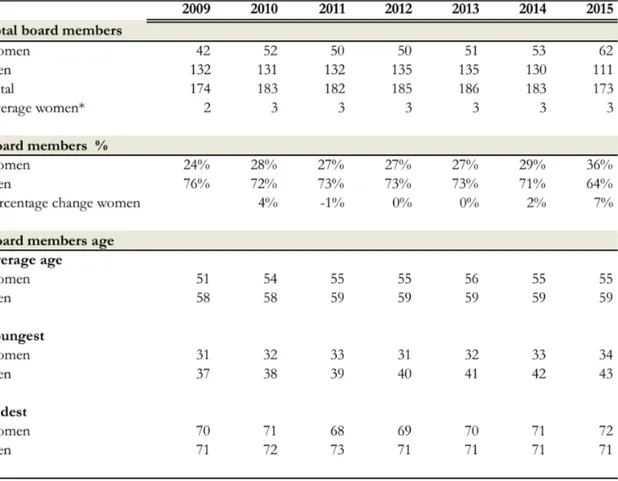
The total amount of board members in large cap companies has been fairly steady over the time period examined. However, during 2009 and 2015 the total amount of board members was 9-10 members lower. The total amount of female board members has also been fairly steady over the time period, except for 2009 and 2015. Between 2009 and 2010, female representatives increased with 10 women whereas the male representatives declined with one. Between 2014 and 2015, female representatives increased with nine women and male representatives declined with 19 board members. Hence, between 2009 and 2015, female board representatives have increased with 20 women. Male board members have decreased with 21 men during 2009 and 2015. Table 5.1 show that female board member representatives have increased over the examined time period, with an increase of approximately 12 percent. Between 2010 and 2011, the percentage decreased with 1 percent and it kept steady until 2014. The highest increase of female board representatives was between 2014 and 2015 with an increase of seven percent. Thus, in 2015, female board representation reached 36 percent. Moreover, in 2009 each board had an average of two women whereas in 2015, the average was three. This is an increase of one female board member (Table 5.1).
Regarding board members average age, female board members tend to have a lower average age than men. The largest age gap was in 2009, with a seven-year difference. However, the age gap has reduced over the examined time period and in 2015 there was a four-year average age difference between female and male board representatives. The youngest female board member tends to be younger than the youngest male board member. Thus, the largest age gap between the youngest board members is nine years. The youngest female board member was 31 in 2009 and 2012 and the youngest male board member was 37 in 2009. There is not any larger age gap between the oldest female and male board member. Hence, the oldest
female board member was 72 in 2015 and the oldest male board member was 73 in 2011 (Table 5.1).
Table 5.1 Large cap: Total board members, board membes in percentage and board members age
* Displays the average number of women on each company’s board.
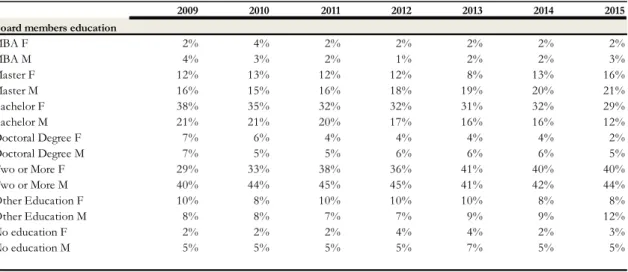
Table 5.2 depicts large cap board members educational level. The percentage of board members with a MBA degree is rather equal between male and female board members and the development during the examined time period has been steady. Board members with a master degree have increased for both male and female board members during the examined time period. However, more percentage of male board members had a master degree than female board members. 12 percent of female board members had a master degree in 2009 and 16 percent had a master degree in 2015. Board members with a bachelor degree have decreased for both male and female members during the examined time period. Thus, 38 percent of female board members had a bachelor degree in 2009 contrary 29 percent in 2015. 21 percent of male board members had a bachelor degree in 2009 and 12 percent had a bachelor degree in 2015. Board members with a doctoral degree have decreased for both
male and female board members during the examined time period. Hence, more male board members had a doctoral degree in 2015 (Table 5.2).
Board members with two or more educations have increased for both male and female board members. There has been an 11 percent increase of females with two or more educations between 2009 and 2015. In 2009, 29 percent females had two or more educations and in 2015, 40 percent had two or more educations. Male board members with two or more educations have increased with 4 percent over the examined time period. In 2009, 40 percent of male board members had two or more educations and 44 percent had two or more educations in 2015. Thus, in 2009 there was an 11-percentage difference between male and female directors whereas in 2015 there was a 4 percent difference. The table show that the largest percentage of male directors has two or more educations. Also, most female board members had two or more educations in 2015. Board members with other educations have been rather steady over the examined time period. Hence, female board members with other education have varied between 8-10 percent whereas male board members with other educations have varied between 7-12 percent. Furthermore, male board members have a marginally higher percentage of no education than female board members. This has been steady over the examined time period (Table 5.2).
Table 5.2 Large cap: Board members education
2009 2010 2011 2012 2013 2014 2015
Board members education
MBA F 2% 4% 2% 2% 2% 2% 2% MBA M 4% 3% 2% 1% 2% 2% 3% Master F 12% 13% 12% 12% 8% 13% 16% Master M 16% 15% 16% 18% 19% 20% 21% Bachelor F 38% 35% 32% 32% 31% 32% 29% Bachelor M 21% 21% 20% 17% 16% 16% 12% Doctoral Degree F 7% 6% 4% 4% 4% 4% 2% Doctoral Degree M 7% 5% 5% 6% 6% 6% 5% Two or More F 29% 33% 38% 36% 41% 40% 40% Two or More M 40% 44% 45% 45% 41% 42% 44% Other Education F 10% 8% 10% 10% 10% 8% 8% Other Education M 8% 8% 7% 7% 9% 9% 12% No education F 2% 2% 2% 4% 4% 2% 3% No education M 5% 5% 5% 5% 7% 5% 5%
5.2 Medium Cap
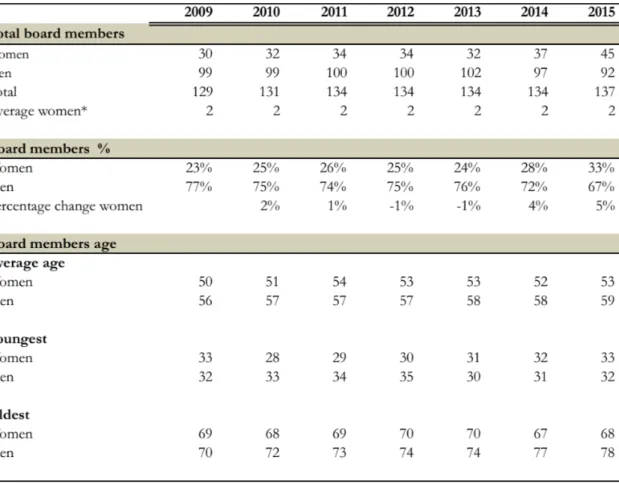
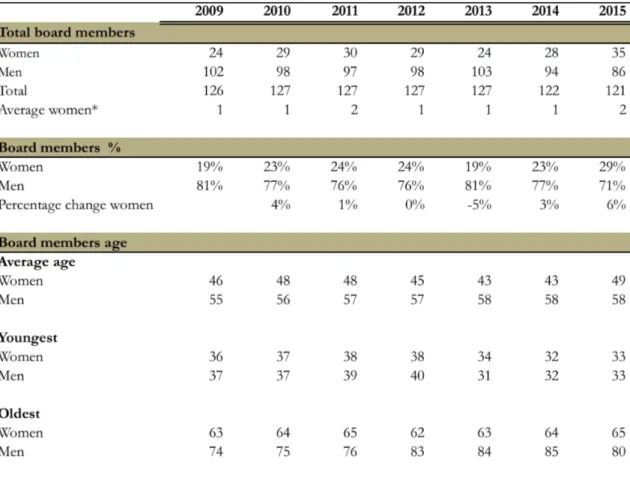
The total amount of board members in medium cap companies has increased with eight board members during the examined time period. Hence, between 2010 and 2014, the total amount of board members was rather steady. The total amount of female board members has increased with 15 females between 2009 and 2015. The total amount of male board members has decreased with seven men during the examined time period. Table 5.3 show that female board members have increased over the examined time period, with an increase of 10 percent. Between 2011 and 2012, the percentage of female board members declined with one percent. The same occurs between 2012 and 2013, with one percentage decrease of female board members. The highest percentage of female board representatives was between 2014 and 2015, with an increase of five percent. Thus, in 2015, female board representation reached 33 percent. Furthermore, each company had an average of two female board members over the examined time period (Table 5.3).
Regarding board members average age, female board members tend to have a lower average age than men. The age gap between male and female board members varies between three to six years. Hence, the age gap between female and male board members was six years in both 2009 and 2015. There is no larger age gap between the youngest female and male board member. The youngest female board member was 29 in 2011 and the youngest male board member was 30 in 2013. The oldest female board members tend to be younger than the male board members and the largest age gap was in 2014 and 2015, with 16 year age difference. Furthermore, the oldest female board member was 70 in 2012 and 2013 and the oldest male board member was 84 in 2015 (Table 5.3).
Table 5.3 Medium cap: Total board members, board membes in percentage and board members age
* Displays the average number of women on each company’s board.
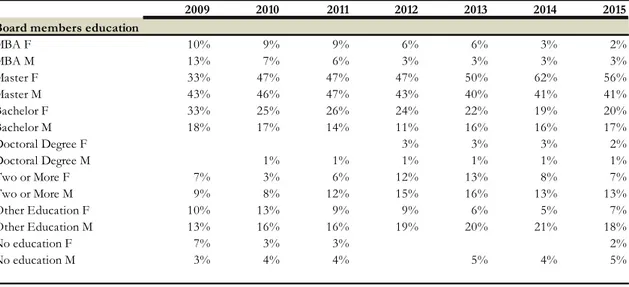
Table 5.4 depicts medium cap board members educational level. The percentage of board members with a MBA degree has decreased for both male and female board members during the examined time period. There has been an eight percent decrease for female board members with an MBA between 2009 and 2015 and ten percent decrease for male board members. In 2009 and 2015, more percentage of male board members had a MBA whereas more percentage of female board members had a MBA in 2010, 2011, 2012 and 2013. Board members with a master degree have increase for female board members, with an increase of 23 percent. Thus, 33 percent of female board members had a master degree in 2009 contrary 56 percent in 2015. Male board members with a master degree have been rather steady over the examined time period. Furthermore, a majority percentage of female and male board members had a master degree in 2015. Female board members with a bachelor degree as decreased with 13 percent over the examined time period. In 2009, 33 percent of female
board members had a bachelor degree contrary 20 percent in 2051. Male board members with a bachelor degree have been steady over the examined time period. Neither female nor male board members had a doctoral degree in 2009. Between 2010 and 2015, one percent of male board members had a doctoral degree. Hence, between 2012 and 2015 2-3 percent of female board members had a doctoral degree (Table 5.4).
The percentage of female board members with two or more educations has varied between 3-13 percent under the examined time period. However, seven percent of female board members had two or more educations in 2009 and 2015. The percentage of male board members with two or more educations has varied between 8-16 percent under the examined time period. In 2009, nine percent of male board members had two or more educations in contrary to 13 percent in 2015. Female board members with other education have varied between 5-13 percent whereas male board members with other education have varied between 13-21 percent over the examined time period. In 2015, more percentage of male board members had other education than female board members. Between 2009-2011 and 2015, both male and female board members had some percentage of no education. Hence, all female board members had education during 2012 to 2014. All male board members had education in 2012 (Table 5.4).
Table 5.4 Medium cap: Board members education
2009 2010 2011 2012 2013 2014 2015 Board members education
MBA F 10% 9% 9% 6% 6% 3% 2% MBA M 13% 7% 6% 3% 3% 3% 3% Master F 33% 47% 47% 47% 50% 62% 56% Master M 43% 46% 47% 43% 40% 41% 41% Bachelor F 33% 25% 26% 24% 22% 19% 20% Bachelor M 18% 17% 14% 11% 16% 16% 17% Doctoral Degree F 3% 3% 3% 2% Doctoral Degree M 1% 1% 1% 1% 1% 1% Two or More F 7% 3% 6% 12% 13% 8% 7% Two or More M 9% 8% 12% 15% 16% 13% 13% Other Education F 10% 13% 9% 9% 6% 5% 7% Other Education M 13% 16% 16% 19% 20% 21% 18% No education F 7% 3% 3% 2% No education M 3% 4% 4% 5% 4% 5%
5.3 Small Cap
The total amount of board members in small cap companies has been steady over the examined time period. However, the examined companies had five board members less in 2015 than in 2009. The total amount of female board members has increased over the examined time period, with an increase of 11 women. Hence, male board members have decreased with 16 men between 2009 and 2015. Table 5.5 show that female board members have increased over the examined time period, with an increase of 10 percent. Between 2012 and 2013, the percentage decreased with five percent. The highest increase of female representatives was between 2014 and 2015 with an increase of six percent. Hence in 2015, female board representation reached 29 percent. Furthermore, each company had an average of one female board members over the examined time period, except for in 2015 when the average was 2 (Table 5.5).
Regarding board members average age, female board members tend to have a lower average age than male board members. The largest age gap between male and female board members was in 2013 and 2014 where the age difference was 15 years. The lowest age gap was in 2009 and 2015, with an age difference of nine years. There is no larger age gap between the youngest female and male board member. The youngest female board member was 32 in 2014 and the youngest male board member was 31 in 2013. The oldest female board member tends to be younger than the oldest male board member. Hence, the largest age gap between the oldest board members is 25 years. The oldest female board member was 65 in 2012 and the oldest male board member was 85 in 2014 (Table 5.5).
Table 5.5 Small cap: Total board members, board membes in percentage and board members age
* Displays the average number of women on each company’s board.
Table 5.6 depicts small cap board members educational level. Board members with a MBA are rather equal amongst female and male board member over the examined time period. However, between 2012 and 2015 more percentage of the female board members had a MBA. The percentage of female board members with a master degree has increased with 16 percent between 2009 and 2015. Thus, 33 percent of female board members had a master degree in 2009, contrary to 49 percent in 2015. Male board members with a master degree have been rather steady over the examined time period. A majority percentage of male board members had a master degree during the examined time period. From 2010, a majority percentage of female board members had also a master degree. Board members with a bachelor degree is rather equal between male and female directors, however, from 2011 to 2015 more percentage of male directors had a bachelor degree than female directors (Table 5.6).
No female board member had a doctoral degree and one percentage of male board members had a doctoral degree in 2009. Board members with two or more educations have increased over the examined time period for both male and female board members. In 2009, four percent of female and male board members had two or more educations. Nine respectively eight percent of female and male board members had two or more educations in 2015. Board members with other educations were higher for female board members between 2009 and 2012. Moreover, most female board members had other education between 2009 and 2011. Male board members with other education have been steady over the examined time period. All female board members had education between 2009 and 2015. Six percent of male board members did not have any education in 2009 contrary three percent in 2015. Hence, male board members with no education has decreased in 2015 (Table 5.6).
Table 5.6 Small cap: Board members education
2009 2010 2011 2012 2013 2014 2015 Board members education
MBA F 4% 3% 3% 3% 4% 4% 6% MBA M 4% 4% 4% 2% 2% 1% 3% Master F 33% 38% 47% 52% 54% 61% 49% Master M 48% 50% 44% 45% 47% 47% 47% Bachelor F 13% 10% 7% 7% 8% 7% 11% Bachelor M 12% 8% 10% 11% 14% 14% 13% Doctoral Degree F Doctoral Degree M 1% Two or More F 4% 3% 3% 3% 8% 11% 9% Two or More M 4% 8% 8% 8% 7% 6% 8% Other Education F 46% 45% 40% 34% 25% 18% 26% Other Education M 25% 24% 25% 28% 27% 30% 26% No education F No education M 6% 5% 8% 6% 4% 2% 3%
6. Analysis
Studies show that women are underrepresented in the board of directors. The reasons for this is complex and it may stem from traditional stereotypes, gender roles or corporate culture. Even if there is a movement towards more female presence on the board of directors, women still have problems breaking through the glass ceiling. Hence, assumptions have been made that females lack the right set of human capital for a board position. Equal gender balance in the boardroom has recently been highlighted by the Swedish Government through a proposal of 40 percent gender quotas. This has been neglected by opponents, stating that quotas are not the right mean to use in order to enhance female presence in the boardroom. However, gender balance has not yet been reached. The intention of this analysis is to examine the development of gender diversity on 20 small, 20 medium and 20 large cap Swedish listed companies’ board of directors between the years of 2009 to 2015. The empirical findings aim to show if there are reasons hindering gender balance.
6.1 Gender distribution
The board of directors is responsible for maintaining good corporate governance. One way to ensure good corporate governance is to have an appropriate board composition (Wagana & Nzulwa, 2016). By combining the most suitable board members, the company could receive a comparative advantage, success, better reputation etc. (Mallin, 2013). This includes having a good balance of female and male board members. Female board members have traditionally been underrepresented in the boardroom. Even though, the Swedish government strives towards having 40 percent of the underrepresented gender in listed companies’ board of directors.
Research made on gender distribution shows that there are numerous arguments to why there should be an increase of female representation in the boardroom. Scholars argue that female board members may bring other opinions to the board and Elstad and Ladegard (2012) argues that this might increase innovation and problem-solving etc. Hence, females may bring other viewpoints, which could be beneficial to the board. Having a gender diverse board also reflects the companies’ shareholders and stakeholders better, since they often consist of both men and women. A gender diverse board may also understand their shareholders and stakeholders needs better. Furthermore, Elstad and Ladegard (2010) argues that female board members could increase the boards concern over a company’s
philanthropy activities and CSR. There has been an increase of CSR interests and by including more female board members could enhance companies’ engagement regarding CSR issues. Moreover, having a gender diverse board may also increase the companies’ reputation (Terjesen et al., 2009). Even if scholars find a positive correlation between gender diversity and firm performance, other scholars find none or even a negative relationship (Rao & Tilt, 2015; Adams & Ferreira, 2009). However, the advantageous of including women in the board of directors should in most cases outweigh the negative.
The empirical findings show that there has been an increase of female board members over the seven examined years. Hence, the large cap companies had an average of 36 percent female board members in 2015, contrary to 24 percent in 2009. This increase of 12 percent indicates that large cap companies are moving towards the goal of 40 percent gender balance. The medium cap companies had an average of 33 percent female board members in 2015, which is an increase of 10 percent since 2009. Thus, in 2009 medium cap companies had an average of 23 percent female board members. Even if medium cap companies had three percent lower female presence than large cap in 2015, the percentage of increase still indicates that there is a movement towards 40 percent gender balance.
The small cap companies had an average of 29 percent female board members in 2015, contrary to 19 percent in 2009. The increase of 10 percent since 2009 shows that small cap companies are also moving towards 40 percent, however, it is noticeably lower than for medium and large cap companies. This difference between the different market caps may depend on the various demands from shareholders, stakeholders and society regarding gender balance in the boardroom. However, the data shows that all market caps are moving towards meeting the desirable goal of 40 percent gender balance. The largest increase in female board presence was between 2014 and 2015, which was the same for all market caps. There has both been an increase and decrease of female board presence during the examined years and because of the irregularity in female presence each year, it is hard to say when the goal of 40 percent will be reached in Sweden. Hence, between 2011 and 2013 there was stagnation and even a decrease in the amount of female board members in all market caps. It is difficult to analyse why this decrease have occurred. However, it is interesting to point out since it happened in all market caps.
The percentage of female presence is not the only important factor to analyse. Hence, the actual number of females on the board of directors should be taken into consideration as
well. Scholars argue that at least three women on the board is a desirable number, in order to make a difference in the boardroom (Konrad et al., 2008). In 2015, large cap companies had an average of three female board members, medium cap companies had an average of two female board members and small cap companies had also an average of two female board members. This may indicate that it is more difficult for small and medium cap companies to change the board dynamics. However, large cap companies have more board members in total than medium and small cap companies. Since medium and small cap companies have a lower amount of total board members, it could affect the number of females in the boardrooms. This could indicate that females do not have as much influence as the male board members. However, all market cap companies should strive towards having equal gender distribution since studies shows that this could enhance the quality of the board’s work, performance and the monitoring of the board (Kumar & Zattoni 2016).
6.2 Age distribution
Board members age distribution is an interesting variable to analyse. It does not only indicate the experience of the board member but it could also be an influencer to the “old boys club”. Some researchers claim that older board members favour male members instead of female members whereas younger male board members are more likely to see the benefits with female board members (Scott & Marlin, 2012).
The empirical findings display that the average age for female directors tends to be lower than for male directors in all three market caps. The average age could reflect how experienced the board members are and in this case, female and male board members are probably equally experienced. Although the findings show that the average age for female board members tend to be lower, the difference between the oldest and the youngest board members varies in the different caps. The large cap companies show that there are not a larger age gap between female and male board members and in combination with the fact that the female presence has increased over the years, the age gap in the large cap companies does not indicate a hinder for women entering the boardroom.
The average age for medium cap companies has kept steady for both female and male board members over the examined time period. There is not any larger age gap between the youngest female and male director. Unlike for large cap companies, the youngest female director was older than the youngest male director in 2009, 2013 and 2014. Moreover, the