A Comparison of Management
Performance Measures
Master‟s thesis within Business Administration Author: Andreas Jivsäter
Marcus Martinsson
Tutor: Urban Österlund
Master‟s Thesis in Business Administration
Title: A Comparison of Management Performance Measures
Author: Andreas Jivsäter
Marcus Martinsson
Tutor: Urban Österlund
Date: 2013-05-31
Subject terms: Performance Measures; Management; Evaluation Approaches; Compensation ; Key Ratios/Metrics
Abstract
Purpose: The purpose is to choose from previous research relevant key ratios and
perfor-mance measures which lend themselves as a basis for management perforperfor-mance evaluation. After selection, we will further analyze the statistical relationships between the measures and their influence on stock price, using a shareholder perspective. In addition, examine weather it is beneficial to combine market and accounting based measures in this regard.
Background: The separation of ownership and management which follows naturally by
the adoption of joint-stock company corporate structure creates a problem of aligning management‟s self interest with that of the shareholders. The gap is often bridged using compensation packages, which needs to be tied to some form of accounting related per-formance measure that needs to provide some form of basic relation with shareholder val-ue.
Frame of Reference: Works by Jensen and Meckling (1976) regarding agency theory and
additional theories regarding stakeholder theory, motivation and incentive theory are used to provide a solid background. In addition works by scholars such as Arabsalehi and Mahmoodi (2011) and Bacidore, Boquist, Milbourn and Thakor (1997) constitute the main framework which guides this thesis. The performance measures included were return on equity (ROE), return on assets (ROA), return on capital employed (ROCE), return on sales (ROS), economic value added (EVA) and shareholder value added (SVA).
Method: In order to address the purpose, a deductive research approach is used.
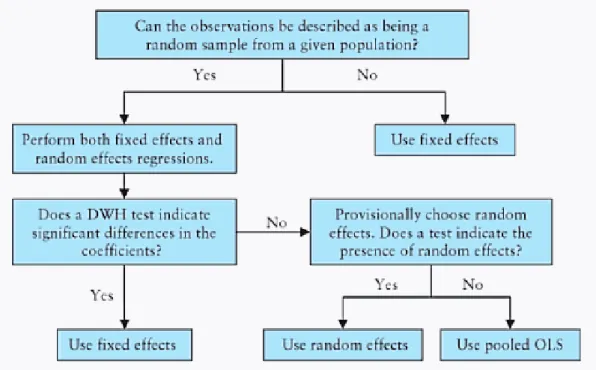
Second-ary data is collected and analysed using several statistical tests such as, panel data tests, cor-relation tests and coefficient of determination. Linear as well as non-parametric corcor-relation tests were conducted. The regressions were conducted single and pairwise with and without control variables. The most suitable panel data model were selected out of three possible: fixed effects model, random effects model and pooled OLS model. The panel data model were selected using Doughtery‟s (2007) panel data selection model as a basis.
Conclusion: EVA, ROCE and ROA showed evidence of being more appropriate
measures based on prediction- and explanatory power. SVA, although correlating with shareholder wealth at a statistically significant level, were not equally convincing as EVA, ROCE and ROA. Neither ROE or ROS showed evidence of having statisti-cally significant relationships with changes in shareholder wealth, regardless of statis-tical model. Pairwise combination tests with one accounting based and one market based measure did not increase the explanatory power in shareholder value creation compared to using only a single performance measure.
Abbreviations
CEO - chief executive officer
EBITDA - profit/earnings before interest taxes, depreciation and amortization EVA - economic value added
SVA - shareholder value added ROE - return on equity
ROCE - return on capital employed ROS - return on sales
ROA - return on assets
REVA - refined economic value added WACC - weighted average cost of capital
Definitions:
We have decided to use the same categorization as Arabsalehi and Mahmoodi (2011), hence we have categorized EVA and SVA as market based measures (also commonly called value based) and ROE, ROCE, ROA and ROS as accounting based (Ar-absalehi & Mahmoodi, 2011, p. 120).
Contents
1
Introduction ... 1
1.1 Background ... 1 1.2 Problem Discussion ... 3 1.3 Purpose ... 5 1.4 Methodology ... 5 1.5 Research approach ... 62
Frame of References ... 8
2.1 Background Theories ... 8 2.1.1 Agency Theory... 8 2.1.2 Stakeholder Theory ... 102.1.3 Motivation and Incentive Theory ... 10
2.1.4 Background Summary ... 11
2.2 Previous Research ... 11
2.2.1 Methods Previously Used ... 12
2.2.2 Performance Measures Used ... 13
2.2.3 Selected Performance Measures ... 13
2.3 Performance Measures ... 13
2.3.1 Accounting Based Performance Measures ... 14
2.3.2 Market Based Performance Measures ... 15
2.4 Summary of Frame of Reference ... 19
3
Method ... 20
3.1 Quantitative Data... 20
3.2 Data Collection and Analysis ... 20
3.3 Population and Sample ... 20
3.4 Data Validity and Reliability ... 21
3.5 Correlation ... 22
3.6 Panel data ... 22
3.7 Statistical Model ... 23
3.8 Control variable ... 25
3.9 Coefficient of Determination ... 26
3.10 Criticism of the method ... 26
4
Results and analysis ... 28
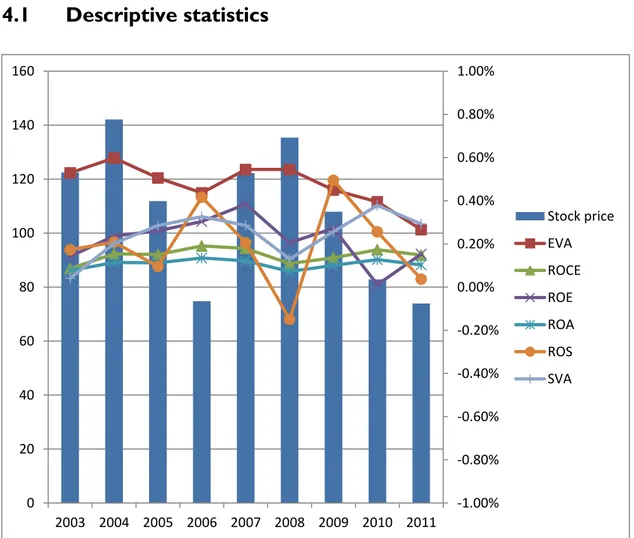
4.1 Descriptive statistics ... 28
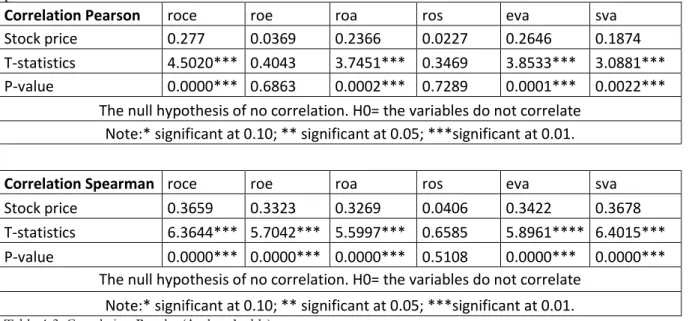
4.2 Correlation ... 30
4.3 Results for single measures ... 31
4.4 Explanatory power ... 34
4.5 Multivariate Regressions, Pairwise combination tests ... 35
5
Conclusion ... 37
5.1 Further Research ... 38
5.2 Discussion ... 38
Figures
Figure 1-1 Valuation Model ... 2
Figure 1-2 Relationship Model ... 4
Figure 2-1 SVA Model ... 16
Figure 2-2 Summarizing figure of the frame of reference ... 19
Figure 2-3 Accounting based measures ... 19
Figure 2-4 Market based measures ... 19
Figure 3-1 Panel Data Selection Model ... 24
Figure 4-1 Overview of Variables ... 28
Tables
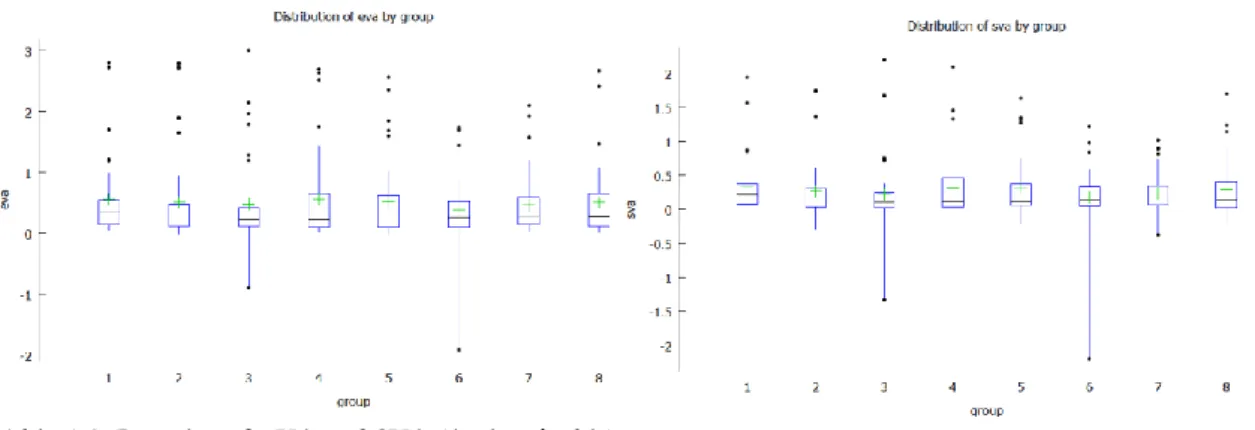
Table 4-1 Descriptive Statistics ... 29Table 4-2 Box plot of EVA and SVA ... 29
Table 4-3 Correlation Results ... 30
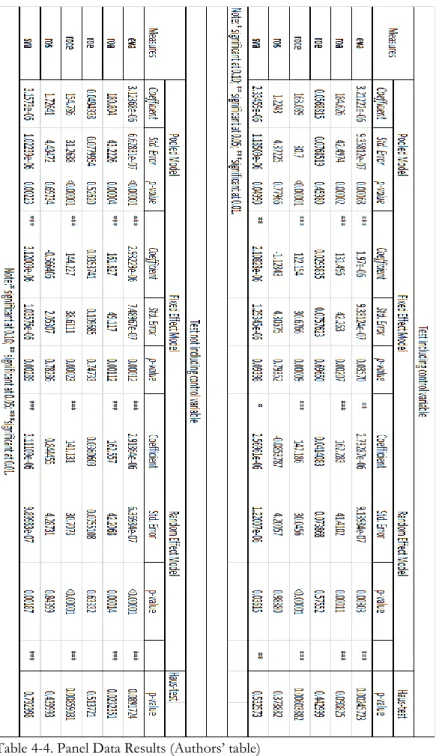
Table 4-4 Panel Data Results ... 32
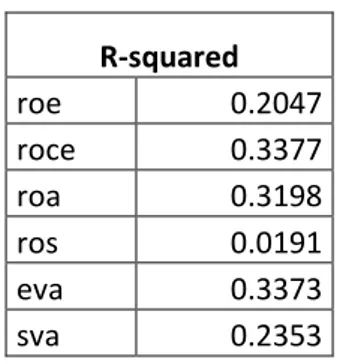
Table 4-5 Coefficient of determination single regressions ... 33
Table 4-6 Additional content test of panel data ... 34
Table 4-7 Coefficient of determination pairwise tests ... 35
Appendices
Appendix A1 Government bond rates ... 45Appendix A2 Market premium rate ... 45
Appendix A3 Swedish corporate tax rate ... 46
Appendix A4 Companies included ... 47
Appendix A5 Histograms of the six independent variables ... 48
Appendix A6 Panel tests ... 49
Appendix A7 Efficient market ... 60
Acknowledgement
We want to acknowledge those who helped make this thesis possible.
Firstly, we wish to thank our tutor Urban Österlund for taking the time and putting in the time to guide us. We would also like to thank Kristofer Månsson for his short but valuable advice regarding issues within statistics. Their recurring feedback and sugges-tions have greatly aided us in the writing this thesis.
In addition we want to thank Mattias Granat whose expertise in thesis writing has been absolutely crucial which without this task would have been insurmountable. Gratitude is also deserved by our fellow classmates who have provided critical feedback and com-ments throughout the thesis process.
In conclusion we want to thank our families and friends for their support during this undertaking.
--- --- Andreas Jivsäter Marcus Martinsson
1
Introduction
This chapter serves as an introduction to the thesis, beginning with a short introduction of the topic contin-ued by a background introducing the reader to the nature of the problem. The problem discussion crystallizes the nature of the problem. Finally, the chapter is concluded by detailing the purpose of this paper, the prob-lematical questions that are to be answered, delimitations and target group.
The use of remuneration programs for CEO‟s and top management have had its fair share of debate in the last decades. The debate went from being a smouldering fire to a roaring inferno as the financial crisis took hold in 2007 which ultimately led to Occupy Wall Street (Occupy Wall Street, 2013). Many stakeholders were affected by the crisis, not least the shareholders. Shareholders lost value in their stocks, yet management kept their costly compensation packages.
An example of this that is closer to home is David Brennan, CEO of Astra Zeneca. Be-tween January 1st 2006 and June 1st 2012 Brennan received compensation totalling 550 million SEK according to the company‟s compensation report. During the same time, the firm‟s stock dropped 20,6 percent while the Stockholm stock market as a whole rose 4,3 percent (Neurath, 2013).
At first glance, it might be puzzling as to why shareholders choose to reward management in these circumstances. However, the bigger question in the grand scope of things is; what is the ideal performance measurement for shareholders in the context of compensation?
1.1
Background
In the historical economic development, the stock company plays an important role. It provided many benefits for shareholders which had ripple effects in the economy. Some of the advantages are: Access to large amounts of capital, by issuing new shares. Limited liabil-ity of the shareholders, one can only lose the money one put in by acquiring shares. Trans-ferability of said shares, through buying and selling on a stock exchange. However the cor-porate form is not without drawbacks arising from the separation of ownership and man-agement.
Adam Smith pointed out the problem of separation of ownership and management, it might be one of the most famous ones, albeit not the first one to put the phenomenon of potential conflict of interest into words (cited in Jensen & Meckling, 1976, p. 305):
“The directors of such [joint-stock] companies, however, being the managers rather of oth-er people‟s money than of their own, it cannot well be expected, that they should watch over it with the same anxious vigilance with which the partners in a private copartnery fre-quently watch over their own.”
Adam Smith (1776)
Because the managers - or agents - are not required to hold a stake in the firm they cannot be expected to exhibit the same amount of diligence as the principal. One way of exposing the agent to risk is by tying the managerial compensation to the performance of the corpo-ration (Berk & DeMarzo, 2011). The basis for this thesis as previously stated is the separa-tion of ownership and management, the focus is then how to measure performance of management from the perspective of shareholders, in the context of compensation.
Overall, shareholders strive to earn as much return as possible, this is the overarching goal and is maybe the one defining feature that comes to mind when one thinks about capital-ism. This was put into words by Milton Friedman in a newspaper article from 1970 in the New York Times, he writes:
“In a free-enterprise, private-property system, a corporate executive is an employee of the owners of the business. He has direct responsibility to his employers. That responsibility is to conduct the business in accordance with their desires, which generally will be to make as much money as possible while conforming to the basic rules of the society, both those em-bodied in law and those emem-bodied in ethical custom.” Friedman, 1970, p. 32.
On the assumption that shareholders aspire for ever greater profits, they can provide man-agement with more incentives by allowing manman-agement to partake in reaping the rewards. This is usually done by providing compensation for outstanding performance. In other words, the more money management earns for its shareholders, the more compensation they become eligible for. The benefits are twofold, expose management to more risk as to make them pay more heed. But also make their compensation vary with the company‟s per-formance to provide incentives for ever greater return (Eisenhardt, 1989).
There are common ways to measure shareholder wealth, usually simply by looking at stock return. But measuring management performance is far more difficult. The hard part is to measure the value created by management and its impact on stock price. Investors‟ lack of control over their own capital has given rise to the use of several different valuation proce-dures and performance measures. Central to value in financial terms, is the ability to gener-ate positive future cash flows. These cash flows may have an impact on share price, but they actually only appear as numbers in companies‟ accounting. Although changes in ac-counting do not always affect the share price in a logical way, the primary source of infor-mation for investors and analysts is the financial statement (Damodarand, 2012).
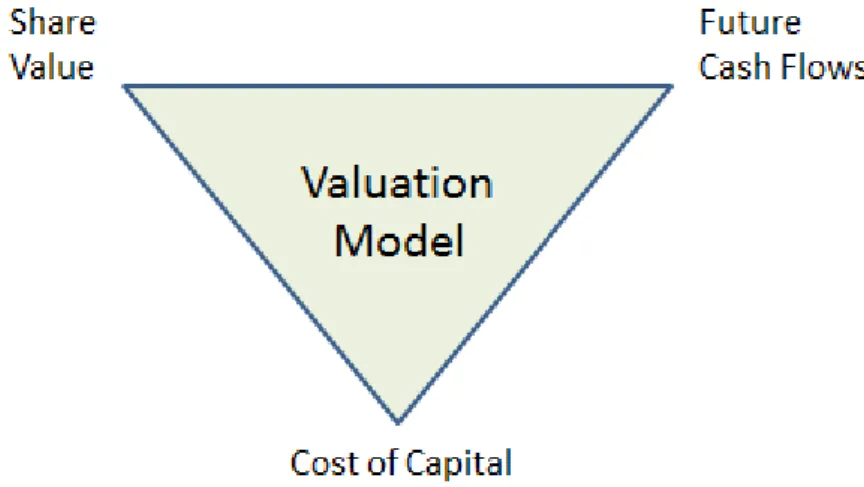
Figure 1-1.Valuation Model (Berk & DeMarzo, 2011, p. 274)
In order to illustrate, figure 1-1, depicts what interest shareholders. The cost of capital is usually included in market based evaluations, however the value is represented by share value and expected future cash flows. According to previous research performance is usual-ly weighed against share value (Berk & DeMarzo, 2011).
1.2
Problem Discussion
Some of the earlier and more well-known research regarding performance was done by Ross (1973), Stiglitz (1975), Mirrlees (1976), Holmström (1979), Diamond and Verrechia (1982) and Murphy (1984). But since all theories are tied to different assumptions (about managers, state of nature, capital markets, etc.) they all have different empirical conse-quences. The common factor for each model is, however, that actual and observable productivity must be measurable and put in relation to changes in shareholder value. The most appropriate measure of shareholder value is stock price. If one wishes to reward someone for their performance, the performance itself needs to be assessed and measured as well as the outcome of said performance. In order to clarify, it is the relationship be-tween the performance metric and changes in stock price that needs to be studied.
Cote (2009) opined that any compensation based on performance cannot be based upon changes in stock price, but rather tied to a company‟s actual accounting result. Stock prices are based on investors‟ expectations and even if managers were able to constantly perform better than those, the market would adjust to this. This means, that the output of said per-formance needs to be made visible and measurable for the shareholders, in the stock‟s price. However, the actual measurement of management‟s performance, cannot be based on the stock price, it needs to be measured on the company‟s accounting and income statements.
There are two kinds of financial performance measures that are commonly used when measuring the performance of firms‟. There are market based measures and accounting based measures. The defining feature of a market based measure is that it relies on the market to provide part of the measure, for example economic value added (EVA). This measure takes into account net operating profit after taxes and book value of net capital from accounting, while the weighted average cost of capital incorporates market based var-iables. This and other measurements will be explained in more detail later on. Accounting based measures rely exclusively on accounting, such as return-on-equity (ROE). Net in-come divided by equity constitutes ROE (Merchant & Van der Stede, 2007).
As was stated in the work by Bacidore, Boquist, Milbourn and Thakor (1997) „Any financial performance measure used in managerial compensation, on the one hand, must be corre-lated highly with changes in shareholder wealth and, on the other, should not be subject to all of the randomness and “noise” inherent in a firm‟s stock price.‟ (Bacidore et al., 1997, p. 11). In other words, according to previous research conducted by scholars such as Bacidore et al. (1997) the measurement chosen to measure management performance needs to corre-late highly with the share‟s stock price, as this is the only way to objectively measure share-holder value.
There is a large number of competing financial performance measures that are available for use. A survey conducted by the Institute of Management Accounting in 1996 found that a low amount of top management respondents, 15%, felt that measurement systems sup-ported top management‟s objectives well. 43% felt they were less than adequate or outright poor and even as many as 60% of the respondents answered that they were doing major overhauls to their current measurement systems (Venanzi, 2012).
Inadequacies, real or perceived, have led to an evolution in measures. Generally speaking traditional accounting based-measures have been foregone in favour of several innovations
that take into account economic value. Studies have also investigated and concluded that good measurement is essential if there is to be good management, because measurement managed organizations have in studies been shown to perform better than non-measurement-managed firms. Considerable debate, especially among consulting firms, has followed as to which measurement captures economic value best, has the fewest flaws in evaluation and has the best predictive ability (Venanzi, 2012).
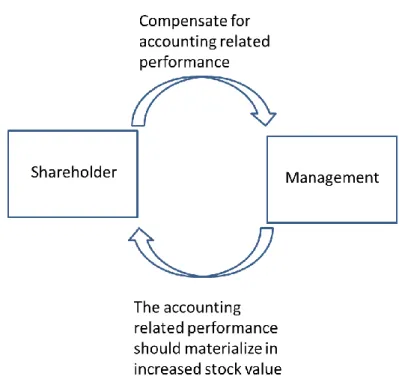
In the light of agency-theory, motivation theory and incentive systems, it is important to find accounting related measurements that are adept at predicting changes in shareholder value that then can form the foundation for compensation packages. Figure 1-2 below shows this relation between shareholders and management.
Figure 1-2. Relationship Model (Authors‟ figure)
Shareholders need to have the possibility to measure the performance of the firm or man-agement and this performance needs to have an impact on the share value. Naturally, stock prices are full of uncertainty and this relationship will probably be weak. Even so, some measure of performance based on accounting (Cote, 2009) needs to constitute the basis for usage as a foundation of compensation programs. This thesis will not delve deeper into the issue of the construction or design of compensation packages, instead, it will focus on evaluating proper metrics that can be used as performance measures for shareholders on which compensation potentially could be based on.
1.3
Purpose
The purpose is to choose from previous research relevant key ratios and performance measures which lend themselves as a basis for management performance evaluation. After selection, we will further analyze the statistical relationships between the measures and their influence on stock price, using a shareholder perspective.
The research questions are:
Does any of the measurements posses more predictive power when it comes to ex-plaining stock price movements?
Does combining market based and accounting based measures excel at explain-ing/predicting changes shareholder value in comparison to using only one meas-ure?
1.4
Methodology
Saunders, Lewis and Thornhill (2007) debate which method is more suited for a given type of study. Generally qualitative studies tend to be more interpretive in nature while quantita-tive studies are more positivistic. For this thesis, we intend to conduct data analysis using secondary data, hence the positivistic assumption is more appropriate. It adopts the philo-sophical stance of the natural scientist. This implies that one prefers to work with some form of observable reality and can produce an end product through research can be law-like generalizations.
This usually means that one adopts a research philosophy that guides the researcher in col-lecting credible data and that these data will generate, in accordance with existing theories, some form of testable hypothesis. By doing so, it is the hope of the researcher to be able to put the theory to a test of some sort. The theory can then be confirmed or refuted, either in whole or part. The outcome of the hypothesis testing ought to be used to extend the de-velopment of the theory in order to be tested again, by further research (Saunders et al. 2003).
In the positivist approach, is crucial that the research undertaken, to the extent that it is possible, in a value free fashion. The approach lends itself to quantitative studies, where cold facts (usually data, but can also be any observable phenomena) is examined and tested, but even then it is not possible to totally rule out any bias of the researcher. After all, the researcher has to choose where to select and collect data, maybe even perform a shallow examination of the data before proceeding with the collecting and so, it is never possible to be completely value free. The complete neutrality of the researcher might be impossible, but the decided positivist does his/her best to exclude one's own values and let the data and tests speak for themselves (Saunders et al. 2012)
The purpose of this thesis is to investigate if there exists a relationship between our objec-tive facts and the results of our statistical analysis of the data. The intent is to find the aforementioned relationship as suggested by some prior research, although the research is sometimes ambiguous regarding this relationship. We believe our research philosophy ac-curately reflects the principle of positivism, as described by Saunders et al. (2003) as we put
great emphasis on objectivity through statistical methods in order to avoid biases as a result of pre-perceptions.
1.5
Research approach
A research approach entails how the collection of data is to be done and how it will be in-terpreted. The point that forms the basis is that the same investigation should be able to be undertaken at a later time and essentially reach the same result. In addition, another point is that it should be able to be critically scrutinized by the reader.
Literature search, in order to find relevant literature on the subject, the Jönköping Interna-tional Business School‟s (JIBS) library was used. We searched for scientific articles and books using key search terms such as: “remuneration, program, performance, evaluation, measurement, principal, agent, incentive”. In the case of finding the companies‟ financial statements the database Retriever Research was used, the database is also used by JIBS uni-versity library.
Exploratory studies is a way of finding out what is happening, seek new insights, to examine a phenomena in order to ask the appropriate questions. It is mostly useful when one wish to clarify the understanding of a problem, if the precise nature of the problem is not cur-rently well understood. Exploratory research is typically conducted in three ways (Saunders et al. 2005):
a search of or examination of literature interviewing experts within the subject conducting focus group interviews
Descriptive studies aim to accurately portray events, situations, persons or literature. Descrip-tive studies are usually a forerunner to exploratory or explanatory studies. This is the case because it is often an implicit requirement to have a clear picture of the phenomena one wishes to investigate, it is usually a means to an end rather than an end in itself. This means that if the research makes use of descriptive approaches then it typically is a precursor to an explanation, such studies are known as descripto-explanatory studies (Saunders et al. 2005). Explanatory studies are studies that attempts to explain something, such as establish rela-tionships between variables. It usually takes the form of quantitative studies and makes use of statistics and/or hypothesis testing. A concrete example of this could be a cursory analy-sis of quantitative data on manufacturing scrap rates shows a relationship between scrap rates and the age of the machine being operated. In such a case one could go ahead and make use of statistical data and subject it to statistical tests such as correlation (Saunders et al. 2005).
In order to satisfy the purpose of this thesis and to best aid in answering the research ques-tions we chose to use a combination of the descriptive and explanatory approach, the de-scripto-explanatory approach. The exploratory approach has not been necessary since the problem itself has an adequate description and some research has already been done. Using past research we have described previous findings by different scholars with different an-gles of approach. In addition we chose the explanatory approach as we wish to subject our data to statistical tests in order to answer our research questions.
Bryman and Bell (2007) said that deductive theory is the idea of a natural relationship be-tween theory and research. Hypotheses are deduced based on theories about the field of studies, which must then be subjected to empirical examination. Using a deductive ap-proach allows us to analyse data using existing theories and testing hypothesis using obser-vations.
Deduction has the power to clarify relationships between variables, but to ensure scientific accuracy the researcher is required to be independent of what is observed (Saunders et al., 2012). The risk of unconsciously steering the research in a biased way is reduced since us-ing secondary data leaves no opportunities for biased thoughts to affect the gatherus-ing pro-cess of the data. Eriksson and Kovalainen (2008) believed that through experimental and quantitative methods, the main idea behind the deductive research approach is to develop statistical generalizations.
2
Frame of References
This section entails the theoretical background that forms the basis for the thesis. It starts with general theories that constitute the backdrop before moving on to the frame of reference. The latter also includes some general financial theories that are used in certain market based measures. It continues with past research and past methods used. The chapter ends with an overview of relevant performance measures and how they are calculated.
2.1
Background Theories
As was stated in the first chapter, in this thesis we will use the shareholder perspective. We will also use the theoretical background to show where the theory is anchored and have developed from. In addition to providing a more thorough account, the theoretical back-ground will also deal with alternative viewpoints and conflicting theories for the sake of avoiding bias.
2.1.1
Agency TheoryIn corporate governance, a very crucial theory is the one that was developed by Jensen and Meckling (1976) concerning the principal (shareholder) and agent (management). The par-ticular phenomenon that the theory focuses on, is the view that management are driven primarily by self-interest. This means that it cannot be assumed that management will al-ways act to maximize shareholder value, which is the purpose of management according to famous scholars such as Milton Friedman (1970). The maximization of profits and return on investment is paramount in the view of the shareholder and is the precise job that man-agement was hired to do. This phenomenon of differing interest and the resulting cost is the focus of Jensen and Meckling: „agency costs will be generated by the divergence, be-tween his [CEO] interest and those of outside shareholders‟ (Jensen & Meckling, 1976, p. 313).
The agency costs can take many forms, be it in the shape of additional monitoring costs, competition in executive labour markets, incentive systems and so on. Agency costs are the costs that arise when the principal attempts to align the interest of the agent with that of themselves. The two underlying assumptions of agency theory is the aforementioned self-interest. Second, the individual is rational and competent enough to see the connection be-tween the individuals‟ behaviour and how these actions affect their own fortune. (Jensen & Murphy, 1990). The logical implication of these two assumptions is that if the interest of the agent does not coincide with that of the shareholder, the shareholder cannot expect that the agent will choose the optimal actions as seen from the point of view of the share-holder. The conflict of interest can be solved, or at least alleviated, by the construction of incentive systems which will ensure proper actions and provides a monitoring tool (Kulik, 2005).
Incentive systems can take on many forms, but the purpose is often the same. The purpose is to tie rewards to performance and the constructions of these systems are flexible enough to provide multi-functionality. They can be used as an information tool in the sense that they communicate areas of extra importance, an example could be sales targets, or profit margins in terms of efficiency (Merchant & Van der Stede, 2007). Many compensation programs are aimed at the executive level or top management, often in the form of long-term incentive plans. Jensen and Murphy (1990) found that it is not how much you pay,
but how you pay that matters. In their article they noted that management, like all people, are often concerned and driven by motivations of their own well-being. One of the difficult tasks that the board of directors face is how to best construct and design incentive systems for top management. „One of the most critical roles of the board of directors is to create incentives that make it in the CEO‟s best interest to do what‟s in the shareholders‟ best in-terests‟ (Jensen & Murphy, 1990, p. 139). Conceptually, it is easy, in practical terms, the task can be daunting.
One famous example, of a company where incentive systems and agent culture performed poorly, is the story of Enron. Enron CEO Ken Lay and members of upper management walked away with large sums of money in their pockets while shareholders made huge loss-es as the house of cards collapsed. Right before the collapse, Ken Lay was named one of the top 25 managers of the year and Fortune named the company Enron the most innova-tive company for several years. Much of management were given stocks as compensation, which meant that as long as stock price went up, management reaped (perhaps unwarrant-ed) rewards (Kulik, 2005). Enron is but one example of self-interest driven management. Before the crisis of 2007, some prominent people were deeply concerned with the recent development of remuneration programs and bonus programs, primarily within the banking and investment sector. One person who squarely linked the problems with incentives was Rajan Raghuram. In his paper, Rajan discusses issues such as deregulation, technological and institutional change. However, as stated in the paper „My main concern has to do with incentives.‟ (Rajan, 2005, p. 315). Rajan goes on to argue that changes in the financial world have altered managerial incentives which changed the amount of risk undertaken by the system with potential for distortions (and destruction of shareholder wealth). Among Ra-jan‟s conclusion is the opinion that the world is better off thanks to these changes, but goes on to say that opportunities can be exploited for both good and bad. „This is why it is so critically important to get incentives right.‟ (Rajan, 2005, p. 360).
In an effort to rethink management compensation, efforts were made to move away from share prices as performance measure, and stocks as rewards Cote (2009) wrote an article where he propagates the idea that variable pay plans for management should be tied to a company‟s actual performance (some accounting measure) as opposed to its share price. Specifically Cote (2009) suggested that the measure EBITDA could be used for this pur-pose. Bacidore et al. (1997) shared parts of this opinion in the sense that the actual perfor-mance measurement needs to be done on accounting measures, or accounting measures in combination with market values, with the added criteria satisfied that these measures nec-essarily need to correlate with shareholder value.
In the works of Bacidore et al. (1997), Arabsalehi‟s and Mahmoodi‟s (2011), the necessity of having accounting measures or accounting based measures correlate with stock price (as a measure of shareholder wealth) forms the foundation for their work. The basic principle behind both works is that management should be evaluated based on actual performance. Connected to accounting, which is in the sphere of influence of management and not sub-ject to stock market randomness, bull or bear mentalities, speculation and so on. The need for correlation is justified as shareholders ultimately aspire to greater value for themselves, captured as share price. With this background, board of directors should very much be in-terested in the relationship between performance measures and shareholder wealth, and the research that could aid in refining the construction of compensation systems that provide management with the right incentives (Jensen & Murphy, 1989).
2.1.2 Stakeholder Theory
As previously discussed, according to agency theory, a firm can be viewed as a nexus of contractual relationships between agents and principals. It is a complex process of equilib-rium among possibly conflicting individual goals (Jensen & Meckling, 1976). A firm, how-ever, can be viewed in a number of different ways. One could be in terms of the activities that are carried out. Another in terms of what it produces. A third in what characterizes the relationship among the nodes in the company. If one uses the third one, relationships, people can be understood as a description of their respective function (Fontrodona & Sison, 2006).
It has at times been suggested that agency theory takes on a too narrow view of a company and its important parties and that it can be extended further. If one choose to delimit the corporation in a different fashion one can see that several different parties have stakes in a firm. According to some, agency theory restricts itself to describing the relationship be-tween directors and shareholders, and does not take into account lower levels of manage-ment, workers, creditors and other external stakeholders. Depending on angle of approach, stakeholder theory can give a more complete picture of internal and external relationships of a company. It has been suggested that firms close to insolvency sometimes takes on high risk/high reward investments in order to keep the effort going. This takes place because management recognizes that it can benefit from this at the expense of the creditors. In such a case the fiduciary duties are shifted from being owed to shareholders to being owed to creditors. Such actions appear to make sense from the perspective of agency theory, but increased risk to stakeholders is better captured by stakeholder theory (Phillips, 1968). Other researchers have pointed out that value, depending on the definition of value, is best created by attempting to maximize the outcome of joint efforts. More explicitly, the value created through joint efforts by several stakeholders in the firm is more valuable to all stakeholders. Some argue that evidence suggest that efforts that satisfy the needs and wants of two stakeholders is not only additive but possibly even multiplicative. A basic instance could be focusing on customer satisfaction, one stakeholder, which will indirectly affect two other sets of stakeholders, employees and stockholders, who also benefits from greater customer satisfaction (Phillips, 1968).
If the underlying assumption is correct that stockholders benefit more from the outcome of joint efforts by several stakeholders then a performance measure which focuses on cap-turing the performance of the agent alone, might not be sufficient.
2.1.3 Motivation and Incentive Theory
It is important to distinguish between motivation and incentives. Kressler (2003) argues that motivation is imperative and that the right incentives can increase the efficiency of whatever motivation is originally in place. It does this by pushing individuals to work more effectively, faster and harder. Cote (2009) as previously stated, made a point to clarify that it is not how much you pay, but how you pay. This goes hand in hand with what Kressler (2003) argues, that incentives can increase motivation, but cannot take its place. If there is no motivation to begin with, it does not matter how much money is thrown around. If however, there is motivation present, then the right incentives can increase the effective-ness. As Rajan (2005) pointed out, it is absolutely crucial that the right incentives are in place.
Many researchers in the past have produced findings which show that there are more things than just money that can provide management with incentives to increase motiva-tion. Among others one might find perhaps the most famous scholar, Maslow. Maslow is famous for his theory of hierarchy of needs. The theory basically suggests it is important for individuals to fulfil basic innate needs and one tends to move up on a pyramid of needs in order to finally arrive at the highest point which is self-actualization (Maslow, 1954). For some individuals, money is surely an incentive, while for others prestige might be an incen-tive or need. Being the CEO of a major global corporation can be appealing to some, working for a charity or non-profit organization can provide incentives for others (Cote, 2009).
It might also be interesting to note some differences between agency theory and motivation theory & incentive theory. The former focuses on suppressing management's self-interest through incentives, while the latter focuses on changing direction of the self-interest through the control of incentives. The added benefit of control, or steering, is one very im-portant aspect of compensation programs which is at the disposal of shareholders through the board of directors (Merchant & Van der Stede, 2007).
2.1.4 Background Summary
Stakeholder theory can in many ways be viewed as an alternative to agency theory. The lat-ter is relatively simplistic and intuitive but might not be able to capture all the complex rela-tionships in a firm. Stakeholder theory can in some instances provide a more complete pic-ture, but the act of defining and measuring different relationships, linking outcomes to ac-tions becomes increasingly complex.
2.2
Previous Research
Prior research in the fields of agent theory and compensation has come to varying and - at times - contradicting conclusions. Initially research suggested that management perfor-mance measures should be based on stock price or other closely correlating market based measures. This basically meant that compensation should be paid for actual and observed gains in shareholder value. Aside from stock price, researchers investigated sales, assets, profits and rates of return. Their conclusion was that profits tended to have a strong influ-ence on rewards but sales appeared to have none (Kerr & Bettis, 1987).
However, some researchers argue that using stock price or strong market based measures as a basis for performance measure is not ideal, since stock price and market ultimately re-flects investors‟ expectations. Instead, they suggest that performance should be based on accounting measures, such as profit or earnings before income tax and depreciation of as-sets (EBITDA) (Cote, 2009).
Abowd (1990) conducted a study which showed that there was no statistical evidence that after-tax return on equity had an effect on future performance as measured in stock price. It did however show that after-tax gross economic return and total shareholder return had an effect and that the evidence for it was substantial. In his work, he writes „It is perhaps surprising that the accounting performance measures did not fare as well as the economic measure or the market measure‟ (Abowd, 1990, p. 68). Even though from a theoretical
standpoint, using accounting measures might sound more ideal since it is in the control of management, in the end market based measures tend to do better, as measured in correla-tion with shareholder value (Abowd, 1990).
Abowd and Kaplan (1999) noted a possible side effect of using accounting measures, in that it can sometimes encourage management to alter or “tamper” with accounting num-bers. One such a behaviour was found in studies of nonlinear bonus programs, in which managers choose income-decreasing accruals (use accounting methods that report lower profitability) if their variable pay had hit the ceiling (already eligible for the highest amount of compensation). The ceiling in this case is lower or upper bound, when the pay for per-formance sensitivity is zero (Healy, 1985). This behaviour by managers was considered ra-tional considering the incentives, which highlights yet again why it is so crucial to get incen-tives right, and to pay great heed as to what shareholders want to use as a basis for pay-for-performance-programs, as it can affect long-term profitability and performance. If account-ing based measures can encourage the shufflaccount-ing of numbers in the books, then maybe the ideal performance measure is not based solely on accounting, but perhaps a mix of market and accounting based measures.
Biddle, Bowen and Wallace (1997) claimed that market based metrics were hardly or not superior compared to accounting based, especially questioning the efficiency of EVA. R-squares from single regressions were compared to evaluate the information captured in every single variable, showing that EVA added only slightly to the information content be-yond earnings. Hence, they concluded that combining one accounting ratio with EVA should in most cases not explain shareholder wealth significantly better than using that ac-counting measure alone.
2.2.1 Methods Previously Used
Correlation is one of the most used methods of investigating the relationship between val-ue and compensation, performance and compensation or performance and valval-ue. Benston (1985) conducted a study in which no relationship was found between corporate perfor-mance and management‟s compensation. As a plausible explanation for this lack of correla-tion he put forward the theory that a large porcorrela-tion of management compensacorrela-tion was tied up in stocks or stock options, if so, then the correlation should be weak or insignificant which his study showed.
Coughlan and Schmidt (1985) used abnormal returns as their measure, based on compari-sons between performance in current and previous measurement periods. They found sta-tistically significant relationship between abnormal return and stock price, but their model was only able to explain 5,4 percent of the variation in compensation. They argued that the purpose of salary and bonus was to give management income security, rather than provide incentives in which compensation would need to vary with performance.
Kerr and Bettis (1987) wrote and pointed out differences between previous research and commented on methods used. Out of two studies that used raw returns in their primary analysis, one found a positive relationship while the other found no relationship at all. Yet two other studies used abnormal return and both found positive relationships. The prob-lem was that the two used different methods of defining “abnormal” and Kerr and Bettis (1987) insists that the two were entirely different constructs and thus were not comparable. Another issue pointed out is that past methods have often examined the compensation in
relation to a performance variable without adjusting for the time lag. Compensation dis-tributed over year t, are based on the boards perception of past performance that is the previous year, t-1. In order to capture the true relationship between compensation and per-formance, or performance and the effect it has on shareholder wealth, then introducing the previously mentioned time lag is something one might take under consideration.
2.2.2 Performance Measures Used
When deciding upon what variables to include in our paper the first and formally most in-teresting aspect is comparing accounting based measures with market based measures. EVA is currently a common and often praised market based measure, especially in the USA, with many companies adopting the measure for evaluation and bonus-related issues. Companies that have been using EVA include several mutual funds and companies such as AT&T, Coca Cola, Whirlpool, Quaker Oats and DuPont (Biddle et al. 1997).
Brown and Hagel (2010) wrote that Wall Street analysts tend to use ROE as their primary measure when evaluating company performance. Though ROE is one of the most com-monly used measures, ROA is also a sound and common tool to evaluate long term profit-ability trends by only including assets used to support the business. Brown and Hagel (2010) also claimed that the popular measure ROS, while measuring the robustness regard-ing returns on sales, is not as good of a metric as ROA. These measures will all be included in our research primarily due to their popularity, but also since previous research such as Lehn and Makhija (1997) found EVA to be better associated with changes in stock price compared to ROE, ROA and ROS. Another accounting based measure, ROCE will also be included. Though being similar to ROA, return on capital employed takes sources of fi-nancing into account (Damodaran, 2012).
Challen (1999) came to the conclusion that the measure SVA could be of significant benefit to state treasury when evaluating government- and state owned companies performance. This is due to the fact that SVA provides a framework which ensures that actions aiming on increasing shareholder wealth are focused upon.
2.2.3 Selected Performance Measures
Based on previous research we selected two market based and four accounting based per-formance measures. The two marked based metrics were EVA and SVA. As for the ac-counting based we opted to use ROE, ROCE, ROA and ROS. These six measures will be included in this paper mainly because of their perceived superiority, but also due to their popularity.
2.3
Performance Measures
Whenever shareholders evaluate a company‟s stock, they discount the expected future cash flows in order to arrive at a present value of said cash flows and this helps them determine what the stock ought to be worth today. For example, when a company release their finan-cial statements for the quarter, the stock price tends to move. Either it goes up because earnings are better than expected and as shareholders adjust their expectations, they are willing to pay more for a stock, hence the stock price goes up. The same thing happens in reverse if earnings are lower than expected. A concrete, vivid and contemporary example of
this is the hit Apple‟s stock took after releasing their financial statements on January 24th, 2013. Shareholders quickly adjusted their expectations and the stock dropped 10,75 percent (O'Brien, 2013).
Generally there are two categories of performance measures that are widely used, market based and accounting based. Both come with their inherent specific advantages and disad-vantages. These two types are described in this paper, as most large organizations make use of them today (Merchant & Van der Stede, 2007).
2.3.1 Accounting Based Performance Measures
Top management in companies have traditionally been evaluated on performance measures with their foundation in accounting books. The reasons are relatively straightforward, the numbers need to be kept track of to be in accordance with countries‟ tax laws, market laws, etc. Aside from that they are also relatively accurate, objective and easy to understand, they are used all the time because of this. Critique has been put forward that managers because of this, sometimes experience pressure to perform particularly in the short run which can make long term investments off-putting to undertake (Merchant & Van der Stede, 2007). Among the major benefits of using accounting based measures is that if compensation is based on actual accounting data, it would be easier for the company to carry compensation costs as they would naturally co vary. If the company is performing well, it is easier for the company to carry the costs associated with compensation, respectively if the company is doing poor there will not be any major costs to carry. Another is that while accounting numbers are not in total control of management, they are far easier to impact than the stock price (Bacidore et al., 1997, Cote, 2009).
2.3.1.1 Return on Equity (ROE)
Return on equity is a popular and widely used measure of corporate financial performance. It enjoys several benefits such as being easy to calculate, is usually provided in companies‟ annual accounts and is thereby readily available, can be expanded to be the end result of structured financial ratio analysis in something that is called the Du Pont model. No meas-urement is without drawbacks and ROE has its fair share. Drawbacks that have been pointed out are the ability to manipulate the numbers in annual accounts within the legal framework. Another is that ROE tends to increase the more leverage in financial terms that the company takes on, as long as the returns exceed the borrowing costs. The last weak point is inflation, profit margin has been found to have a negative relationship with infla-tion which in turn impacts ROE and expected growth. Even so, investors tend to appreci-ate ROE because it links the income stappreci-atement to the balance sheet (Ahsan, 2012).
ROE is widely used by stockholders since it calculates the profitability from an equity in-vestor‟s perspective. As the formula shows, this is done by relating the equity inin-vestor‟s profits to the book value of equity investment. Firms with high growth rate tend to have had experienced years of high ROE, since a high return on equity implies that earnings can be reinvested in the company (Damodaran, 2012).
2.3.1.2 Return on Capital Employed (ROCE)
This measurement is aimed at evaluating how well the company uses its own working capi-tal. The operations of a company are funded through equity or debt and the capital em-ployed needs to compound to a sufficient amount so that either interest or dividends may be paid. In other terms, ROCE measures profitability and efficiency of capital investments. It is calculated by dividing EBIT by total assets minus current liabilities (Andersson 2008). ROCE is also quite suitable to be used on a divisional level or subsidiary level. This allows management to set goals for the organization. This goal setting can have perverse effects at divisional level. For example, if the official efficiency target is a ROCE of 5%, managers can sometimes believe that there is an unofficial target that is higher, say 10%. If that is the case, managers can then actively choose to disregard investments, actions or the like that are below 10% which will lead to beneficial investments not being en. (Rutherford, 2002).
2.3.1.3 Return on Sales (ROS)
ROS is a widely used ratio used to measure operational efficiency of a company. It states how much profit is being produced per SEK of sales. Ideally it should be compared to ROS over time for the same company, compared to other companies‟ ROS in similar in-dustries. If wider comparisons are made, it typically only gives an estimation of how effi-cient management is (Damodaran, 2012). ROS is calculated as
2.3.1.4 Return on Assets (ROA)
According to Damodaran (2012) ROA measures how efficient a company is in generating profits from its assets, by dividing the earnings before interest and taxes by the total assets. In other terms, ROA measures companies operating efficiency before taking the financing effects into account. In most cases, total assets are referred to as the assets measured using book value. Since EBIT is divided by the total assets the computed return does understate companies with substantial current assets. By keeping the financial effects apart from the operational effects, ROA is often claimed to be a better measure of the true return.
2.3.2 Market Based Performance Measures
Logically, from a shareholder perspective it would make the most sense to measure man-agement‟s performance on the desired value itself, the stock price. An example of such a market based measure is Total Shareholder Return (TSR). But actually doing so in an eval-uation of performance context presents a myriad of problems. The most potent problem is that a stock market‟s valuation of a stock is largely out of the hands of top management as
was pointed out by Cote (2009). A stock‟s value is also dependent on shareholders´ expec-tations which means that management would be evaluated on meeting said expecexpec-tations, not on actual results. A striking example of this was put into words by Cote (2009, p. 60): “What would happen if a quarterback‟s pay depended on the number of times the team beat bookmaker‟s expectations - the spread they offer the betting public - and not on the number of games won? If a quarterback beats the spread systematically, bookmakers would increase it, anticipating actual results and levelling the odds for bettors. In the long run, beating the spread wouldn‟t work as a compensation system, and quarterbacks would fail as often as they won, although it would encourage them to take more chances.”
A company‟s stock price is also subject to all the randomness, or “noise” that characterize all stock markets. This is an acronym for all unaccounted variables in a statistical model which in some sense is part of the model as they reside in an error term, but are not subject to any form of investigation or closer scrutiny (Bacidore et al., 1997).
Another issue is that management can perform mediocre but still reap great rewards be-cause the stock market at the time was exhibiting bull-herd mentality, or inversely, can do really well but not reap any rewards at all because of a worldwide market crash. Another potential problem would be the maturity of the company, when a company matures its stock peaks and a stock-based reward system would leave management without rewards (Cote, 2009).
The way that market based measures take into account expected return and debt interest rates is by calculating the weighted average cost of capital (WACC). WACC in turn relies on the capital asset pricing model (CAPM). These two will be explained in more detail. CAPM is a common and widely used model for determining the theoretical relationship be-tween risk and return for any asset in a well-diversified portfolio when markets are in equi-librium. In a well-diversified portfolio, theoretically the risk tied to a specific asset (non-systematic) becomes less significant which means that the portfolio return is dependent upon the quantity of non-diversifiable risk. The mathematical representation of the model is as follows:
The model takes into account an asset's market risk, usually quantified in terms of beta (B), and set it in relation to the expected return of that market as well as the expected risk free rate. CAPM provides a strong basis for the calculation of market-based performance measures. The model justifies the calculation of a theoretical yield for shareholders, by claiming that the theoretical yield on a risky asset is a function of that asset‟s market risk. The systematic risk, market return Rm subtracted by the risk free rate Rf, is multiplied by for example a stocks beta to get it´s expected yield in terms of market exposure, in a well- diversified portfolio. Adding the risk free rate Rf with the systematic risk gives the theoreti-cal expected return. Market-based performance measures make use of the CAPM theory since a theoretical yield for owners of a firm supports the calculation of the weighted aver-age cost of capital for a firm (Elton, Gruber & Brown, 2011).
WACC is used to calculate the average cost of both equity and borrowed capital. In other terms, the WACC indicates a company‟s theoretical minimum rate of return in order to meet lenders‟ interest requirements and satisfy owners required returns. The model uses the weight of both debt and equity, relative to total debt. Interest paid to lenders results in tax credit, because of this the model multiply the interest rate with one less the corporate tax rate. The CAPM model derives the expected shareholder return, which can now be used to mathematically calculate a firm‟s WACC simply by multiplying each component of capital by the cost of that capital (Stewart, 1991).
2.3.2.1 Economic Value Added (EVA)
Stewart (1991) argued that the most appropriate measure of performance that shows how corporate value increase or decrease is EVA (Economic Value Added). EVA includes op-erating profits but subracts the cost of capital, hence EVA can only increase if more profit is made without having to tie up additional capital. The performance measure also has the advantage of being directly linked to the intrinsic market value of a company.
EVA is defined as
Critics often find that a disadvantage of EVA is that it is complex and time consuming to calculate. In addition, the idea that EVA will provide every employee with a better under-standing about the company‟s success is well-intended but it is generally an executive‟s measurement tool (Shand, 2000).
One interesting question is why one instead of the adjusted book value of net capital were to use the market value of the firm? Damodaran (2012) said, since the market value in-cludes not only capital invested in current assets but also in expected future growth, market value is inappropriate. One could of course use the market value of current assets, but due
to the difficulties of estimating this researcher and investors usually turn to the book value of capital as a proxy. The main idea behind using NOPAT and adjusted net capital is that businesses are truly profitable when they create returns above their cost of capital. Since rWACC multiplied by NA includes the total expected return on net capital, a NOPAT higher than this causes EVA to be positive.
2.3.2.2 Shareholder Value Added (SVA)
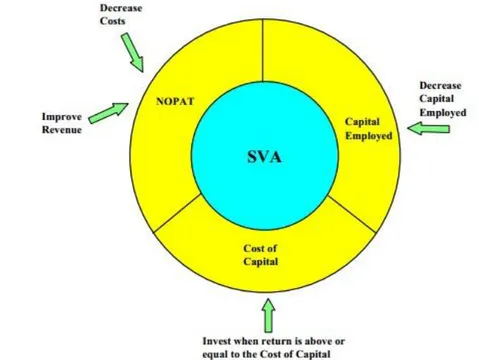
Accounting measures primarily focus on residual profits after tax measured against the as-set base of a company whereas value based (market based) measures takes into account op-erating performance by adjusting net opop-erating revenue (NOPAT). By making use of NOPAT both SVA and EVA measure incorporate capital charges on the economic opera-tions of a business. Like EVA, SVA also makes use of WACC which implicitly addresses the notion of risk and expectations among shareholders (Challen, 1999).
Value based performance measures result in better accountability for the investment of new capital and provides accountability for the use of already existing investments. Man-agement also benefit from using SVA as it provides a greater focus on shareholder value. One of the limitations of SVA is that it is an aggregate measure, thus in order to make full use of SVA it is critical to understand the drivers of it. These drivers are (Challen, 1999):
improving revenue and/or decreasing costs
implicitly requiring that investments return at minimum the opportunity cost of capital
reducing non-productive assets
2.4
Summary of Frame of Reference
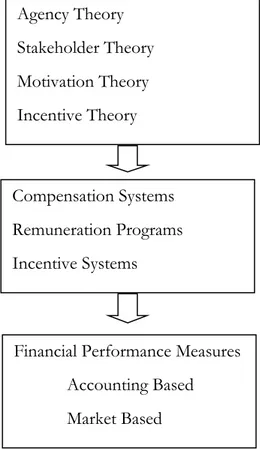
Below we present a summarizing picture, detailing the links between the background theo-ries and the performance measures. These compensation systems prerequisite adequate performance measures in relation to value creation.
Figure 2-2. Summarizing figure of the frame of reference (Authors figure)
Agency theory states that there is a conflict of interest between the agent and the principal that is the shareholder and the CEO/management. This conflict can be if not eliminated, at least reduced by the introduction of incentive systems which provide compensation for good performance. A performance system cannot be expected to perform well, unless it is built on solid metrics of performance that are clearly related to value of the principal, in this case the stock price. It is therefore, by extrapolation, necessary that such systems make use of adequate performance metrics. Below are two figures, figure 2-3 and figure 2-4, that shows the difference between accounting based and market based performance measures.
Figure 2-3. Accounting measures (Authors figure) Figure 2-4. Market measures (Authors figure) Agency Theory Stakeholder Theory Motivation Theory Incentive Theory Compensation Systems Remuneration Programs Incentive Systems
Financial Performance Measures Accounting Based Market Based
Initially we described the theo-retical background, which deals with the origination of the prob-lem, the stakeholders involved and the importance of right in-centives.
In order to suppress self-interest or realign self interest, so that it coincides with the interest of the shareholders, incentive systems are created which prerequisite an objective metric.
The performance of manage-ment needs an objective metric which stems either from ac-counting based measures or measures that rely on both ac-counting based and market based, which can capture share-holder value changes.
Accounting
Accounting Based Measures
Market Accounting
3
Method
This chapter contains the presentation of the chosen method used in this thesis. It entails the description of the research approach, research process, the chosen method and approach to data collection and analysis. The chapter ends with discussions on data reliability, validity as well as limitations of the chosen method.
3.1
Quantitative Data
We will investigate the predictive and explanatory power between commonly used perfor-mance measures and stock‟s price, using secondary data. Our aim is to investigate the rela-tionship of these variables, with help of an existing theoretical framework. Holme and Sol-vang (1997) suggest that when investigating the relationship between variables, a quantita-tive approach is the most suitable one.
Data in raw form hardly explains anything to most people, but processed into information and then analysed enables the investigator to describe and examine relationships within that data (Saunders et al., 2012). By using a quantitative approach we want to statistically exam-ine a sample and from there hopefully gain understanding about the entire population.
3.2
Data Collection and Analysis
For the purpose of our research we decided to make use of secondary data. In the case of research many automatically assume that some form of primary data gathering is the most useful. This need not be so, primary data is usually very time-consuming to collect and not seldom very costly. Secondary data can be a most useful source of information which can be used to answer, or at least aid in answering, research questions (Saunders et al., 2012). The forms that secondary data usually takes are raw data and some kind of processed or compiled data (Saunders et al., 2012). In this thesis, raw data will be used from the Stock-holm stock exchange obtaining stock prices and processed data gathered from companies‟ annual accounts retrieved through Retriever Business database, part of Retriever Research. The market premium rates were received from PWC‟s (former PricewaterhouseCoopers) website. The theoretical risk free rate, using Swedish government bonds with a 5 year time to maturity were gathered from the Swedish central bank‟s website. The historical Swedish corporate tax rate per year were received from Ekonomifakta‟s website.
3.3
Population and Sample
The companies included in our thesis were selected for reasons such as size, stock ex-change and available information. Swedish large cap public companies traded on the Stockholm OMX were chosen. These firms dominate the Stockholm Stock Exchange and are traded to a greater extent. All enterprises that constitute our population, from where our sample is drawn, have accounting rules and regulations which have been implemented in accordance with IFRS and ÅRL. Listed companies in one of the Swedish stock markets must also be monitored by that very same stock exchange, in our case all companies belong to the same market. The idea behind implementing the same accounting rules and regula-tions for companies is to protect investors and promote public confidence in the security market (Finansinspektionen, 2011). In our case it also has the advantage of making the da-ta, which in many cases are built upon financial statements, more credible.
In order to get a historical picture of the development of the value creation and in order to provide time for potential long term investments undertaken by management to impact stock price, we have chosen to base our data on the financial statements over a period of 2003 through 2011.
3.4
Data Validity and Reliability
Svenning (1996) describes validity of a study as the ability to measure what was intended to measure. Validity verifies that the results are consistent with reality and certify the link be-tween theory and empiric findings. It also indicates whether or not the investigation make proper generalizations based on specific studies or population sample. Data reliability on the other hand is usually described as an investigation where the data in terms of com-pleteness and accuracy can be used for the intended purpose. The results shall be consid-ered reliable and two studies with the same purpose and method will provide the same sult if nothing changes in a population. In other words, regardless of who conducts the re-search the end results should be identical. Quantitative studies tend to be more generalized, thereby placing even greater demands on data reliability compared to qualitative studies. Since our study is quantitative, this requires the empirical basis to be reliable. Our study concerns Swedish large cap companies and by incorporating most of these companies in our investigation, the empirical base becomes more reliable in terms of accuracy and com-pleteness. The accounting based data originally came from companies own financial state-ments which we gathered from the same data base. In this paper only Large Cap stocks were selected to investigate. These stocks are traded more frequently in general, making them more liquid. Hence the actions performed by one of these companies should be bet-ter reflected in the stock price compared to smaller and less liquid companies‟ stocks (Berk & DeMarzo, 2011).
After gathering the data, the data set had to be scrutinized in order to make sure that all the needed data was actually in the data set in order to carry out the statistical testing. Upon closer scrutiny, we found missing data in some companies for some years. We opted to re-move all the companies which had missing data points for all the years from 2003 to 2011. This caused the number of companies used in this thesis to drop from 60 to 33. Because of time constraints imposed, we opted to not manually collect these data points.
3.5
Correlation
Pearson correlation is a measure of linear dependence between two variables. It was devel-oped by Karl Pearson and is today a widely used tool in the sciences, when measuring the strength of linear dependence between two variables. The test makes use of the normal dis-tribution assumption, which means that the variables are thought to be normally distribut-ed. The coefficient is defined as the covariance between the two variables divided by the product of their standard deviations. The test is not so robust, that is to say, it is sensitive to large outliers and its value can be misleading if outliers are present (Aczel & Sounder-pandian, 2009). This is where the second test comes into view.
Spearman correlation is the most frequently used nonparametric measure of association be-tween two variables. The test gains some robustness while losing some explanatory power. The Spearman correlation indicates the tendency for two variables to have the same sign. For example, if Y tends to increase when X increases this implies a positive Spearman coef-ficient and if Y increases when X decreases the relationship is negative. The Spearman test is described as being nonparametric which can have two meanings, first is that the test de-scribes the monotonic function between two variables and the second one is that its exact sampling distribution can be obtained without knowing the joint probability distribution of the dependent and independent variable. Both the Pearson and Spearman tests are bound between 1 and -1, 1 indicates perfect positive relationship, -1 indicates perfect negative rela-tionship and 0 means that there is no correlation at all (Aczel & Sounderpandian, 2009). In accordance with previous research we will use correlation as a measure of predictive power among key ratios and changes in share price. Bacidore et al (1997) evaluated the predictive ability of EVA using traditional correlation tests and non-parametric tests. Ar-absalehi and Mahmoodi (2011) and Biddle et al. (1997) also drew conclusions based on the strength of linear dependence between two variables as measured by linear correlation. This is the common method used when conducting this type of research and forms the ba-sis for research in this field of study.
3.6
Panel data
A more well-known types of analysing data in field of statistics are ordinary single or multi-ple regressions. These methods are usually used when the data is for exammulti-ple pure time se-ries data or pure cross sectional data (Wooldridge, 2009). Researcher often collect data which have both cross sectional and time series dimensions generally referred to as panel data. In this paper the panel data consists of cross sectional units (33 firms) with a time di-mension of nine years. This data set is described as balanced since there is an observation for every unit of company for every time period (Wooldridge, 2009). Various regression models can in fact still be used to deal with this kinds of data, the three more common models; pooled OLS model, fixed dummy variable model and random variable model, will be explained further in section 3.7 (Statistical Model).
The advantages of panel data compared to cross-sectional data and time series data are numerous. For example, by blending the inter-individual differences and intra-individual dynamics leads to the following advantages (Hsiao, 2007):
More accurate inference of model parameters. This is possible because panel data usually have more degrees of freedom and greater sample variability, especially so in comparison to