Research Trends in Quality Management
over the years 2010-2011
Master Thesis
Claudia Juliana Alayón González
Supervisor: Bozena Poksinska
Examiner: Mattias Elg
Quality Technology and Management
Department of Management and Engineering
Upphovsrätt
Detta dokument hålls tillgängligt på Internet – eller dess framtida ersättare –
från publiceringsdatum
under förutsättning att inga extraordinära
omständigheter uppstår.
Tillgång till dokumentet innebär tillstånd för var och en att läsa, ladda ner,
skriva ut enstaka kopior för enskilt bruk och att använda det oförändrat för
ickekommersiell forskning och för undervisning. Överföring av upphovsrätten
vid en senare tidpunkt kan inte upphäva detta tillstånd. All annan användning
av dokumentet kräver upphovsmannens medgivande. För att garantera
äktheten, säkerheten och tillgängligheten finns lösningar av teknisk och
administrativ art.
Upphovsmannens ideella rätt innefattar rätt att bli nämnd som
upphovsman i den omfattning som god sed kräver vid användning av
dokumentet på ovan beskrivna sätt samt skydd mot att dokumentet ändras
eller presenteras i sådan form eller i sådant sammanhang som är kränkande för
upphovsmannens litterära eller konstnärliga anseende eller egenart.
För ytterligare information om Linköping University Electronic Press se
förlagets hemsida
http://www.ep.liu.se/
Copyright
The publishers will keep this document online on the Internet – or its possible
replacement –from the date of publication barring exceptional circumstances.
The online availability of the document implies permanent permission for
anyone to read, to download, or to print out single copies for his/hers own use
and to use it unchanged for non-commercial research and educational purpose.
Subsequent transfers of copyright cannot revoke this permission. All other
uses of the document are conditional upon the consent of the copyright owner.
The publisher has taken technical and administrative measures to assure
authenticity, security and accessibility.
According to intellectual property law the author has the right to be
mentioned when his/her work is accessed as described above and to be
protected against infringement.
For additional information about the Linköping University Electronic Press
and its procedures for publication and for assurance of document integrity,
please refer to its www home page:
http://www.ep.liu.se/.
© Claudia Juliana Alayón G.
Research Trends in Quality Management over the years 2010-2011
CLAUDIA JULIANA ALAYON GONZALEZ
Copyright © Claudia Juliana Alayón G. 2012, unless otherwise noted All rights reserved
LIU-IEI-TEK-A--12/01488--SE
Division of Quality Technology and Management Department of Management and Engineering Linköping University
SE-581 83 Linköping Sweden
ABSTRACT
In current globalized and highly demanding markets, Quality does not constitute any more a competitive advantage for organizations. Instead, Quality represents a basic market entry requirement for organizations indistinguishable from the country or economic sector they belong to.
Being conscious of the importance of Quality for all type of organizations, the purpose of this thesis is to contribute to the identification and better understanding of current trends in academic research on Quality Management. By analyzing a sample of 612 academic papers collected from five international Quality journals and two QMOD international conferences over 2010 and 2011, the author will study and reflect on the current trends of global academic research related to Quality Management.
Literature review was used as research methodology for the thesis. Academic papers were categorized, classified and analyzed in order to identify current research trends on Quality Management.
This work provides a snapshot of the current research trends on Quality Management. It benefits the educational sector, researchers, industry and practitioners by presenting an overview of the current research needs as well as potential future research topics.
As a result of this study, five main trending research topics on Quality Management were identified: management systems standards, total quality management, service quality, customer related processes after delivering product/service and excellence models.
China, India, USA, Sweden and UK were identified as the countries that have published the highest number of academic papers in international Quality journals during the studied period. Additionally, it was found a marked predominance of academic research on Quality Management towards the service sector.
These results and the answer to five proposed research questions were discussed and solved in this report.
2 Table of Content
1. INTRODUCTION ... 4
1.1 Background... 4
1.2 Problem statement ... 4
1.3 Purpose and research questions ... 5
1.4 Limitations ... 5
2. METHODOLOGY ... 7
2.1 Literature review ... 7
2.2 Type of data used ... 7
2.3 Sorting the data ... 8
2.3.1 Keywords ... 10
3. THEORETICAL FRAMEWORK ... 12
3.1 What is Quality? ... 12
3.2 Product Quality dimensions ... 13
3.3 Service Quality dimensions ... 14
3.4 What is Quality Management? ... 14
3.5 History of Quality Management ... 16
3.6 Drivers of research ... 20
3.6.1 Research Concept ... 20
3.6.2 R&D Concept ... 20
3.6.3 Research drivers ... 21
3.6.4 Forces driving Quality research ... 23
3.7 Quality research future trends ... 24
3.7.1 What is ASQ? ... 24
3.7.2 ASQ Future of Quality 2011... 24
4. RESULTS ... 27
4.1 International Quality journals ... 27
4.1.2 Distribution of journal’s research papers by geographical area ... 27
4.1.3 Distribution of journal’s research papers by country ... 28
4.1.4 Distribution of journal’s research papers by research methodology distribution ... 31 4.1.5 Distribution of journal’s research papers by economic sector (according to ownership)31
3
4.1.6 Distribution of journal’s research papers by main economic sectors ... 32
4.1.7 Top five countries and its economic sectors trends ... 34
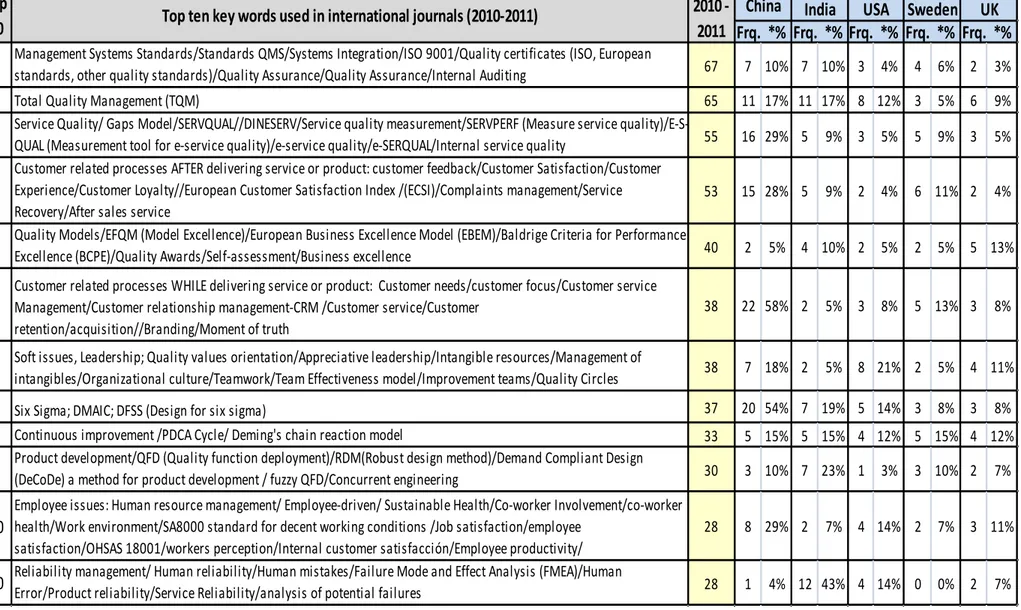
4.1.7 Top ten prioritized keywords ... 37
4.2 Description of the 5 trending topics found in international Quality journals ... 37
4.2.1 Management Systems Standards ... 39
4.2.2 Total Quality Management ... 40
4.2.3 Service Quality ... 40
4.2.4 Customer related processes AFTER delivering services or products ... 42
4.2.5 Quality models , Excellence models and Awards ... 43
4.3 Distribution of top 10 keywords within the top 5 countries ... 44
4.4 QMOD Conference during 2010 and 2011 ... 47
4.4.1 Distribution of Journal’s research papers by continent ... 47
4.4.2 Distribution of QMOD papers by country ... 48
4.4.3 Distribution of QMOD conference papers by research methodology ... 49
4.4.4 Distribution of QMOD research papers by economic Sector (according to ownership) . 50 4.4.5 Distribution of QMOD research papers by main economic sectors ... 51
4.4.6 Top 5 prioritized keywords for QMOD conference. ... 52
4.5 Relevant Quality Management textbooks and main common topics addressed ... 54
5. DISCUSSION ... 58
5.1 Comparison of results from international Quality journals versus QMOD conference ... 58
5.2 Gaps between literature and the results obtained from International Quality journals ... 59
5.3 Comparison of results obtained from international Quality journals versus ASQ future study perspective ... 61
6. CONCLUSIONS ... 63
6.1 Answers to research questions ... 63
6.2 Further work ... 66 APPENDIX... 67 ACKNOWLEDGEMENTS ... 70 REFERENCES ... 71 Journal Articles ... 71 Books ... 72 Web Sources... 73
4
1. INTRODUCTION
In the current section a brief introduction is given about the thesis topic. The study problem is described and the research purpose and questions are postulated. Finally the limitations are pointed out.
1.1 Background
From the past two decades globalization on markets has opened consumer’s eyes to a remarkable range of products and services that seemed unimaginable before the 80’s. The reduction of barriers for international trade has resulted in increasingly companies’ efforts to improve their manufacturing and/or service operations in order to provide the best offer to every day more demanding markets.
Globalized markets have shown that to be able to enter and remain in this discerning environment, Quality is a key aspect needed to achieve and sustain a competitive advantage. This has made clear that Quality matters indistinguishable from the country or economic sector the organizations worldwide belong to.
Being conscious of the importance of Quality for all type of organizations, this thesis aims to contribute to a better understanding of ongoing trends in academic research related to Quality Management. Research trends will be studied using the academic papers included within the sample of five international Quality journals and papers accepted for the QMOD (Quality Management and Organizational Development) conference over the two years. The author will look for the trends by examining the published articles both in international Quality journals and QMOD conferences papers.
1.2 Problem statement
Quality is an interdisciplinary field that catches the attention from all industries and economic sectors. Therefore, it is worth to be updated with the latest trending topics.
The assumption of the thesis is that if journal papers are published about certain topics, this is highly related to an existing need or interest in getting a broader knowledge about this specific research aspect. The knowledge about the trending topics on Quality Management benefits the educational sector, researchers, industry and practitioners by giving an overview of current research needs as well as potential future research alternatives.
5
The value of this study represents also a wider understanding of the worldwide Quality research dynamics. It will not only identify the current Quality Management research trends, but additionally it will provide more punctual information such as: Countries with the highest participation on quality research, economic sectors where research efforts have been taken more assiduously, common research topics and economic sectors within the top 5 countries with the highest participation in Quality Management research…
In addition, the last part of the thesis will present an analysis of the found research trends. The analysis will disclose the existence of a potential gap between what has been taught by the academy and the current trends in Quality topics.
1.3 Purpose and research questions
The purpose of this thesis is to contribute to a better understanding of current trends in academic research on Quality Management worldwide. By analyzing a sample of papers from five international Quality journals and International QMOD conference published during 2010 and 2011, the author will study and reflect on the current trends of global academic research related to Quality Management.
For this purpose the following research question (RQ) will be addressed:
RQ1: What are the current worldwide trends on academic research related to Quality
Management over 2010-2011?
RQ2: Which countries have published the highest numbers of academic papers in
international journals of Quality Management?
RQ3: Which economic sectors have been researched more intensively in academic
papers published in international Quality journals over the past two years?
RQ4: What are the main differences or similarities between the findings from
international Quality journals and findings from QMOD conference?
RQ5: Is there any gap between the contents included in the sample of Quality textbooks
and the content of the Quality trends found in the sample of international Quality journals?
1.4 Limitations
The first limitation of this study emerges from the time scope, since the study only included sources from years 2010 and 2011. The time limitation applies also for the data collected from QMOD conference, where the same years were considered for collecting data.
6
The second limitation emerges from the study sample. For this study, the author considered only academic papers published in specialized Quality international journals available in LiU electronic library database. Nevertheless, there is a lot of Quality Management research published in other type of journals as general management journals.
There were Quality journals to which it was not possible to have access; because of this there was an exclusion of American Quality journals and Asiatic Quality journals.
Including the research papers from other journals would be valuable in further studies, but unfortunately out of scope for this thesis work. This limitation can to some extent influence the results presented in this thesis.
7
2. METHODOLOGY
This chapter describes the methodological approach used in this study, i.e. the literature review. Additionally, since the data used in the study was qualitative and merely collected from secondary sources of information; I will describe the qualitative research methodology.
2.1 Literature review
Generally speaking, literature review is the process of studying what has already been written on a particular subject or subjects. Literature review definition is stated in Cooper (1998).
“Literature reviews typically appear as detailed independent works from secondary data or as brief introductions to reports of new primary data. For instance literature reviews can focus on research on outcomes, research methods, theories, applications, or all these. Literature review can attempt to integrate what others have said, to criticize previous scholarly works, to build bridges between related topics areas, to identify the central issues in a field, or all these.” (Cooper, 199. p.3)
For the current thesis qualitative secondary data will be collected from five international Quality journals and QMOD Conference. The articles contained in these sources will be analyzed in order to be able to identify current trends in Quality Management.
The literature review I carried out in this thesis differs slightly from the classical approach of literature review (described above).The classic approach discusses extensively the information of published scientific works about a punctual subject. This thesis did not deal with any specific Quality Management topic exclusively throughout the whole document. I did not review a specific subject. Instead, I collected secondary data (academic papers), which I categorized, classified, analyzed to finally be able to identify trending research topics on Quality Management.
2.2 Type of data used
Secondary data, specifically Quality related journal papers were collected from recognized international journals published during 2010 and 2011. The journals considered in the sample were chosen among the available journal subscriptions to LiU electronic library database, and also all of them contained the word “Quality” in its title.
8
• Total Quality Management and Business Excellence • Total Quality Management (The TQM Journal)
• International Journal of Quality & Reliability Management • International Journal of Productivity and Quality Management • International Journal of Quality and Service Sciences
These journals were chosen because all of them are Quality specialized international journals. These journals are well known on quality research for both products and services.
Despite the five quality journals, papers from a European conference on Quality and Service Sciences (QMOD) were analyzed. The time frame was the same as for the journal papers (i.e. 2010 and 2011). The conference has become one of the most known scientific conferences in Europe within the research fields of Quality and Service Management, Organizational Development and related management issues.
The first QMOD Conference was held in Zhengzhou - China, 1997. It was a joined initiative by Århus School of Business (Denmark) and Zhengzhou Institute of Aeronautic (China). For the next three QMOD conferences, Århus School of Business worked together with other international higher educational institutes to organize the conference.
In 2001 Linköping University organized the 4th QMOD conference. From this year Linköping University joined the organizing committee of the conference. In the same way, Lund University joined the organizing committee by the 9th QMOD Conference (2006). The committee is supported by other international higher education institutions from different countries such as Korea, Mexico, France, UK, Italy, Germany, Spain…
Nowadays, LiU and Lund University continue working on the organization of the conference. Each year, the location of the conference changes, as well as the guest university collaborating on organizing the event.
2.3 Sorting the data
For the analysis purpose of this study, in order to sort the paper’s information in a systematic way a data base on excel was created.
A sample of 665 journals papers was included within the study.
The data base was built by extracting significant elements from each paper, included title of the article, keywords, country where the research was made, economic sector the study was aiming to (according to economic activity and ownership) and, research methodology.
9
Since the publications on the conferences and the journals may differ significantly, results were divided into specialized international quality journals’ results and QMOD results.
The need to split the articles into these two main groups has two motivations. First, the location of the conference has an impact on the number of articles presented in the conference. Conference’s geographical location influences significantly the list of countries that submit papers to a conference. It is being common that authors living in countries located near, or in the country conference itself, usually have the higher numbers of articles submitted to the event. Second, the publications presented on the conferences include often a wider set of research topics. Conferences are more open to research topics, which are first emerging or are at the exploration stage. It is also possible to present at conferences certain studies, which did not lead to expected results e.g. studies where the theoretical assumptions were wrong and not confirmed by the empirical results.
For each of these two main groups (International Quality Journals and QMOD conference), all papers were analyzed according to:
Geographical distribution of the academic paper: Determined by the geographical
location (country and continent) of the university or academic institution of the academic paper. In case of more than one author from different universities located in different countries, the geographical location of the first author named in the paper was considered. This because, usually the person who does most of the work and writes the paper is generally listed as the first author of a scientific paper.
Research methodology distribution: Papers were classified by the research method (i.e.
case study, literature review, research paper, conceptual paper, mathematical modeling, simulation modeling). The former classification for the research methods was structured based on Sachan and Datta (2005) and Scandura and Williams’s (2000) classification. This classification is also used by the Emerald journals.
Another research method category for the papers was “Combined research method”, which involved more than one research method. In “Combined research methods” academic paper could be either multi-method design or mixed methods designs. Multi-method design is when an academic paper uses more than one Multi-method but all of them belonging to quantitative or qualitative research. Mixed method design is when an academic paper includes a mix of both qualitative and quantitative research method. Concepts of multi-method design and mixed methods designs are taken from (Tashakkori and Teddlie, 2003).
Economic sector: The economic sector can be analyzed by using two classifications: the
10
sector and social sector) and the second one according to the classification of economic activities in the European Community (NACE, 2008).
Distribution by economic sector ownership: The purpose of this classification was to know the economic sector (according to ownership) to which the academic paper focused its research. Economic sector by ownership according to IMF working paper (2009), is divided in: Public, private and social. Since some papers analyzed both public and private organizations, it was pertinent to include the Hybrid classification of Public/Private sector. Formal classification of economic sectors by ownership can be found at Lienert (FMI, 2009).
Distribution by economic sector: Based on the classification of economic activities in the European Community (NACE, 2008), papers will be classified considering the main economic sectors that papers were aiming at (e.i Manufacturing, Services, Manufacturing/Services, Health Care, Education, Building and Construction and Others). Health Care and Education will be treated separately from Services since they are large and it would be interesting to see the research trends in these two sectors.
Even though NACE provides a large and detailed list of economic sectors, the author chose the sectors above looking for a having a good coverage of the main economic sectors, as well as those sectors with focus on Quality Management research.
2.3.1 Keywords
One of the main elements, if not the most important, retrieved from the analyzed articles was the keywords which were contained at the beginning of each article. As mentioned in the previous section, the database was build for collecting information from papers found in each international journal, over the two years of study (2010 and 2011).
As feeding the database during the collecting information’s phase, a large list of keywords was built for each of the journals, during each year. The keywords list was increasing with every journal analyzed.
The keywords list became quite extensive to the point that just only after going through the second (out of five) quality journal, the list was around 80 keywords. The reason why the list became so extensive was linked to the frequency of the article’s keywords, where some words were hitting the list many times, while others just a few times or simply once within the large list.
11
• Authors naming in different ways the same topic: by mentioning similar keywords which all of them were related to the same concept.
• Authors mentioning up to 6 keywords per article: only few of these keywords were related to the main topic the article was dealing with.
At this point, the keywords database looked unstructured. It was a very long list of individual keywords. Considering this, and seeking to simplify and take only the relevant information to the results phase, keywords were clustered according to common concepts.
By grouping conceptually related keywords, the list decreased substantially, gained structure and became easier to work with. The new grouping strategy for the keywords did not just allow differentiating the main topics related to Quality Management, but also avoided keywords duplication within the same article.
12
3. THEORETICAL FRAMEWORK
This chapter consists of two parts. In the first part the Quality concepts and history will be described. Here I will explain the theory of quality, quality management and the evolution of the quality movement. These concepts will be explained by giving the reader a general overview about the central topics around which the whole thesis is developed.
In the second part, a literature review will be done taking as reference the eight main Quality textbooks used by teachers and students at different universities in quality courses. A comparative table will be done presenting the most frequently mentioned topics dealt in these books.
3.1 What is Quality?
Quality is a word that everybody uses frequently on a daily basis within their vocabulary. However, even if it is very commonly used word; it has a variety of interpretations and applications depending to the user and the different situations.
Most people who claim to “know” the meaning of the word, say they can tell when a product or service has quality when they “see it”.
By breaking down the word quality, it is possible to analyze its linguistic sense. Quality is created from the Latin prefix “quails” which means “such as the thing really is” (Dale et al, 2007). One of the most known generalized and international definitions is the one given by the International Organization for Standardization (ISO), within ISO 9000:2000. The standard states: “Quality is the degree to which a set of inherent characteristics fulfils requirements, i.e. needs or expectations that are stated, generally implied or obligatory”.
At this point it is worth to mention the significant contribution made by a group of authors to the quality theory. The legacy of these men has been crucial for building up over the years the quality knowledge we count on nowadays. This group of men is most known as “The Quality Gurus”, because they developed a concept and approach to quality within business that made a major and lasting impact. The word “guru” by definition is a good person, a wise person and a teacher. Below, I present definitions of the quality concepts given by some gurus who developed the quality philosophy:
Philip B. Crosby (1979): “Quality is conformance to requirements” Joseph M. Juran (1967): “Quality is fitness for use”
Edward Deming (1986): “Quality should be aimed at the needs of the customer, present and future”
13
Genichi Taguchi (1986): “The lack of quality is the losses a product imparts to the society from the time the product is shipped”
Considering all the existing quality definitions, some of them broader than others, still there is no such a thing as an official and unique definition for the word quality. But in most quality existing definitions, the common element is that quality aims to meets customer’s expectations or desires.
3.2 Product Quality dimensions
From the concepts presented above, there is still place for ambiguities when it comes to translating those “quality meanings” into measurable or tangible attributes to be clearly seen on products. With this in mind, David Garvin (1984), developed one of the most recognized sets of quality dimensions for products.
The 8 dimensions of quality involve the perceptions from managers, operators and customers in respect to quality on products. This because what quality is for a customer may not be exactly the same as what quality is for a manager. Quality perceptions may be different among these groups, and listing product quality dimensions allow sharing the same perception of quality by managers, customers and operators.
Garvin’s eight product quality dimensions are:
1. Performance: refers to the efficiency with which a product achieved its intended purpose.
2. Features: constitutes the attributes if a product that supplement the product’s basic performance.
3. Reliability: refers to the tendency of a product to perform as it is supposed to over its useful designed life.
4. Conformance: Does the product conform to the specification? Corresponds to the specifications, or numerical dimensions for the product performance such as durability, size, speed, capacity, weight…
5. Durability: means the degree to which a product endures stress without failing.
6. Serviceability: Means how easy a product can be repaired. Is the product relatively easy to maintain and repair? The easiest its reparation is, the more serviceable that product is.
7. Aesthetics: refers to the subjective attributes of the product such as taste, smell, sound, look and feel. The closest the product attributes matches the customer preferences, the highest quality that product will be in terms of aesthetics.
14
8. Perceived Quality: This dimension depends on customer opinion about the product. The product may possess adequate or even superior dimensions of quality, but still may fall victim to negative customer perceptions.
3.3 Service Quality dimensions
Knowing that services are intangible by nature, quality in services is much more difficult to define than quality in products. The reason of this is because there is a higher customer involvement within the service creation process, which generates wider variations of the final services (Foster, 2004).
The service quality dimensions were postulated by Parasyraman, Zeithamel, and Berry (1984) in order to evaluate the quality in services. They found five dimensions customers use when evaluating service quality:
1. Tangibles: Refers to the physical aspect of the service. Facilities where the service is
provided, personnel appearance, equipments…
2. Assurance: It is related to the knowledge of the employees and the way they inspire trust to the customer about the service.
3. Service reliability: Is the service provider delivering what it is expected to? This dimension refers to the capacity of the service provider to perform as expected in a faithful manner.
4. Responsiveness: It is the capacity of the service provides to react if problems occur and be helpful through the service process.
5. Empathy: Is the service provider caring about the customer? This dimension is related to the individualized attention to its needs given by the service provider to the customer.
Once known these product and service quality dimensions, it is easier for each company department to work towards the common goal of getting quality on products/services as expected by clients.
3.4 What is Quality Management?
“Quality Management is defined as an integrated approach to achieving and sustaining high quality output, focusing on the maintenance and continuous improvement of processes and defect
15
prevention at all levels and in all functions of the organization, in order to meet or exceed customer expectations”.(Flynn et al, 1994)
According to Flynn (1994), Quality Management has been a key element in the world class manufacturing approach to achieving and sustaining a competitive advantage. During the early 90’s, the current service boom we experience nowadays had not started yet. This explains why most of the efforts on Quality Managements where in its majority aimed towards quality in products. This can be seen in the Quality Management’s measurement instrument postulated by Flynn (1994), which was designed considering the world class manufacturing.
The measurement instrument postulated by Flynn (1994) was composed of 14 scales, representing various measures of Quality Management practice dimensions, i.e. (top management support, quality information, process management, product design, workforce management, supplier involvement and customer involvement). These dimensions were also identified by Flynn and constituted during the early 90’s a newly develop theoretical framework which was the base of the measurement instrument. It is worth to mention that the seven dimensions were identified taking as focal point products and not services. This can be seen in the existence of the dimension “Product design” and the absence of a “service design” dimension. This particular dimension considered the design weakness to be the greatest source of product failure.
Another definition about Quality Management is the one give by ISO 9001:2005. It defines QM as “Coordinated activities to direct and control an organization with regard to quality.” ISO 9000:2005 Classified these activities to manage the organization in matter of quality in the following way:
• Quality Planning: Part of Quality Management focused on setting quality objectives and specifying quality necessary operational processes and resources to fulfill the quality objectives
• Quality control: Part or Quality Management focused on fulfilling quality requirements.
• Quality assurance: Part of Quality Management focused on providing confidence that quality requirements will be fulfilled.
• Quality Improvement: Part of Quality Managements focused on increasing the ability to fulfill quality requirements.
The Quality Management (QM) concepts given by Flynn and ISO 9000:2005 are similar in the sense that both of them perceive QM from a holistic point of view. Both think the way to obtain sustainable Quality output is by involving the entire
16
organization, at all levels. While a difference between them is that Flynn’s theoretical framework was designed and centered exclusively towards Quality in products, while ISO 9000:2005 was broader and focused in both product and services.
3.5 History of Quality Management
Quality Management has evolved over time. Based on Bergman and Klefsjo (2010), the most relevant echelons during this progress will be depicted..
The Prehistory
: Here the quality lied on specialization of the work. Great craftsmanship was the way to get products/services of high quality. The industrial revolution
• Assembly: By trying to solve problems in assembly, specifically problems related to the high variation among the different parts to be assembled, Honoré le blanc, developed a system for manufacturing muskets. The system was to produce muskets to a standard pattern using interchangeable parts and assembling them. This is how the Musket assembly line was born. This system was later adopted in US and succeeded there thanks to the setting of tolerances. If tolerances are defined and the component parts are manufactured according to these settings, all the component parts can be easily assembled.
:
• Taylorism: Federick Taylor (1911) separated planning function from the execution function. Managers and engineers were in charge of the planning function, while operations were assigned the execution function. Operation was separated from inspection. Job was segmented into specific tasks, there was a focus on increasing efficiency and quality assurance relied on inspectors. Defects were present but removed by inspection.
Walter Shewhart:
He applied a statistical perspective to the production process. He suggested the control chart as a tool for handling variations. Shewhart pointed out how to maintain the data and draw conclusions from it, so the variation in the production process will be under control and supervised.
Edwards Deming (Late 40’s) and Joseph Juran (mid-50’s). Both of them emphasized the importance of top management support on continuous quality improvements. Deming stated that quality cannot be achieved by depending on inspection and highlighted the statistical process control. Juran highlighted the importance of working continuously on quality improvements. The big difference
17
among these two quality gurus was that Deming ignored the cost of quality, while Juran claimed that reducing these costs is vital for any business.
Japan after the Second World War (1950-1985)
• Kaoru Ishikawa: believed in the utility of statistical methods to solve problems. Ishikawa designed “The seven quality control tools”. He suggested the use of “The seven quality control tools” during Quality control circles. Ishikawa aimed to involve all the company (operators, top managers, engineers, administration staff…) within the quality improvement process.
: After the Second World War Japan started to rebuild its industries, helped by the innovative ideas of Deming and Juran.
• Taiichi Ohno: (1950) He was the developer of the Toyota production system (TPS). He stressed the importance of reducing waste and unnecessary work. He created the Kanban method and the Just in time concept. These production techniques are the cornerstones for lean production as we know it today.
The western quality revolution
• Six Sigma began in 1986 as a statistically-based method to reduce variation in electronic manufacturing processes in Motorola Inc – USA. This business management strategy aimed to improve the quality of process outputs by locating and eliminating the causes of defects and decreasing the statistical dispersion in not just manufacturing, services and business processes.
During the 80’s USA started the awakening process for improving the quality on its products. This as a reaction to the international competence and the progressive and superior quality inherent to Japanese products. After 3 decades that Deming had helped Japan to improve the quality and its industry, USA finally adopted Deming’s quality teachings.
• Quality Awards: In 1987, as a way to incentive the quality initiatives among American organizations, USA founded the “Malcom Baldridge National Quality Award”. A couple of years later in Europe, (1992) the European Foundation for Quality Management (EFQM) established the European Quality Award. Nowadays this award is known as EFQM Excellence Award. It is worth to mention that these are not the only Quality awards. Awards have been established within different countries worldwide (e.g. Utmärkelsen Svensk Kvalitet given by SIQ in Sweden since 1992).
• Lean Production: in 1985 was the given name to a production practice based on the Toyota Production System and the teachings giving by Taiichi
18
Ohno (Womack, Jones and Roos, 1991). Lean was focused on preserving value with less work. Lean production has evolved in Lean thinking and Lean six sigma.
• TQM total Quality Management was first coined as a term on 1985 by the Naval air Systems Command to describe its Japanese style management approach to quality improvement. TQM is perceived as a holistic concept of values, methodologies and tools that are combined to achieve higher customer satisfaction with less resource consumption.
• Quality Management Systems: During 1987, in Europe, the first version on ISO9000:1987 was published. This represented the beginning of the Quality Management systems we currently know.
Figure 1, shows the evolution of quality practices in history. One of the most visible and curious aspects was the change through the years of human involvement on quality. Quality has evolved from being a responsibility of a single person to be a shared responsibility where all people in the organization are involved. This change also implied a shift from quality relying on inspection to remove the defects from the line, to a conception of quality as a holistic continual improvement process, minimizing waste at its maximum, and eliminating the source of defects.
19
20
3.6 Drivers of research
3.6.1 Research Concept
The word Research has its origins in the middle French recerche, from recercher to go about seeking, from old French recerchier, from re- + cerchier, sercher to search (Merriam-Webster's, 2005).
Research is defined as "the systematic investigation into and study of materials, sources, etc., in order to establish facts and reach new conclusions" (Thompson, 1996). Other definition is given by Creswell (2008), "Research is a process of steps used to collect and analyze information to increase our understanding of a topic or issue".
3.6.2 R&D Concept
The United Nations Educational, Scientific and Cultural Organization – UNESCO (1978) defined R&D as a creative work addressed on a systematic basis which objective is to increase the stock of knowledge, including knowledge of man, culture and society, and the use of this stock of knowledge to create new applications.
UNESCO also points out that R&D covers the following three activities:
• Fundamental or basic research: It is the experimental or theoretical work aiming to acquire new knowledge of the underlying foundations of phenomena, without specific applications in mind. Basic research is a type of research inside scientific knowledge which lacks of punctual and immediate commercial objectives.
• Applied research: Deals with the original investigation which purpose is to acquire new knowledge. It is addressed primarily towards a specific practical aim or objective. Transnational research is aimed at gaining the knowledge or understanding to meet a specific, recognized need, or solve a specific problem
• Experimental development: It is a work based on existing knowledge gained from research or practical experience. This study is conducted to produce innovations (e.g. new materials, products and devices, to installing new processes, systems and services, and to improving substantially those already produced or installed).
As seen in the study sample in this thesis, for Quality Management, the most frequent type of R&D used is applied research. This is mainly because applied research is focused in attending specific problems/needs in real life organizations. This type of Research
21
involves the application of different methodologies to solve problems or improve organizations (e.g. Implementation of ISO 9001, Six sigma, lean…)
Looking for measuring R&D efforts in different countries or even in minor scales measuring R&D within companies, the concept R&D intensity emerges. The definition for R&D intensity can be found at (OECD, 2011) “R&D intensity (R&D expenditure as a percentage of GDP) is used as an indicator of an economy's relative degree of investment in generating new knowledge.” Several countries have adopted "targets" for this indicator to help focus policy decisions and public funding.
For purposes of the present study and looking for terminology unification along the document, both Research and Research and Development (R&D), will be addressed as research. This, due to R&D has a more specific description within a broader concept which is Research.
3.6.3 Research drivers
This section introduces some of the more representative factors that urge on research or R&D.
High Market entry or High level of competition: Cullman et al (2009), as well as
Acs and Audretsch (1990) and Geroski (1991) stated that high market entry rates increase the incentives to innovate due to strong competition, and thereby, the overall level of research of a country. In other words, if a country has high governmental regulation, competition will be reduced by raising barriers to entry to this country. Hence, it will reduce not just the competitive pressure, but the incentives to innovate or research efficiently.
High levels of competition increase the incentives to allocate wisely limited resources as a way to stay alive in the market (Boone, 2008). In this order of ideas, high market entry rates and the competitive environment it generates for national industries are strongly linked to higher levels of research and innovation within the country. In other words, high market entry drives Research.
Technological specialization Another driver can be found in Matieu and Van
Pottelsberghe (2008). Here, they mentioned that technological specialization and not a country-specific environment particularly favorable to research, is what influences significantly the research intensity.
Funding Sources: Usually research funding comes from government, corporations or
foundations. These entities allocate the funding resources for scientific research. This Research is carried out mainly by universities or specialized government agencies.
22
Public Policies: According the European Commission (2009), among the most common
public policies for supporting R&D efforts, the following can be found
Research subsidies: The government can stimulate research with direct measures, either through fiscal incentives or by means of direct financial support.
Fiscal incentives for Research:
• Product market regulation and other legal frameworks:
Fiscal (Tax) incentives are a tool to provide assistance to a large variety of economic sectors when it comes to research (R&D). Tax incentives encourage on a bigger extent the long term investments for R&D.
• Direct local public aid
• Direct public aid from other sources
Other influential factors that trigger research or R&D are the ones described by Cincera, Cozza and Tübke (2010, Page 10). These factors were originally taken from a monitoring industrial research study, which is based on an EU annual survey on investments on R&D. The influential factors are as follows:
• Market pull: It is when the stimulus for innovation or research comes from the unsatisfied needs of society or a particular section of the market (OU, 2010).
• Improving corporate productivity
• Exploiting technological opportunities (technology push): In this case the innovation or the research starts first with an idea or a discovery. This idea is pushed to the market .Here the starting point is basic scientific research or applied research and development (R&D) in organizations. (OU,2010)
• Local and Global competition
• Product market regulation and other legal frameworks
From this section it is relevant to stand out the importance of Market pull as a research driver when it comes to Quality Management. Specific organizations or entire industries frequently present some recurrent problems to be solved (e.g. Obstacles while implementing lean in health care sector, needs for finding accurate ways to measure quality in services…). These are a few examples of problems or unsolved needs that face real life organizations. These problems have an urgency to be solved by the organizations or industries that in some cases turn to academic institutes looking for collaboration to solve these problems. In other cases, the initiative of solving the
23
problems comes directly from the academy itself that after observing and studying the industry identify unattended needs or problems to be solved.
In this order of ideas it is possible to state that market pull as a driver for doing research, support the assumption that current research trends on Quality Management reflect the needs or unsolved problems that industries and organizations around the world are currently facing.
3.6.4 Forces driving Quality research
Apart from the former authors, ASQ (American Society for Quality), found that there is a set on forces that are shaping the future of Quality (ASQ, 2011). For the ASQ, quality has been behaving dynamically reacting to the forces of change. Quality is not today what it was twenty years ago, or even five years ago. Being this the reason why ASQ carries out the studies about the future in Quality every three years since 1996. In these studies, both the forces of change and the quality trending topics, usually vary from year to year. For the year 2011, some of those forces or drivers acting on current/new quality trends were as follows:
Global Responsibility: It is the awareness of the need of becoming more socially responsible. It is being conscious of the global impact of the local decisions taken inside organizations. The global responsibility includes fair operating practices, consumer interests, environment, labor practices and other contributions to society. An example of this Global responsibility can be seen in ISO 26000.
Consumer Awareness: Means that consumers now own the knowledge (thanks to internet) to make purchasing decisions more aligned to their preferences. Now customer’s purchasing decision is not constrained to be made only locally (geographically), he can find what he wants in other geographical markets thanks to the social media and its accessibility to instant information. Consumer awareness is also reflected in new flexible manufacturing technologies and greater flexibility in organizations to create products and services to match customers.
An Aging Population: The increasing life expectancy challenge world resources and place importance on the cost of providing healthcare to a larger percentage of the world’s population.
21st-Century Quality: Quality in the last century was defined by control and improvement, and that control and improvement according to ASQ will not be
24
sufficient for the 21st century. For ASQ, change and transformation are the emerging tools of Quality. Also, “near perfect product/service quality” is considered will be a minimum for being competitive in the future.
Innovation: It is the ability of a company to anticipate customer needs, expressed or unexpressed, known or unknown, and bring products/services to the market place that delight customers. Innovation is the fuel of growth in today´s changing world.
3.7 Quality research future trends
When discussing about Quality topic trends that have potential to be researched in the next years, ASQ outstands as one of the main Quality institutes that sets the bar when it comes to predict those quality topics that will be trending worldwide for the next years. This according to how the world has been evolving in terms of Quality.
ASQ acts here as point of reference for analyzing and forecasting current and future Quality trending topics. This due to its long tradition while working in providing quality services consultancy and research to companies worldwide. Based on the former, this section will deal with the future of quality study presented by ASQ within its 2011 Future Quality study, which constitutes the one of the few serious sources about Quality trending topics.
3.7.1 What is ASQ?
ASQ is a global community providing the best quality resources (e.g. publications, training, certifications) and experts in Quality area, organizations and industries concerning to Quality (ASQ, 2011). ASQ is also considered as the global knowledge network that links the Quality ideas, tools, and experts.
3.7.2 ASQ Future of Quality 2011
Aiming for predicting the next trending Quality topics, ASQ developed a study that included 140 professionals, representing 33 countries distributed among all five continents. The study contained information from all major sectors of global economy. It is worth to mention that this study is not the first one carried out by the institution on future of quality. ASQ has conducted six “Future of Quality Studies” – in 1996, 1999, 2002, 2005, 2008 and its last one was in 2011.
From this report it is possible to extract trending Quality topics from the comments made by the authors about the future of Quality. These comments were as follows:
25
Excellence will be the market entry point, not just an ambition, or at aim that has the
probability of not being obtained. Products and services must be delivered without errors and always exceeding customer needs. Non-value-added activities will be permanently eliminated.
Quality useful to society Far beyond filling a market gap or satisfying a customer need,
the quality organization will be useful to society. Quality should shape society.
Quality beyond quality systems: In terms of methodology, quality leans to quality
systems, but organizations need to have a holistic perspective of quality, one far beyond of the product or services.
Innovation is a daily imperative, is mandatory for obtaining betterment. But this time,
there is a lower concern that quality goes against innovation. In fact, innovation and quality complement one another very well. Innovation tools need to be included into the quality toolkit.
Sustainability programs in quality: For years, organizations have been doing significant
efforts on waste reduction. Nowadays, besides this, it will be highly important that organizations create and implement sustainability programs.
Customer awareness: Thanks to globalization marketplace is changing rapidly. Clients are becoming highly aware of their options; are learning more quickly of positive and negative attributes of products, services; and are expecting more responsive offerings.
Global responsibility: Quality decision nowadays and in the future will be taken while
considering the environmental sustainability and the social responsibility; these two making up the global responsibility quality concept. Quality decisions have consequences on consumers, communities, employees and environment.
Enterprise excellence and sustained competitive advantage: according to ASQ,
nowadays counting with quality in products/services does not constitute a competitive advantage for a company; but what it does is having Quality Management to the entire organization (e.g. Baldrige Performance Excellence Program, EFQM Excellence Model, or Global Performance Excellence Award).
From product/service centric quality to experience centric quality: Since quality in
products and services are not longer competitive advantage but a minimum market entry requirement, companies are starting to offer experience quality (Experience Management). This means that companies manages every aspect of the customer experience to deliver quality and not just quality on the end product/service.
Waste reduction: Triggered by the worldwide financial crisis, organizations are using
26
New roles for the quality leader: Nowadays the ideal quality leader not just must count
with knowledge on statistics, defect prevention, process control, but also with soft skills and some finance knowledge. This since quality leadership is no longer limited to a quality department, but the whole organization.
27
4. RESULTS
In this chapter, results will be presented alongside the analysis. In some sections the author of this thesis will be answering the research questions posed at the beginning of this study.
4.1 International Quality journals
A total of 5 quality specialized international journals were analyzed according to the information gathered in its published papers during 2010 and 2011. The information presented in this section will be divided into Geographical distribution, Main economic sector distribution, Distribution by economic sector ownership and Research methodology distribution
4.1.2 Distribution of journal’s research papers by geographical area
Figure 2. Paper distribution by continent (2010)
Figure 3. Paper distribution by continent (2011) 38.8%
41.4% 0.8% 14.8%
1.3% 3.0%
Article's global distribution 2010
Europe Asia Afrika North America South America Australia 37.5% 48.7% 0.4% 11.6% 0.4% 1.3%
Article's global distribution 2011
Europe Asia Afrika North America South America Australia
28
Distribution of research papers by continent is shown in Fig. 2 and 3, which indicate that Asia has been leading as the continent with the largest participation on international quality journals over the past two years. Asia shows an increment of 17.6% in the participations of Asian institutions on academic quality papers from 2010 to 2011.
The first place of Asia is followed closely by Europe, where in contrast to Asiatic increment; Europe has a reduction in the participation of European Institutions of 3.3%.
North America on the third place and with a much lower participation, also presented a fall of 21.6% from previous year participation. Australia, South America and Africa due to its low numbers of published papers, they did not represent a significant portion of the distribution cake.
4.1.3 Distribution of journal’s research papers by country
This section will answer the following research question:
RQ2: Which countries have published the highest numbers of academic papers in
international journals of Quality Management?
In international quality journals, 461 articles were published from 48 different countries during the two years of study. 237 papers were published in 2010 and 224 papers in 2011. Figures 4 and 5 show the distributions by countries.
In figure 4, the top 10 countries that contributed with most papers on quality related topics were: China, USA, India, UK, Sweden, Spain, Greece, Malaysia, Italy and Iran. With 36 articles (15%), China was the country that published the highest number of articles in quality journals, followed by 29 articles from USA (12%), 26 from India (11%). Iran is in 10th place within the top 10 countries with the strongest participation on international quality journals during 2010.
Figure 4. International paper’s distribution by country (2010)
0 5 10 15 20 25 30 35 40 Chi na U SA Indi a U K Sw ed en Sp ain G reec e M alay si a It aly Iran Ca na da Fin lan d A ust rali a G er m an y Jap an Po rt ug al Th ailan d N et her la … N ew … Po lan d Turk ey Sl ov en ia N or w ay Pak ist an D en m ar k So ut h … Be lgi um Isr ae l U n. A ra b … Sr i Lan ka Arg ent ina Eg yp t Fij i I slan ds Pe ru Br az il Ku wait Tu nisia Ban glad e… M au rit iu s N o. o f a rti cl es
29
In 2011, the highest places of the country distribution ranking list (China, USA, and India) did not show significant variations. In 2011, India occupies the first place with 39 published papers that represented 17% of the total sample size, China with 31 papers (13%) and USA with 22 papers (10%). Greece who during 2010 occupied the 7Th place in the ranking list, dropped to the 23rd place in 2011. This abrupt fall has a potential explanation due to the economic Greek crisis that started by the end of 2009.
At this point of the study, it is possible to state that during both years it was clear that China, India, USA, Sweden and UK were the top five countries that contributed the most with submitting papers to international Quality journals. A deeper study these countries will be made further in section “4.1.7 Top five countries and its Economic sectors trends”.
Figure 5. International paper’s distribution by country (2011)
During both years the participation of North American continent in quality international journals oscillated within 14.8% and 11.6% compared with the rest of continents. That percentage is mainly because of the contribution of academic research papers submitted by authors in USA and Canada.
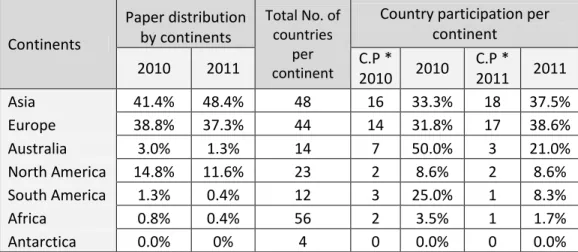
From table 2, it is possible to see that North American continent is made up by 23 countries, from which the same two countries (USA and Canada) along 2010 and 2011 submitted papers. This meant that only 8.6% of countries out of the total of 23 countries that make up North America participated in the study sample, showing a low participation of North American countries in the total participation of the continent.
The low percentages may have its explanation in the fact that North America only has 2 developed countries versus 21 developing countries. From here it is possible to state that Quality academic research efforts in North America have not been distributed
0 5 10 15 20 25 30 35 40 45 India China USA Sw ed en Spa in UK M ala ys ia It aly Por tu ga l G er ma ny Iran Sou th K or ea Ca na da Finla nd N ew Z ea la nd Tur ke y Is ra el Jap an Pa kis ta n Sult . o f O m an N et he rla nds Egy pt G reec e Po la nd Se rbia Be lg ium Cr oa tia Slo ve nia N or w ay A us tr alia U ni. A ra b Em ir Sr i L anka A rg ent ina Tha ila nd Fr an ce Cy pr us Jor da n Tunis ia Fa ro e I sla nds Sing apo re N o. o f a rt ic ke s
30
homogeneously among all its countries, but concentrated in just two of them, USA and Canada, which are the highest developed economies of the continent.
For Europe, 14 and 17 out of 44 countries that compose the whole continent, submitted quality related academic articles during 2010 and 2011 respectively. Those 14 and 17 European countries constituted the 31.8% and 38.6% of the total European countries within the continent. About Asia, the continent is set up by 48 countries, from which 16 and 18 countries participated by submitting papers to international quality journals. This represented a participation of 33.3% and 37.5% (during 2010 and 2011) of the total number of Asiatic countries.
In Table 1, also indicates that even North America occupies the third place in paper distribution by continent, it does not have a high position in the ranking when it comes it to country participation per continent. North America is in fifth place after Asia, Europe, Australia and South America, which shows that in these continents in contrast to North America, quality research is not monopolized by a minority of countries but many of their countries are involved in it.
It is worth to mention that the percentage of countries participation within each continent does not mean that the weighted participation of each country is the same. This percentage simply gives information about the number of countries participating within each continent in international quality journals.
Continents Paper distribution by continents Total No. of countries per continent
Country participation per continent 2010 2011 C.P * 2010 2010 C.P * 2011 2011 Asia 41.4% 48.4% 48 16 33.3% 18 37.5% Europe 38.8% 37.3% 44 14 31.8% 17 38.6% Australia 3.0% 1.3% 14 7 50.0% 3 21.0% North America 14.8% 11.6% 23 2 8.6% 2 8.6% South America 1.3% 0.4% 12 3 25.0% 1 8.3% Africa 0.8% 0.4% 56 2 3.5% 1 1.7% Antarctica 0.0% 0% 4 0 0.0% 0 0.0%
C.P*: No. of Countries participating within a continent, during a specific year.
31
4.1.4 Distribution of journal’s research papers by research methodology distribution
By far combined methods were the main methodology used by authors with a 63.3% (2010) and 69.2 % (2011). Combined methods research involves the use of more than one method, usually a combination of qualitative and quantitative methods. In second place, case study with 18.1% (2010) and 14.7% (2011). Literature review, conceptual method, mathematical modeling have weak participation on the distribution, nevertheless, simulation modeling is the research method with the lowest application by the authors.
Figure 6. Paper distribution by method (2010) Figure 7. Paper distribution by method (2011)
4.1.5 Distribution of journal’s research papers by economic sector (according to ownership)
As seen on figures 8 and 9, during 2010 and 2011, 63.6% and 54.5% of the published papers were involved in research related to companies from the private sector. 25.4% and 37.5% of the papers took part in organizations belonging to both public and private sectors. The smallest participation of the papers was from public and social sectors. Regarding the public sector, 9.7% of the quality papers in 2010 and 7.6% in 2011 were carried out within state or public institutions. Regarding the social sector, 1.3% (2010) and 0.4% (2011) of the quality papers corresponded to studies performed within this sector.
6.3% 18.1%
63.3% 3.8% 7.2% 1.3%
Paper's distribution by Research Methodology 2010
Literature Review Case Study
Combined Research Methods Mathematical Modeling Conceptual Method Simulation Modeling 9.4% 14.7% 69.2% 3.1% 3.6%
Paper's distribution by Reserach Methodology 2011
Literature Review Case Study
Combined Research Methods Mathematical Modeling Conceptual Method
32
During the two years, it is quite evident the strong influence of research to be carried out within the private sector, as well as the combination of public and private sector in the same research papers.
Figure 8. Paper distribution by Economic Figure 9. Paper distribution by Economic
sector ownership 2010 sector ownership (2011)
4.1.6 Distribution of journal’s research papers by main economic sectors
This subsection will answer the following research question:
RQ3: Which economic sectors have been researched more intensively in academic
papers published in international Quality journals over the past two years?
In this section papers will be divided into Manufacturing, Services, Building and Construction, Education, Manufacturing/Services, Health Care and others.
As seen in figures 10 and 11, manufacturing sector occupies the first place in international quality papers during 2010 (38.8%) and the second place in 2011 with 33.5%. About service sector it is worth to mention that analyzing economic sectors in a more detailed level, percentages from education and health care sectors (which are services as well) are being considered part of service sector data. In this order of ideas, it is possible to state that research in service sector was found in 26.6% of articles in international Quality journals during 2010 and 47.8% during 2011, when it occupied the first place.
There was found a sharp rise in the service sector of 79.6% from 2010 to 2011, versus a decrease of 13,6% in manufacturing sector during the same period of time.
63.6% 25.4%
9.7% 1.3%
Paper's distribution by economic sector ownership 2010
Private Public/Private Public Social
54.5% 37.5%
7.6% 0.4%
Paper's distribution by economic sector ownership 2011
33
On the third place, “manufacturing /services” constituted a category for those academic papers that involved both service and manufacturing industries within its researchers. Paper that combined manufacturing/services sector within its research went from 30% (2010) to 17.4% (2011), which signified a drop of 42% for this mixed sector
Figure 10. International Journal distribution by economic sector (2010)
Figure 11. International Journal distribution by economic sector (2011)
An interesting finding was a sharp rise of 952% in academic Quality papers related to health care sector. This sector went from having a 1.7% paper related to health care in 2010 to 17.95% in 2011. The percentage of growth of health care related papers may signify a potential trend of Quality researchers towards Quality in this particular sector.
In contrast to the surprising findings on health care sector, education sector did not represent a significant variation. 5.1% of papers were related to education in 2010 and 4.9% in 2011. This meant a decreasing in just 3.9% between the two years.
30.0%
19.8% 38.8%
1.7% 5.1% 1.3% 3.4%
Paper distribution by Economic Sector 2010
Manufacturing/Services Services Manufacturing Health Care Education Others
Building and Construction
17.9%
25.0% 33.5%
17.4%
4.9% 1.3%
Paper distribution by economic sector (2011)
Health Care Services Manufacturing Manufacturing/Services Education Others
34
4.1.7 Top five countries and its economic sectors trends
From precedent subsections “4.1.3 Distribution of journal’s research papers by country”, it was clear that China, India, USA, Sweden and UK were the top five countries that contributed the most with submitting papers to quality journals.
Table 2, presents detailed information of the research carried in top 5 countries and its participation for each economic sector. For methodological purposes, percentages were given in a detailed level (within the country) and in more general level (between countries). In a detailed level, W.C (within the country) means the percentage of papers researching a specific sector in a country, with respect to the sum of papers published by that country in all the economic sectors. In a more general level, B.C (between countries) means the percentage of papers doing research at a specific sector in a country, with respect to the total number of papers doing research in the same economic sector in all the top 5 countries.
According to a W.C percentages shows that China is presenting a trend towards services. Services sector in China accounts for a 40% (including education and health care) versus a 30% belonging to manufacturing sectors. The domination of the service related research in academic quality papers was unexpected due to China has been known throughout the years by its marked participation on manufacturing worldwide and by having increasing its manufacturing capacity significantly in the last 10 years.
Main Economic Sectors studied in International Journals for Top 5 Countries
Sector Total of papers China India USA Sweden UK
No. % No. % No. % No. % No. %
Manufacturing 101 W.C 20 30% 42 66% 20 39% 11 32% 8 25% B.C 20% 42% 20% 11% 8% Health Care 16 W.C 2 3% 0 0% 7 14% 6 18% 1 3% B.C 13% 0% 44% 38% 6% Services 48 W.C 24 36% 7 11% 8 16% 5 15% 4 13% B.C 50% 15% 17% 10% 8% Manufacturing/ Services 63 W.C B.C 18 27% 29% 10 15% 16% 11 22% 17% 8 24% 13% 16 50% 25% Education 12 W.C 1 1% 5 8% 3 6% 1 3% 2 6% B.C 8% 42% 25% 8% 17% Building and Construction 8 W.C 2 3% 0 0% 2 4% 3 9% 1 3% B.C 25% 0% 25% 38% 13% 248 67 64 51 34 32 W.C : Within countries B.C: Between top 5 countries