Contents lists available atScienceDirect
Gait & Posture
journal homepage:www.elsevier.com/locate/gaitpost
Full length article
Validity and reliability of an iPad with a three-dimensional camera for
posture imaging
☆
A. Agustsson
a,⁎, MK. Gislason
b, P. Ingvarsson
c,d, E. Rodby-Bousquet
e,f, Th. Sveinsson
aaSchool of Health Sciences, Research Centre of Movement Science, University of Iceland, Reykjavík, Iceland bSchool of Science and Engineering, Biomedical Engineering, Reykjavik University, Reykjavík, Iceland
cDepartment of Rehabilitation Medicine, Landspitali - The National University Hospital of Iceland, Reykjavík, Iceland dMedical Faculty, The University of Iceland, Reykjavík, Iceland
eCentre for Clinical Research, Uppsala University, Region Västmanland, Västerås, Sweden fDepartment of Clinical Sciences Lund, Division of Orthopaedics, Lund University, Lund, Sweden
A R T I C L E I N F O Keywords: Cerebral palsy Posture Windswept hip Scoliosis Surface topography A B S T R A C T
Background: It is important to quantify a static posture to evaluate the need for and effectiveness of interventions such as physical management, physiotherapy, spinal orthosis or surgical treatment on the alignment of body segments. Motion analysis systems can be used for this purpose, but they are expensive, require a high degree of technical experience and are not easily accessible. A simpler method is needed to quantify static posture. Research objective: Assess validity and inter and intra rater reliability using an iPad with a 3-D camera to evaluate posture and postural deformity.
Method: A 3-D model of a lying posture, created using an iPad with a 3-D camera, was compared to a Qualisys motion analysis system of the same lying posture, the latter used as the gold standard. Markers on the trunk and the leg were captured by both systems, and results from distance and angle measurements were compared. Results: All intra-class correlation coefficient values were above 0.98, the highest systematic error was 4.3 mm for length measurements and 0.2° for angle measurements. Significance: A 3-D model of a person, with markers on anatomical landmarks, created with an iPad with a 3-D camera, is a valid and reliable method of quantifying static posture.
Conclusion: An iPad with a 3-D camera is a relatively inexpensive, valid and reliable method to quantify static posture in a clinical environment.
1. Introduction
Posture refers to the position and shape that the body adopts when it is relaxed or during activities.“Good” posture is generally perceived as one that is erect and symmetrically aligned, but it is more accurately defined as a posture that facilitates effective energy conserving function without damaging the body [1]. Posture can have a huge impact on health, as it is potentially damaging to the body system. Any posture, adopted for sustained periods, will put some tissue under stress leading to tissue adaptation, and ultimately contracture and deformity. In in-dividuals with cerebral palsy and lower levels of motor function, pos-tural asymmetries are frequently observed and these asymmetries are associated with secondary complications such as limited range of mo-tion, and scoliosis [2].
The importance of quantifying posture in health and in disease, has been highlighted by several authors [3]. This is required to evaluate the effectiveness of interventions such as physical management, phy-siotherapy, spinal orthosis or surgical treatment on the alignment of body segments. In order to quantify posture in supine- prone- or side-lying, a reference posture is needed. Usually the anatomical position is considered as neutral (zero-positions) when standing straight with arms by side, thumbs directed forwards, the functional longitudinal axes of the feet parallel and separated by a space equal to the distance between the hips, and the gaze directed forwards and horizontally [4].
In practice, measuring people with deformity and/or displaced body parts in the lying position, such as scoliosis and windswept hips, is not easy to perform with accuracy. This is due to difficulties in identifying the normal anatomical points in the person with significant deformity
https://doi.org/10.1016/j.gaitpost.2018.12.018
Received 16 September 2018; Received in revised form 19 November 2018; Accepted 13 December 2018
☆This study focuses on the validity and reliability of the use of an iPad with 3-D camera, to evaluate posture in a quantifying way. ⁎Corresponding author.
E-mail addresses:atli@hi.is(A. Agustsson),magnuskg@ru.is(M. Gislason),palling@landspitali.is(P. Ingvarsson),
elisabet.rodby_bousquet@med.lu.se(E. Rodby-Bousquet),thorasve@hi.is(T. Sveinsson).
0966-6362/ © 2018 The Authors. Published by Elsevier B.V. This is an open access article under the CC BY-NC-ND license (http://creativecommons.org/licenses/BY-NC-ND/4.0/).
body surface landmarks in the frontal plane, expressing rotational and lateralflexion angles between the upper and the lower thorax and be-tween the lower thorax and pelvis. This method is too complicated for use in the clinical environment, as accuracy depends on the camera’s resolution, distance to the imaging volume, camera separation and quality of calibration. Total body exposure is not possible with high image resolution and the process involves complex calculation of direct linear transformation parameters [7], which reflects the relationship between the 3-D coordinates of the calibrated volume and the 2D co-ordinate of the markers within the lens of each camera.
Few years ago, Occipital Inc (USA) made available 3-D scanner (Structure Sensor) that uses a grid of laser to generate a 3-D image of a stationary object within the visualfield. This has been marketed as a “3-D camera for iPad”. iPad with a 3-“3-D camera is a handheld system that digitally maps the environment (surface topography). The system has the potential to be ideal for the use in clinical environments as the iPad with the 3-D camera does not need any calibration and is designed to be moved around while capturing surface topography. The purpose of the present study was to assess validity, and inter and intra rater reliability, in the use of iPad with a 3-D camera to evaluate posture and postural deformity, for use in the clinical environment.
2. Methods
2.1. Participants
Seven healthy adult volunteers were recruited among colleagues and friends to test validity and reliability of a new method used to evaluate posture and postural deformity. Thefirst participant was used as a pilot to identify landmarks and reference points in two different postures. For the remaining six participants the measuring protocol included four supine postures, starting with supine lying in neutral zero-position; bent hips and knees in the second posture; progressing to an imitated windswept posture in the third and adding scoliosis to the imitated windswept hip deformity in the fourth measurement.
2.2. Instrumentation
The new system consists of a 3-D camera (Structure Sensor, Occipital Inc, USA), integrated with 4th generation version of iPad (Apple, USA), an iPad app (Structure, Occipital Inc, USA) and two computer software Skanect (Occipital Inc, USA) and Cloud Compare (CloudCompare v2.9.1 software, http://www.cloudcompare.org) on a PC computer. The 3-D camera resolution is 320 × 240 pixels (QVGA), sampling at 60 Hz with a precision of 0.5 mm at 400 mm distance from the iPad to the subject. As a gold standard for validation, an 8-camera three-dimensional Qualisys Oqus 300 motion capture system (Qualisys AB, Sweden) and computer software (Qualisys track manager (QTM) Qualisys AB, Sweden) simultaneously recorded markers position, was used for comparison. Qualisys system resolution was 1280 × 1024 pixels sampling at 200 Hz with a precision of ± 1 mm inside the cali-brated volume.
to orient the 3-D camera to capture those markers. However, longer exposure time tends to lead to bigger out of shape marker in the 3-D model.
The 3-D coordinates of the following anatomical landmarks were used to evaluate the orientation of the upper trunk, the lower trunk and the pelvis: right and left: coracoid process, costal margin around the 10th rib and anterior superior iliac spine (ASIS) [1,6]. The x-axis within the local frame was defined as the direction from posterior to anterior when a participant was lying in a supine position, the y-axis was the distal to proximal direction and the z-axis was from medial to lateral (left to right direction).
For the upper trunk local frame, the z-axis was defined as the nor-malized vector between the left and right coracoid process markers. For the lower trunk local frame, the z-axis was defined as the normalized vector between the left and right lower rib markers. For both the upper trunk and lower trunk local frames, the temporary y-axis was defined as the normalized vector between the shoulder markers and the mid-rib markers. For pelvis local frame, the z-axis was defined as the nor-malized vector between the left and right ASIS markers; the temporary y-axis was defined as the normalized vector between the mid-rib mar-kers and the mid-pelvis marmar-kers. For all three local frames (upper trunk, lower trunk and pelvis), the x-axis was defined by the cross product of the temporary y-axis and the z-axis, and thefinal y-axis was then de-fined by the cross product of the x-axis and the z-axis.
Trunk symmetry [1] measures for quantifying scoliosis, is a stan-dardized measurement in the Swedish national surveillance program and quality registry for cerebral palsy (CPUP) [8], by measuring dis-tance, vertically and diagonally, between the coracoid processes and the ASIS.
The 3-D coordinates of following anatomical landmarks were used for evaluating the orientation of left thigh and shank: the greater tro-chanter, the lateral and medial epicondyle of the femur, the lateral and medial malleolus. For thigh local frame, the z-axis was defined as the normalized vector between the lateral and medial epicondyle markers. The temporary y-axis was defined as the normalized vector between the greater trochanter marker and the lateral epicondyle marker, and the x-axis was defined by the cross product of the temporary y-x-axis and the z-axis. Thefinal y-axis was then defined by the cross product between the x-axis and the z-axis. For shank local frame, the z-axis was defined as the normalized vector between the lateral and medial malleolus mar-kers. The y-axis was defined as the normalized vector between the lateral epicondyle marker and the lateral malleolus marker. The x-axis was defined by the cross product of the y-axis and the z-axis. 2.4. Protocol
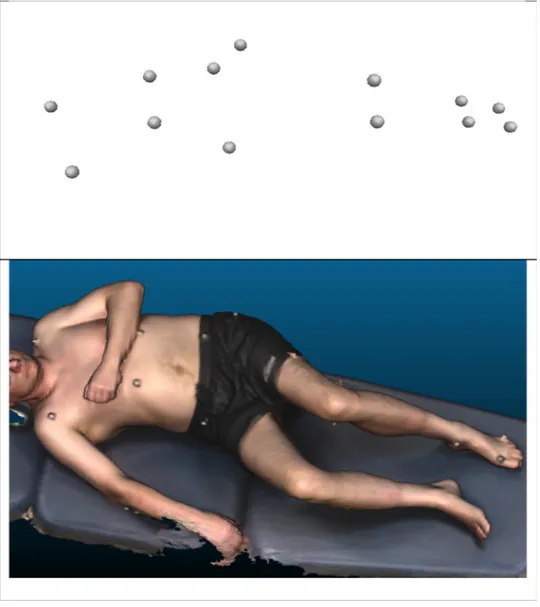
Each participant lay supine on a plinth. The measurements were taken at the movement analysis laboratory by the same experienced physiotherapist and biomedical engineer. Although the recording time was different, five seconds for the Qualisys and more than a minute for the iPad, both systems started recording participants simultaneously. The output from the two systems have different formats, the Qualisys system output are markers location in 3-D space while the iPad systems
output is a 3-D model of the individual posture (Fig. 1).
During the iPad 3-D scanning, the iPad with the 3-D camera, was hand-held and carried two times around the plinth as a surface topo-graphy of the participant lying in supine appeared on the iPad screen. The distance from the iPad to the participant varied within every ses-sion, between 400 mm to 1000 mm. The recording time was about 1 min. The surface topography was simultaneously streamed into the Skanect software on a PC computer, via Wi-Fi uplink, for storage. During post processing in the Skanect software was the surface topo-graphy reconstructed and fused into a 3-D model and exported on a PLY format. The PLY file was opened in CloudCompare v2.9.1 software, (http://www.cloudcompare.org) where the markers were identified and its position in 3-D space manually digitised on the surface of every marker and exported as an ASCIIfile.
The Qualisys Oqus 300 captured the markers position in 3-D space and the QTM digitised the markers position in the centre of each of the marker. Recording time 5 s. During post processing in QTM markers in every posture (session) were manually identified and each session was exported on a C3D format (https://www.c3d.org/). Both the manual identification of markers in the QTM and the manually digitisation of markers in the Cloud Compare software, are the most critical factors to accurately determine the markers location.
2.5. Data analysis
Matlab (Version R2017b, Mathworks Inc, Natick, USA) script cal-culated trunk and knee angles (degrees) and trunk symmetry lengths (mm) from data in the C3D and ASCIIfiles. One frame, frame 100 in the C3Dfile, was used in the calculation. Three-dimensional coordinate systems were created for each segment based on the marker position. Unit direction vectors of each segment were placed into a matrix re-presenting a three-dimensional rotation matrix for each segment. The rotation matrix was a 3 × 3 matrix on the form
= ⎡ ⎣ ⎢ ⎢ ⎤ ⎦ ⎥ ⎥ R R R R R R R R R R 11 12 13 21 22 23 31 32 33
The rotation of each segment was calculated using the formula
⎜ ⎟ = ⎛ ⎝ ⎞ ⎠ − φ R R tan 1 21 11 = ⎛ ⎝ ⎜ − + ⎞ ⎠ ⎟ − θ R R R tan 1 31 112 212 ⎜ ⎟ = ⎛ ⎝ ⎞ ⎠ − ψ R R tan 1 32 33
theoretically be between minus 4 mm to plus 4 mm, and thus ± 8 mm for calculation of a length between two markers. The Qualisys system digitizes in the centre of the marker while the iPad system digitises on the marker surface. Criterion related validity was established using the Qualisys system as gold standard, evaluated as concurrent validity since they were measured at the same time. The evaluation of intra-rater reliability was based on data from three repeated measurements when digitising the markers of the same 3-D model in the CloudCompare software by the same physiotherapist. The analysis of inter-rater relia-bility was based on data from three experienced physiotherapists, who digitised the markers in the CloudCompare software, for each mea-surement. A limits of agreement plot (Excel, Microsoft, USA) was used to evaluate bias between the mean differences of the measurements and to estimate the agreement interval, within which 95% of the differences of the mean lie. Mixed model ANOVA SAS 9.4 (SAS Institute Inc, USA) was used to evaluate the effects of the mean differences of the mea-surements, i.e. the systematic error and its significance level, and to calculate the intraclass correlation coefficient (ICC(2,k) and ICC(3,k) [9] together with the standard error of measurement (SEM).
3. Results
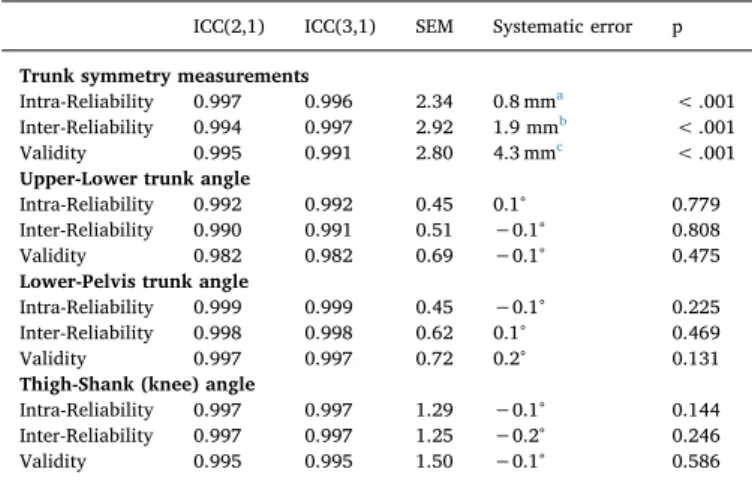
The seven volunteers, aged 20–57 years (4 females, 3 males), gen-erated a total of 26 measurements of supine postures. Four of these measurements had missing markers in the Qualisys system data and were not included in the analysis, leaving 22 complete measurements. Table 1 shows the parameters of the intra-rater and inter-rater reli-abilities (ICC, SEM and systemic error) for four selected measurements using the iPad system, as well as the validity parameters (iPad - Qua-lisys comparison). These four measurements are the length measure-ments (Fig. 2), Upper-Lower trunk angles (Fig. 3), Lower-Pelvis angles (Fig. 4) and knee angles (Fig. 5).
All ICCs were above 0.98. SEM for the length measurements was lowest for intra-rater reliability, 2.3 mm, and slightly higher for the inter-rater and validity comparisons. Systematic error was 4.3 mm for the validity comparison but less than half of that for the reliability comparisons. For the three angle measurements, SEM were less than 1° for Upper-Lower and Lower-Pelvis angles and 1.5° or less for knee an-gles. Systematic error was 0.2° or less and non-significant in all ana-lyses.
4. Discussion
The aim of this study was to assess intra- and inter-rater reliability and validity in the use of an iPad with a 3-D camera to evaluate posture and postural deformity. Our results show that, in quantifying posture, there is a high correlation between the outcome from iPad with a 3-D camera and the Qualisys system. The result thus clearly indicates that the use of iPad with 3-D camera can be used in clinical environments, with sufficient accuracy for quantified evaluation of posture and pos-tural deformity. There is no need for calibration of the volume when using 3-D camera and iPad and total body 3-D models are readily analysed. Furthermore, 3-D models of an individual can be saved for
reference later. The intraclass correlation coefficient (ICC) (Table 1-4) indicates excellent assessment of accuracy and consistency, both be-tween the Qualisys system and the iPad system (validity), and the intra-and inter-rater reliability. ICC values from 0.98 indicate that there is an excellent reproducibility by the iPad system.
Cerebral palsy is a well-recognised neurodevelopmental condition that manifests in early childhood and persists throughout life [10]. It is the most common physical disability in childhood, with a prevalence of 2.0–2.4/1000 live births in Europe [11,12]. Although the need for quantification is common to a wide range of diseases and types of disability, it is especially valid in cerebral palsy due to the frequent occurrence of postural deformities. Even though the main objective of this study is to compare the accuracy and correlations between two methods quantifying posture in general, the test positions were parti-cularly chosen with some of the most common postural problems of cerebral palsy in mind.
The difference in right and left vertical length, in the trunk sym-metry measurement, indicates the degree of asymsym-metry in lateral flexion, whereas the difference in the right and left diagonal length indicates the degree of asymmetry in rotation of the trunk. Using sur-face topography reconstructed by iPad, the shortest distance between landmarks is automatically selected,filtering out error effect from the body itself, that will affect the measurement when using a standard measuring tape. The systemic error is less than 2 mm when assessing the reliability and is smaller than SEM (Fig. 2) indicating good precision of the system. In the validity measurement, the mean difference is 4.3 mm indicating that the output from the two systems, iPad with 3-D camera and Qualisys, are not too different. The reason for this differ-ence arises from the systematic digitizing bias between the two systems, as they localize differently the reference point on the marker (see the method section for further details).
The conventional method to evaluate posture is to measure the joint angles of the human body [4] with a goniometer. The results from these conventional methods of measuring joint angles and calculating 3-D joint angles are usually not the same, due to different local frames of reference and the effect from the order of rotation in 3-D angle calcu-lation [13]. In all angular measurements, the difference of mean
Validity 0.997 0.997 0.72 0.2° 0.131
Thigh-Shank (knee) angle
Intra-Reliability 0.997 0.997 1.29 −0.1° 0.144
Inter-Reliability 0.997 0.997 1.25 −0.2° 0.246
Validity 0.995 0.995 1.50 −0.1° 0.586
All trunk symmetry measurements are pooled together, all Thorax upper-lower angles are pooled together, all Thorax lower-pelvis angles are pooled together and all thigh-shank angles are pooled together.
a The systematic error is the average difference between the first and the
second measurement and thefirst and the third measurement of the 3-D models.
b The systematic error is the average difference between Rater 1 and Rater 2,
Rater 1 and Rater 3 and Rater 1 and Rater 4, measurement of the 3-D models.
c The systematic error is the difference between Qualisys system
between the gold standard (Qualisys) and the new iPad system, was negligent (Fig. 3–5). Each local reference segment, constructed from three markers on each segment, filters out the effect from the
discrepancy of individual marker location, during angle calculation. In both trunk angle measurements, the SEM of the difference was lowest during intra-rater reliability test and highest during the validity test.
Fig. 2. Distances between: right coracoid process and right ASIS■, right coracoid process and left ASIS▲, left coracoid process and left ASIS •, left coracoid process and right ASIS♦. a) Intra-rater reliability (difference in length measurement between the first and the second measurement and the first and the third measurement of the IPads 3-D models, pooled in the graph); b) Inter-Rater reliability (difference in length measurement between Rater 1 and Rater 2, Rater 1 and Rater 3 and Rater 1 and Rater 4, of the IPads 3-D models, pooled in the graph); c) Validity (the difference of length measuremetns between the IPads 3-D model measurement and the Qualisys system measurement). Solid line shows the mean difference for the pooled data. Dashed lines show the 95% upper and lower limits of agreement re-presenting two standard deviations above and below the mean difference.
Fig. 3. Thorax Upper-Lower angles. Pooled angles: Flexion / Extension■, Lateral flexion▲, Rotation •. a) SeeFig. 2a for further explanation; b) SeeFig. 2b for further explanation; c) Validity. The difference of calculated Upper-Lower angles between the IPads 3-D model measurement and the Qualisys system measurement. SeeFig. 2c for further explanation.
Fig. 4. Thorax Upper-Lower angles. Pooled angles: Flexion / Extension■, Lateral flexion ▲, Rotation •. a) SeeFig. 2a for further explanation; b) SeeFig. 2b for further explanation; c) SeeFig. 3c for further explanation.
Fig. 5. Knee angles. Pooled angles: Flexion / Extension■, Lateral flexion ▲, Rotation •. a). SeeFig. 2a for further explanation; b) SeeFig. 2b for further explanation; c) SeeFig. 3c for further explanation.
the clinical environment, any type of marker that is not reflective will hold its form during the surface topography. Markers that are not out of shape will lessen the digitizing error and smaller digitizing error would lead to similar reliability (SEM) in the knee angles as is in the trunk angles. This study suggests that the ideal marker for an iPad with 3-D camera postural evaluation would be a half spherical with a checker-board pattern, in order to pinpoint accurate digitization.
A limitation of this study lies in the use of healthy subjects to evaluate the validity and reliability of the method for quantifying posture proposed for use with motor impairments such as CP. However, a 3-D model of an individual (Fig. 1), for evaluating posture and pos-tural deformity, depends on visibility of anatomical landmarks, not on being able or disabled. There is no reason to expect that the validity and reliability of a 3-D model, differ between individuals with or without motor impairments. However, subjects unable to stay still while con-structing surface topography are not candidates for this type of static posture evaluation.
5. Conclusion
The use of an iPad with a 3-D camera to evaluate posture and postural deformity shows a high correlation and good validity with the output from the Qualisys system, along with high intra- and inter-rater reliability. The results clearly indicate that the use of iPad with 3-D camera can be used in the clinical environment, with good accuracy, for evaluating posture and postural deformity.
Conflict of interest
The authors report no conflict of interest. The authors alone are responsible for the content and writing of the paper and the manuscript is not under consideration for publication elsewhere.
Acknowledgement
We thank Mrs. Pauline Pope for her advices and the independent raters for their contribution.
References
[1] P. Pope, Severe and Complex Neurological Disability : Management of the Physical Condition, 1 ed., Butterworth-Heinemann/Elsevier, Edinburgh, 2007.
[2] E. Rodby-Bousquet, T. Czuba, G. Hägglund, L. Westbom, Postural asymmetries in young adults with cerebral palsy, Dev. Med. Child Neurol. 55 (2013) 1009–1015. [3] C. Fortin, D.E. Feldman, F. Cheriet, H. Labelle, Clinical methods for quantifying
body segment posture: a literature review, Disabil. Rehabil. 33 (2011) 367–383. [4] C. Heck, I. Hendryson, C. Rowe, Joint Motion Method of Measuring and Recording,
American Academy of Orthopaedic Surgeons, 1965.
[5] B.M. Nigg, G.K. Cole, Measuring Techniques: Optical Methods in Biomechanics of the Musculo-skeletal System, John Wiley & Sons Ltd., 1994.
[6] H. Sato, M. Kondo, I. Ojima, H. Fukasawa, S. Higuchi, Trunk deformity evaluation based on 3D measurements of front body surface landmarks in people with severe physical disabilities, Dev. Neurorehabil. 20 (2017) 280–286.
[7] Y.I. Abdel-Aziz, H.M. Karara, Direct linear transformation from comparator co-ordinates into object space coco-ordinates in close-range photogrammetry, Photogramm. Eng. Remote Sens. 81 (2015) 103–107.
[8] A.I. Alriksson-Schmidt, M. Arner, L. Westbom, L. Krumlinde-Sundholm, E. Nordmark, E. Rodby-Bousquet, et al., A combined surveillance program and quality register improves management of childhood disability, Disabil. Rehabil. 39 (2017) 830–836.
[9] K.O. McGraw, S.P. Wong, Forming inferences about some intraclass correlations coefficients, Psychol. Methods 1 (1996) 30–46.
[10] P. Rosenbaum, N. Paneth, A. Leviton, M. Goldstein, M. Bax, D. Damiano, et al., A report: the definition and classification of cerebral palsy April 2006, Dev. Med. Child Neurol. Suppl. (109) (2007) 8–14.
[11] E. Nordmark, G. Hägglund, J. Lagergren, Cerebral palsy in southern Sweden I. Prevalence and clinical features, Acta Paediatr. 90 (2001) 1271–1276.
[12] SCPE, Prevalence and characteristics of children with cerebral palsy in Europe, Dev. Med. Child Neurol. 44 (2002) 633–640.
[13] D.A. Winter, Biomechanics and Motor Control of Human Movement, 3rd ed., John Wiley & Sons, Hoboken, New Jersey, 2005.
[14] D.C. Boone, S.P. Azen, C.M. Lin, C. Spence, C. Baron, L. Lee, Reliability of gonio-metric measurements, Phys. Ther. 58 (1978) 1355–1360.