http://www.diva-portal.org
Postprint
This is the accepted version of a paper published in Materials Characterization. This paper has been peer-reviewed but does not include the final publisher proof-corrections or journal pagination.
Citation for the original published paper (version of record):
Kasvayee, K A., Ghassemali, E., Salomonsson, K., Sujakhu, S., Castagne, S. et al. (2018) Microstructural strain mapping during in-situ cyclic testing of ductile iron
Materials Characterization, 140: 333-339 https://doi.org/10.1016/j.matchar.2018.04.017
Access to the published version may require subscription. N.B. When citing this work, cite the original published paper.
Permanent link to this version:
Microstructural strain mapping during
in-situ cyclic testing of ductile iron
Keivan A. Kasvayee1,a, Ehsan Ghassemali1, Kent Salomonsson1, Surendra Sujakhu2, Sylvie Castagne3,4, Anders
E. W. Jarfors1
1School of Engineering, Jönköping University, Box 1026, 551 11 Jönköping, Sweden
2Nanyang Technological University, School of Mechanical and Aerospace Engineering, 50 Nanyang Avenue,
Singapore 639798
3KU Leuven, Department of Mechanical Engineering, Celestijnenlaan 300 - box 2420, 3001 Leuven, Belgium 4Member Flanders Make, Leuven, Belgium
aCorresponding author email: Keivan.Amiri-Kasvayee@jth.hj.se
Abstract
This paper focuses on local strain distribution in the microstructure of high silicon ductile iron during cyclic loading. In-situ cyclic test was performed on compact-tension (CT) samples inside the scanning electron microscope (SEM) to record the whole deformation and obtain micrographs for microstructural strain measurement by means of digital image correlation (DIC) technique. Focused ion beam (FIB) milling was used to generate speckle patterns necessary for DIC measurement. The equivalent Von Mises strain distribution was measured in the microstructure at the maximum applied load. The results revealed a heterogenous strain distribution at the microstructural level with higher strain gradients close to the notch of the CT sample and accumulated strain bands between graphite particles. Local strain ahead of the early initiated micro-cracks was quantitively measured, showing high strain localization, which decreased by moving away from the micro-crack tip. It could be observed that the peak of strain in the field of view was not necessarily located ahead of the micro-cracks tip which could be because of the (i) strain relaxation due to the presence of other micro-cracks and/or (ii) presence of subsurface microstructural features such as graphite particles that influenced the strain concentration on the surface.
Keywords: Spherical graphite iron; FIB_DIC; Micro-crack; Digital image correlation; Fatigue.
1 Introduction
The influence of the microstructure constitutes on the variation of the mechanical properties is one of the main subjects in the design process of the cast components that are produced from ductile iron [1]. Ductile iron has been widely used in many industrial applications (e.g. gearboxes, crankshafts) mainly due to its relatively low cost and excellent castability [2]. Ductile iron is a multiphase material containing graphite particles as secondary phases (7-15 Vol.%) in the matrix. High silicon ductile iron is an alloy of ductile iron with the silicon content around 4 wt.% [3]. The metal matrix of this material is mainly ferritic. This alloy is being used in many engineering applications because of its excellent machinability and higher fatigue strength [4, 5]. Ductile iron shows specific behavior during loading and fracture (e.g. steady macroscopic crack propagation despite the local cleavage fractures), which is due to microstructural inhomogeneity caused by the graphite particles as a secondary phase [6, 7].
An understanding of the yielding and cracking behavior at the micro-scale is crucial for designing more durable materials [8, 9]. Crack initiation and propagation in the microstructure of ductile iron has been well investigated by using in-situ testing [6]. Depending on the loading conditions, different micromechanisms are responsible for the failure. Under monotonic tension loading, voids form due to graphite-matrix decohesion with subsequent micro-crack initiation and growth inside and around the graphite particles [10, 11]. This occurs at the stress levels close to the macroscopic yield point, in which a kink occurs in the tensile stress-strain response [12]. Eventually, macrocracks form because of coalescence of micro-cracks that link the adjacent voids [13]. Zybell et al.[14] recorded the crack propagation during cyclic loading by performing an in-situ fatigue test under an optical imaging system. During the cyclic loading, early micro-cracks originated from the voids that were formed from decohesion of the degenerated graphite particles and also from the shrinkage porosities. Micro-cracks propagate by partial debonding of most of the spheroidal graphite particles along the crack path to failure [15]. The iron matrix microstructure (ferritic, pearlitic or ferritic-pearlitic)[16] and the graphite morphology [17] can affect the crack propagation rate, so that some micro-cracks are arrested during the fatigue loading in the ferritic-pearlitic interface [18]. Verdu et al. [19] studied the early stages of fatigue crack nucleation and growth using synchrotron X-ray tomography, showing that the micro-cracks initiate at the graphite nodules or casting defects in the vicinity of the sample surface. However, most of the micro-cracks were arrested after their length reached the initiating defect size and did not coalesce to form short macrocracks.
It has been proven that the strain distribution in the microstructure of ductile iron is rather inhomogeneous and micro-cracks initiate at highly strained areas [20, 21]. Guillemer-Neel et al.[22] found that the Bauschinger effect in ductile iron was caused by inhomogeneous deformation between matrix and graphite particles which developed a high dislocation density originating from the local plastic deformation in the matrix close to the interface.
Digital image correlation (DIC) [23] has been used for measuring local strain distribution in the microstructure of ductile iron [24]. Fischer et al.[25] investigated the strain distribution in the microstructure of the ductile iron using 3D micro-computed tomography combined with digital image correlation. The amount of local strain was quantified showing that highly strained localized areas were favorable for crack initiation. However, the strain measurements spatial resolution in the microstructure of ductile iron needs to be improved to resolve strain in smaller regions between the graphite particles which are the critical places for crack initiation and propagation. Two dimensional (2D) DIC can be coupled with SEM imaging for micro-scale and nanoscale deformation measurement [26, 27]. In this case, one of the key challenges has been the production of the micro-scale speckle patterns which do not mask the microstructure, in order to relate the measured local strain to the microstructural features (e.g. matrix phase, grains and inclusions) [28, 29]. With an ex-situ technique, Carroll et al.[30] used SEM to capture micrographs which were analyzed with DIC to measure local strain inside the grains of steel. The speckle pattern was produced by deposition of micro particles which masked the microstructure. The DIC strain patterns were related to the microstructure by overlaying on the electron backscatter diffraction (EBSD) pattern which was taken before the deformation. Using this method, since the EBSD pattern should be taken before the deformation, it is not possible to overlay the strain patterns which are measured at the maximum cyclic load (i.e. when the crack opening distance is at its maximum during in-situ testing). Therefore, there is a need to generate micro speckle patterns that do not mask the microstructure during SEM imaging.
In a previous work [31], a developed pit etching procedure was used for generating the speckle pattern to measure strain distribution in the microstructure of ductile iron using DIC. However, the method had 2 limitations: (i) the procedure could not be applied to all types of material, (ii) the size of the speckles (pits) could not be controlled (e.g. smaller speckles are required for higher spatial resolutions). Therefore, a versatile speckle
generating method needs to be developed that enables strain measurement in the microstructure depending on the required spatial resolution. In this case, an alternative can be focus ion beam milling (FIB) for generating speckles in the microstructure. A similar method has been developed before by Korsunsky et al. [32] but for different purposes; e.g. milling surface for evaluating residual stresses.
The aim of this study is to resolve the strain distribution in the microstructure of ferritic ductile iron and quantify local strain at the onset of the early micro-cracks during cyclic loading. For this purpose, in-situ cyclic tests were performed inside the SEM using CT samples. The FIB milling method was used to produce a controlled size speckle pattern on the microstructure, which is necessary for improving the resolution of the strain measurement. The strain mapping in the microstructure was performed using the DIC technique. The localized strains were measured throughout the entire test.
2 Experimental
2.1 Material
The material used in this study was high silicon ductile iron grade GJS-500-14, cast in a 50 mm thick plate. The composition is presented in Table 1.
Table 1. Chemical composition of the cast material.
Element C Si Mg Cu Mn P S Ceq Fe
Weight percent (Wt.%) 3.20 3.71 0.042 0.05 0.18 0.01 0.006 4.15 Balance
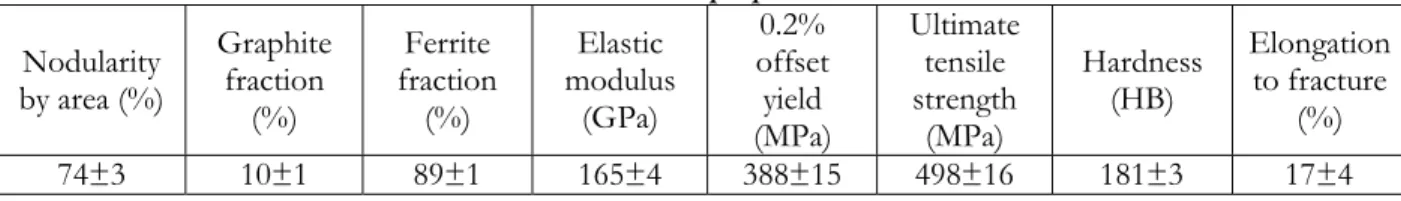
The microstructure of the material consisted of nodular and irregular shaped graphite particles in a fully ferritic matrix (see Figure 2). Table 2 presents microstructural and mechanical properties of the cast material [33].
Table 2. Microstructural characteristics and mechanical properties of the cast material. Nodularity by area (%) Graphite fraction (%) Ferrite fraction (%) Elastic modulus (GPa) 0.2% offset yield (MPa) Ultimate tensile strength (MPa) Hardness (HB) Elongation to fracture (%) 74±3 10±1 89±1 165±4 388±15 498±16 181±3 17±4
2.2 In-situ cyclic test
Figure 1(a) shows the miniature tensile/compression stage (Kammrath & Weiss) with a compact-tension (CT) sample installed for cyclic test. Figure 1(b) illustrates the dimensions of the miniature CT sample (designed and modified according to ASTM E647 [34]). The force was applied to the samples holes in the X direction. The samples were cut from the cast plate by electron discharge machining (EDM) method, using 0.3 mm wire. Samples were mechanically polished and slightly etched with 5% Nital etchant. The thickness of the samples was 1.05±0.1 mm. The notch of the samples had a round tip with the radius of 0.16 mm.
Figure 1. (a) The miniature stage used for cyclic loading. (b) Dimensions of the CT sample in mm.
2.3 FIB milling for speckle pattern generation
Focused ion beam (FIB) milling was used to produce the speckle pattern. This approach was used to provide a high level of freedom and flexibility control over the density and spatial resolution of the speckle pattern. 2500 squares (speckles) with the dimension of 1×1×1.5 μm (width×length×depth) were milled in a 300×300 μm2
area. The speckles coordinates were produced using Python coding according to a random and homogeneous Halton sequence distribution. Such a distribution and size of speckles in the mentioned area resulted in minimum speckle size of 3×3 pixels. The FIB milling was done using a moderate accelerating voltage of 15 kV and beam current of <1 nA, in order to reduce the subsurface deformation which can occur due to the high energy FIB milling. Trial measurements showed that the selected speckle depth was the minimum dimension that could provide a good contrast on the ferrite matrix. The size of field of view (FOV = 300×300 μm2) was
selected in order to enable strain measurement around and between the graphite particles. The speckle pattern was applied at two locations in each sample (see Figure 2): (i) FOV1 in the vicinity of the notch tip, to investigate the strain disruption near the notch and at the onset of the micro-cracks; (ii) FOV2 at 600 to 900 μm away from the notch, in order to investigate the strain distribution in a location further from the notch, where it was expected to comprise lower stress concentration.
Figure 2. (a) CT sample 1. The section inside the rectangle is magnified in (b) which is a panorama micrograph showing the position of two speckle patterns FOV(1) and FOV(2) (inside the squares).
2.4 Cyclic test design
Prior to the cyclic loading, monotonic tension loading up to failure was performed on several other samples which were made from the cast material. The results showed that the crack initiated (i.e. drop in force) at the notch in a critical stress intensity factor (Kc) equal to 48±1 MPa√m. The stress intensity factor (K) was
calculated for the CT samples according to ASTM E647 [34]. Thus, the cyclic tests were performed with Kmax
smaller than this value.
In-situ cyclic tests were performed on 3 samples using the stage inside the SEM (TESCAN Lyra3) at room temperature. The samples were named from 1 to 3. Cyclic tests were performed with ∆K equal to 15 MPa√m (the ∆K threshold was 13 MPa√m [35]). The load ratio (R) was 0.4 (Kmax=25 MPa√m). The speed of loading
was 0.6 Hz (20µm/s crosshead speed).
The loading stage data output was load (N) and crosshead displacement (μm). During the cyclic loading, micrographs were recorded in the secondary electron mode at every second and were combined to produce the videos of the cyclic tests (see appendix A). The cyclic test was paused at different steps at the maximum load to monitor the crack initiation and propagation and take high resolution images for DIC measurements. The images were recorded with the size of 1024×1024 pixels.
2.5 DIC
Two dimensional (2D) DIC was performed using the commercial software MatchID 2D, Version 2017.1.1 [36]. Table 3 presents the correlation parameters used for the DIC analysis.The strain distribution was measured by correlating the deformed micrographs, which were recorded during the in-situ cyclic tests, to the undeformed images in FOV(1) and FOV(2). The correlation was performed by continuously updating the reference image between deformed images and summing up the strain values at each step, to reduce the errors originating from the out-of-plane deformation that might have occurred locally in the microstructure. The measured strains were visualized by colors (64 colors) on the microstructure. Local strain ahead of the early initiated micro-crack tips were quantified by averaging strain in an area equal to the subset size, which was equal to 9×9 strain data points.
Table 3. Correlation parameters used for 2D DIC analysis
Pixel size 0.29 µm
Subset size (pixels) 13.05×13.05 µm (45×45)
Step size (pixels) 1.45 µm (5)
Correlation criterion Zero-normalized sum of squared differences [36]
Shape function Affine
Interpolation function Bi-cubic polynomial
Displacement standard deviation (pixel) 0.18 µm (0.6)[37]
Strain window size (pixels) 13.34×13.34 µm (46×46) Strain spatial resolution (pixels) 26.1×26.1 µm (90×90)
To evaluate the quality of the SEM imaging for DIC measurements, a series of 25 stationary micrographs were taken from a speckled area, before deformation. The strain standard deviation and noise was evaluated using the self-correlation method in the DIC program [38]. Here, noise was the smallest measured value associated with a change of signal, which was typically related to sensitivity of the SEM detector and digitization. The noise was measured as standard deviation of the gray level differences in the self-correlation test. The strain standard deviation is the smallest value of the measured strain that can be detected above the noise [23].
To verify the DIC measurements, SEM images were recorded from one sample speckled area. Then the sample was moved horizontally and vertically for 10, 20 and 50 μm inside the SEM. Images were recorded and analyzed to compare the translation values obtained from DIC to the amount of sample movement. To avoid thermal drifting issues, all images were taken after at least 2 min of electron beam exposure.
3 Results and discussion
3.1 Validation of DIC measurements
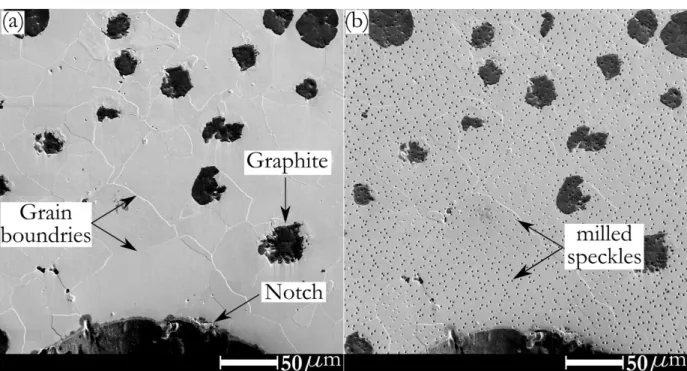
Figure 3 shows the microstructure of the material before and after applying the speckle pattern. The FIB milling provided a high contrast and random speckle pattern in the ferrite phase, suggesting that the speckle pattern could be used for DIC analysis. The speckles did not mask the microstructure which enabled the correlation of the measured DIC strains with the microstructure. However, due to lack of proper contrast for the speckles inside graphite particles, they were excluded from the DIC analysis.
It is worth mentioning that this method can be applied for generating speckles on any type of material, which implies its versatility. Furthermore, smaller speckle patterns can be milled by this method to resolve strain in smaller regions.
Figure 3. Micrograph recorded from the FOV(1) for sample 1; (a) before FIB milling ,and (b) after FIB milling. By performing a self-correlation test, an average noise level of 1.7% was measured. The displacement and strain standard deviation were ±6×10⁻² μm and ±3×10⁻⁶ (μm/μm), respectively. This marginal noise showed that the
errors related to the gray level differences were negligible.
Table 4 presents the average of translation, which was measured by DIC in the field of view, relating to the sample movement. The results showed that DIC could measure the translation with a good precision. All the DIC measurement errors were within the range of ±2 μm which was the SEM stage movement accuracy. Figure 4(a) shows the micrograph before the translation. Figure 4(b) and (c) show DIC measurements overlaid on the translated micrograph after 20 μm sample movement in X and Y direction (colors indicate the translation values), respectively. As it can be seen, the translation measurements are smooth without large gradients in the entire field of view, indicating the correct measurement without relative movements. Thus, the DIC could measure the translation with a good precision, which validated the correct setup of measurements using the FIB milled speckle pattern and the DIC software setting.
Table 4. Average of translation values measured by DIC in relation to the sample movement inside the field of view.
Sample movement in X or Y
direction (μm) DIC measurement in X direction (μm) DIC measurement in Y direction (μm)
10±2 9.07±0.03 10.44±0.04
20±2 19.3±0.05 19.6±0.04
Figure 4. Evaluation of the DIC measurements relating to the sample translation; (a) before translation, (b) 20 μm translation in the x direction, (c) 20 μm translation in the Y direction. The color bar
(on the right) indicates the translation values(μm).
3.2 Strain distribution in the microstructure
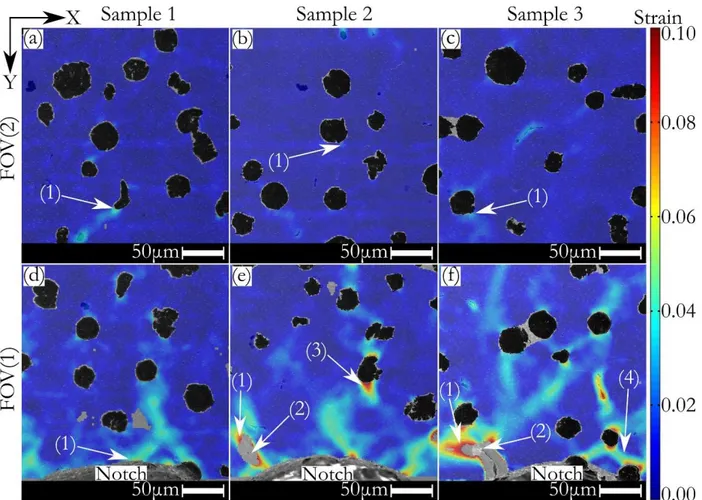
Figure 5 shows the equivalent Von Mises strain distribution in the microstructure for both FOV(1) and FOV(2) after 100 loading cycles. Inhomogeneous strain distribution was observed in both field of views, which was due to the microstructural variations (ferrite and graphite phases). High amount of strain concentration was accumulated close to the graphite particles, particularly at the corner of graphite particles with sharp edges (e.g. see Figure 5(e), point (3)). The strain gradients often formed shear bands between the graphite particles, regardless of the ferrite grain boundaries location (e.g. see Figure 5(f), point (4)). In general, higher gradient of strain was observed in FOV(1) compared to FOV(2), which was due to the higher stress concertation in the vicinity of the notch tip. It is important to note that the subsurface microstructural features (e.g. graphite particles) could affect the deformation on the surface [25]. This could result in regions with higher strain localization on the surface, which requires further investigation.
Figure 5. Equivalent Von Mises strain distribution in the microstructure after 100 cycles at the maximum applied load. Arrows indicate the regions of interest. (a) Sample 1, FOV(2), point (1) shows the location of the
maximum strain. (b) Sample 2, FOV(2), point (1) shows the location of the maximum strain. (c) Sample 3, FOV(2), point (1) shows the location of the maximum strain. (d) Sample 1, FOV(1), point (1) shows the location
of the maximum strain. (e) Sample 2, FOV(1), point (1) shows the location of the maximum strain, point (2) shows the location of the micro-crack, and point (3) shows the strain accumulation in the vicinity of a graphite.
(f) Sample 3, FOV(1), point (1) shows the location of the maximum strain, point (2) shows the location of the micro-crack, and point (4) shows an accumulated strain band. Color bar on the right is an indicator of the
strain values in the X direction.
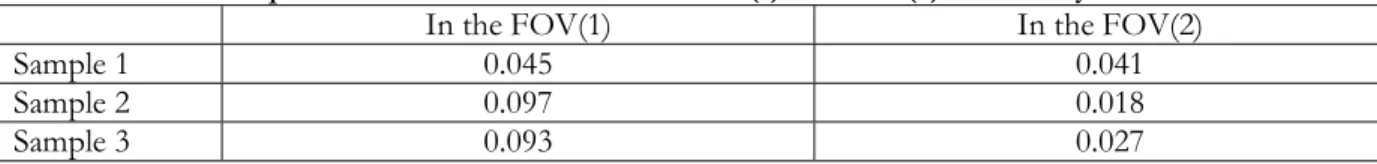
Table 5 presents the maximum amount of strain accumulation measured in the FOV(1) and FOV(2) after 100 cycles. The locations of these peaks are marked by point (1) in Figure 5, which could represent the susceptible crack initiation locations in the microstructure. In general, higher peaks of strain were obtained in the FOV(1) compared to the FOV(2). In the FOV(1), the strain peaks were located close to the notch or in the vicinity of the micro-cracks tips. In the FOV(2), the peaks were located at the ferrite-matrix interface, particularly at sharp corners of the graphite particles.
The highest strain peak in the FOV(2) was recorded for sample 1 (see Figure 5(a), point (1)). This was due to the presence of an irregular shape graphite with a sharp corner. Lower amount of strain localization was obtained at the irregular corner of nodular graphite in samples 2 and 3. The lowest strain peak in the FOV(1) was measured for sample 1 as well. In this sample, a micro-crack was initiated outside the field of view, which could cause strain relaxation in the field of view. The higher amount of peak strain (up to 0.097) in samples 2 and 3 was due to the presence of the micro-cracks.
Table 5. Maximum equivalent Von Mises strain in the FOV(1) and FOV(2) after 100 cycles.
In the FOV(1) In the FOV(2)
Sample 1 0.045 0.041
Sample 2 0.097 0.018
Sample 3 0.093 0.027
3.3 Strain distribution in the vicinity of the micro-cracks
Figure 6 shows the strain distribution in the vicinity of micro-cracks initiated in the FOV(1). Table 6 presents the cycle at which early micro-cracks were initiated in the FOV(1), as well as the peak of strain in FOV(1) and the amount of local strain measured ahead of the micro-crack tip. Sample 1 showed multiple cracking at the notch during cyclic loading. The first micro-crack was initiated outside the FOV(1), but it was arrested after around 1850 cycles, when another micro-crack in the field of view was initiated (see Figure 6(a)). Since the first micro-crack was outside the speckled zone, it was not possible to measure local strain in that area. In samples 2 and 3 (Figure 6(b) and (c)) micro-cracks appeared at the cycles of 100 and 30 in the FOV(1). The early initiation of the micro-cracks in these samples could be due to the presence of a graphite particle under a very thin ferritic crust close to the surface. This phenomenon has been reported before [19]. All the micro-cracks were initiated and propagated transgranularly at their early stages of formation.
A significant localized deformation resulting in a high strain accumulation was measured in the vicinity of the micro-cracks. The peak of strain in the entire FOV(1) was located around the micro-cracks (see points (1) in the three micrographs of Figure 6). In contrast to samples 1 and 2, the peak of strain was not located ahead of the micro-crack tip in sample 1 (see point 1 in Figure 6(a)). Although the micro-crack initiated in a highly strained region (see Figure 5(d), point (1)) in this sample, it did not propagate toward the direction of the highly strained regions at the early stages of the initiation. The reason that the peak of strain was not located at the tip of the crack in this sample could be the strain relaxation that occurred because of the presence of another micro-crack, or the micro-crack branching under the surface. Justification of such a behavior requires further investigation, preferably in 3D.
The peak of strain in the vicinity of the micro-cracks was in the order of 0.096±0.002. However, the average of strain, measured in an area equal to the size of a subset ahead of the micro-crack tip, was in the range of 0.032-0.056. This indicated a high amount of strain concertation in these regions, which was mainly related to the localized plasticity. These strain concentrations were reduced by moving away from the micro-crack tip. This implies that the micro-crack was propagated through the ferrite by the localized strained regions but not necessary toward the maximum strained regions.
Figure 6. Equivalent Von Mises strain in the vicinity of the early micro-cracks in FOV(1) at the maximum applied load; (a) sample 1 after 1986 cycles, (b) sample 2 after 100 cycles, (c) sample 3 after 30 cycles. In all the micrographs, point (1) shows the location of the maximum strain in the FOV(1), and point (2) shows the
micro-crack location.
Table 6. Maximum equivalent Von Mises strain, and local strain ahead of the micro-crack tip in the FOV(1). Number of cycles Micro-crack length (μm) Mises strain in the FOV(1) Peak of equivalent Von Local strain ahead of the micro-crack tip
Sample 1 1986 16.7 0.095 0.032±0.003
Sample 2 100 5 0.097 0.056±0.015
Sample 3 30 36.3 0.098 0.038±0.007
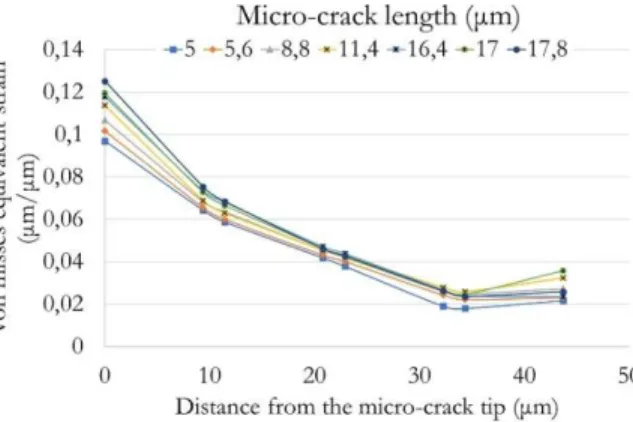
Figure 7 shows the gradient of strain along lines in the propagation direction of the micro-crack in sample 2 at the maximum load level (e.g. strain values along the dashed line in Figure 6(b)). The equivalent Von Mises strain near the micro-crack tip was increased from 0.097 to 0.125 (28% increase) by propagation of the micro-crack from 5 to 17.8 μm, respectively. Strain was decreased with a higher slope by moving away from the micro-crack tip to 10 μm and with lower slope up to the 34 μm, but it increased slightly by moving farther away. However, this increase in strain was due to reaching the strain accumulation in the vicinity of another nodular graphite particle.
Sadananda et al. [39, 40] investigated the conditions for propagation or non-propagation of an incipient crack from stress concentrations such as notches, holes, etc. They have shown that for a short crack to initiate and grow, not only the stress magnitude but also its gradient is important. The stress gradient represented by the line in front of the incipient short crack has to be maintained for the micro-crack to grow continuously. The stress-intensity of a short crack increases sharply and then decreases and reaches a minimum as it moves away from the internal stress field of a notch before it increases again due to the nominal stresses. Similarly, it is shown in Figure 7 that an accumulation of strain occurred ahead of a growing micro-crack, which was increased gradually during the propagation. However, the strain accumulation was decreased by moving away from the micro-crack tip. Nevertheless, since all the micro-cracks in the FOVs of this study were propagating, further investigation is required to compare the strain distribution in front of a propagating micro-crack with that of a non-propagating micro-crack.
Figure 7. Strain distribution along lines, which were aligned in the propagation direction of the micro-crack that is presented in Figure 6(b), with respect to the micro-crack length. The micro-crack length of 5, 5.6, 8.8, 11.4, 16.4, 17, and 17.8 μm relate to the cycle numbers of 100, 145, 200, 300, 350, 400, and 500, respectively. Note
that the local strains were measured at the maximum load.
4 Conclusion
A novel method was developed based on applying FIB milling for the generation of small speckle patterns on the microstructure of ferritic ductile iron suitable for DIC analysis. The speckle pattern did not mask the microstructure, enabling the correlation of the measured strain to the microstructure. The average of translation measured by DIC conformed well with the amount of sample movement by the SEM stage, validating the DIC measurements. The speckles generating method can be applied on any type of material for strain measurement (i.e. using DIC) during both monotonic and cyclic deformation. In addition, the size of the speckles can be changed depending on the desired strain spatial resolution.
Strain distribution in the microstructure was measured with a spatial resolution of 26.1×26.1 µm during cyclic loading. High amount of strain localization in the form of shear bands could be observed between some of the graphite particles. A significant strain accumulation was observed in the vicinity of the micro-cracks which was due to the localized plasticity. However, the peak of strain in the field of view was not always located ahead of the micro-crack tip at its initiation point, indicating that the micro-cracks did not necessarily propagate in the highest strained regions. As the micro-crack propagated, the strain accumulation ahead of the micro-crack was smoothly increased. However, the gradient of strain was decreased as mowing away from the micro-crack tip.
5 Acknowledgment
The authors acknowledge the Knowledge Foundation (Sweden) for financial support under the CompCAST project (20100280), and SKF Mekan AB and Nya Arvika Gjuteri AB for providing the cast material. This work was also supported by the Singapore Ministry of Education (MOE) Academic Research Funding (AcRF) Tier 1 Grant RG26/12.
6 Appendix 1
To watch the recorded video of the in-situ cyclic test for sample 1 please refer to the online version of the article. In this test ∆K=15MPa√m and R=0.4. The video speed is 12 times faster than the reality. To the best of the authors’ knowledge, this video is one of the earliest recorded microstructural elucidation of cyclic crack propagation in nodular cast iron at this microstructural scale.
7 References
[1] J. Olofsson, I.L. Svensson, The effects of local variations in mechanical behaviour–Numerical investigation of a ductile iron component, Mater Design 43 (2013) 264-271.
[2] C. Labrecque, M. Gagné, Review ductile iron: fifty years of continuous development, Canadian Metallurgical Quarterly 37(5) (1998) 343-378.
[3] L. Bjorkegren, K. Hamberg, Silicon alloyed ductile iron with excellent ductility and machinability, Hommes et Fonderie(France) 307 (2000) 10-20.
[4] R. Larker, Solution strengthened ferritic ductile iron ISO 1083/JS/500-10 provides superior considtent properties in hydraulic rotators, China Foundry 6(4) (2009) 343-351.
[5] U. de La Torre, A. Loizaga, J. Lacaze, J. Sertucha, As cast high silicon ductile irons with optimised mechanical properties and remarkable fatigue properties, Mater Sci Tech-Lond 30(12) (2014) 1425-1431.
[6] G. Hütter, L. Zybell, M. Kuna, Micromechanisms of fracture in nodular cast iron: From experimental findings towards modeling strategies – A review, Engineering Fracture Mechanics 144 (2015) 118-141.
[7] A. Ghahremaninezhad, K. Ravi-Chandar, Deformation and failure in nodular cast iron, Acta Materialia 60(5) (2012) 2359-2368.
[8] E. Foglio, D. Lusuardi, A. Pola, G.M. La Vecchia, M. Gelfi, Fatigue design of heavy section ductile irons: Influence of chunky graphite, Mater Design 111(Supplement C) (2016) 353-361.
[9] I. Hervas, M.B. Bettaieb, A. Thuault, E. Hug, Graphite nodule morphology as an indicator of the local complex strain state in ductile cast iron, Materials & Design (1980-2015) 52(Supplement C) (2013) 524-532.
[10] V. Di Cocco, F. Iacoviello, M. Cavallini, Damaging micromechanisms characterization of a ferritic ductile cast iron, Engineering Fracture Mechanics 77(11) (2010) 2016-2023.
[11] F. Iacoviello, O. Di Bartolomeo, V. Di Cocco, V. Piacente, Damaging micromechanisms in ferritic–pearlitic ductile cast irons, Materials Science and Engineering: A 478(1–2) (2008) 181-186. [12] K.A. Kasvayee, E. Ghassemali, K. Salomonsson, S. Sujakhu, S. Castagne, A.E.W. Jarfors, Strain localization and crack formation effects on stress-strain response of ductile iron, Materials Science and Engineering: A 702 (2017) 265-271.
[13] M. Dong, C. Prioul, D. François, Damage effect on the fracture toughness of nodular cast iron: part I. Damage characterization and plastic flow stress modeling, Metallurgical and Materials Transactions A 28(11) (1997) 2245-2254.
[14] L. Zybell, H. Chaves, M. Kuna, T. Mottitschka, G. Pusch, H. Biermann, Optical in situ investigations of overload effects during fatigue crack growth in nodular cast iron, Engineering Fracture Mechanics 95 (2012) 45-56.
[15] S. Sujakhu, S. Castagne, M. Sakaguchi, K.A. Kasvayee, E. Ghassemali, A.E.W. Jarfors, W. Wang, On the fatigue damage micromechanisms in Si-solution–strengthened spheroidal graphite cast iron, Fatigue & Fracture of Engineering Materials & Structures (2017).
[16] F. Iacoviello, V. Di Cocco, M. Cavallini, Ductile cast irons: microstructure influence on fatigue crack propagation resistance, Frattura ed Integrità Strutturale (13) (2010) pages 3-16.
[17] P. Čanžar, Z. Tonković, J. Kodvanj, Microstructure influence on fatigue behaviour of nodular cast iron, Materials Science and Engineering: A 556 (2012) 88-99.
[18] T. Palin‐Luc, S. Lasserre, Y. Berard, Experimental investigation on the significance of the conventional endurance limit of a spheroidal graphite cast iron, Fatigue & Fracture of Engineering Materials & Structures 21(2) (1998) 191-200.
[19] C. Verdu, J. Adrien, J.Y. Buffière, Three-dimensional shape of the early stages of fatigue cracks nucleated in nodular cast iron, Materials Science and Engineering: A 483–484 (2008) 402-405.
[20] M. Mörtsell, K. Hamberg, J. Wasén, Crack initiation in ductile cast irons, Int J Cast Metal Res 16(1-3) (2003) 245-250.
[21] K.A. Kasvayee, E. Ghassemali, A.E. Jarfors, Micro‐Crack Initiation in High‐Silicon Cast Iron during Tension Loading, TMS2015 Supplemental Proceedings (2015) 947-953.
[22] C. Guillemer-Neel, V. Bobet, M. Clavel, Cyclic deformation behaviour and Bauschinger effect in ductile cast iron, Materials Science and Engineering: A 272(2) (1999) 431-442.
[23] M.A. Sutton, J.J. Orteu, H. Schreier, Image correlation for shape, motion and deformation measurements: Basic Concepts, Theory and Applications, Springer2009.
[24] K.A. Kasvayee, K. Salomonsson, E. Ghassemali, A.E.W. Jarfors, Microstructural strain distribution in ductile iron; comparison between finite element simulation and digital image correlation measurements, Materials Science and Engineering: A 655 (2016) 27-35.
[25] G. Fischer, J. Nellesen, N.B. Anar, K. Ehrig, H. Riesemeier, W. Tillmann, 3D analysis of micro-deformation in VHCF-loaded nodular cast iron by, Materials Science and Engineering: A 577 (2013) 202-209.
[26] A.D. Kammers, S. Daly, Self-Assembled Nanoparticle Surface Patterning for Improved Digital Image Correlation in a Scanning Electron Microscope, Experimental Mechanics 53(8) (2013) 1333-1341.
[27] E. Salvati, T. Sui, A.J.G. Lunt, A.M. Korsunsky, The effect of eigenstrain induced by ion beam damage on the apparent strain relief in FIB-DIC residual stress evaluation, Mater Design 92(Supplement C) (2016) 649-658.
[28] J. Tong, B. Lin, Y.-W. Lu, K. Madi, Y. Tai, J. Yates, V. Doquet, Near-tip strain evolution under cyclic loading: In situ experimental observation and numerical modelling, Int J Fatigue (2014). [29] C.C. Tasan, J.P.M. Hoefnagels, M. Diehl, D. Yan, F. Roters, D. Raabe, Strain localization and damage in dual phase steels investigated by coupled in-situ deformation experiments and crystal plasticity simulations, International Journal of Plasticity 63(0) (2014) 198-210.
[30] J. Carroll, W. Abuzaid, J. Lambros, H. Sehitoglu, An experimental methodology to relate local strain to microstructural texture, Review of Scientific Instruments 81(8) (2010) 083703.
[31] K.A. Kasvayee, L. Elmquist, A.E. Jarfors, E. Ghassemali, Development of a pattern making method for strain measurement on microstructural level in ferritic cast iron, 23rd International Conference on Processing and Fabrication of Advanced Materials (PFAM-XXIII), Roorkee, India, December 5-7, 2014, 2014.
[32] A.M. Korsunsky, M. Sebastiani, E. Bemporad, Residual stress evaluation at the micrometer scale: Analysis of thin coatings by FIB milling and digital image correlation, Surface and Coatings Technology 205(7) (2010) 2393-2403.
[33] K.A. Kasvayee, E. Ghassemali, I.L. Svensson, J. Olofsson, A.E.W. Jarfors, Characterization and modeling of the mechanical behavior of high silicon ductile iron, Materials Science and Engineering: A 708(Supplement C) (2017) 159-170.
[34] A. Standard, E647, Standard test method for measurement of fatigue crack growth rates. Annual book of ASTM Standards 3 (2000).
[35] S. Sujakhu, S. Castagne, M. Sakaguchi, K.A. Kasvayee, E. Ghassemali, A.E.W. Jarfors, W. Wang, Micromechanisms investigation on fatigue crack initiation and propagation in high silicon spheroidal graphite cast iron, 8th Low Cycle Fatigue, Dresden, Germany, 2017.
[36] P. Lava, S. Cooreman, S. Coppieters, M. De Strycker, D. Debruyne, Assessment of measuring errors in DIC using deformation fields generated by plastic FEA, Optics and Lasers in Engineering 47(7) (2009) 747-753.
[37] P. Lava, S. Cooreman, D. Debruyne, Study of systematic errors in strain fields obtained via DIC using heterogeneous deformation generated by plastic FEA, Optics and Lasers in Engineering 48(4) (2010) 457-468.
[38] Z. Wang, H. Li, J. Tong, J. Ruan, Statistical analysis of the effect of intensity pattern noise on the displacement measurement precision of digital image correlation using self-correlated images, Experimental Mechanics 47(5) (2007) 701-707.
[39] K. Sadananda, A. Arcari, A. Vasudevan, Does a nucleated crack propagate?, Engineering Fracture Mechanics 176 (2017) 144-160.
[40] K. Sadananda, S. Sarkar, Modified Kitagawa Diagram and Transition from Crack Nucleation to Crack Propagation, Metallurgical and Materials Transactions A 44(3) (2013) 1175-1189.