Master Thesis Project 15p, Spring 2017
Improving a website’s first meaningful paint by
optimizing render blocking resources - An
experimental case study
By Harini Natarajan Rashmi Rashmi Supervisor: Daniel Spikol Examiner: Johan Holmgren
Contact information
Author: Harini Natarajan E-mail: nharinirmd@gmail.com Rashmi Rashmi E-mail: mca.rashmi@gmail.com Supervisors: Daniel Spikol E-mail: daniel.spikol@mah.seMalmo University, Department of Computer Science and Media Technology
Examiner: Johan Holmgren
E-mail: Johan.holmgren@mah.se
Contents
1 Introduction 1
1.1 Motivation and Problem Statement . . . 2
1.2 Research Questions . . . 4
1.2.1 Goal and Hypothesis . . . 5
1.3 Expected Impact . . . 5
1.4 Limitations . . . 6
1.5 Formulation of the Paper . . . 6
2 Research Methodology 7 2.1 Literature Study . . . 7
2.2 Research Philosophy and Paradigms . . . 8
2.3 Research Methodology . . . 9 2.3.1 Relevance Cycle . . . 9 2.3.2 Rigor Cycle . . . 10 2.3.3 Design Cycle . . . 10 2.4 Project Iterations . . . 11 2.4.1 Iteration 1 . . . 11 2.4.2 Iteration 2 . . . 12 2.4.3 Iteration 3 . . . 12 2.4.4 Iteration 4 . . . 12 2.5 Case Study . . . 12
2.6 Alternative Research Methods . . . 13
3 Literature Study 14 3.1 Background Study . . . 14
3.1.1 Web Page Rendering . . . 14
3.1.2 Critical Rendering Path . . . 14
3.1.3 Time to Interactive . . . 15
3.2 Research Question 1 . . . 16
3.3 Research Question 2 . . . 18
3.3.1 Introduction to CSS . . . 19
3.3.2 Analysis on CSS selectors . . . 20
3.3.3 Loading CSS without blocking render . . . 21
3.3.4 Tools . . . 21
3.4 Research Question 3 . . . 22
3.4.1 Introduction to JS . . . 23
3.4.2 Nonblocking of JavaScript Downloads . . . 24
3.5 Summary . . . 25
4 Implementation 26 4.1 Case Study - Focus Group Interview . . . 26
4.2 Iteration 1 . . . 28
4.2.1 Experiment . . . 28
4.3 Iteration 2 - CSS . . . 33
4.4 Iteration 3 - JS . . . 34
4.5 Iteration 4 - Combining CSS and JS . . . 34
5 Evaluation and Discussion 35 5.1 Purpose . . . 35
5.2 Assumption and Constraint . . . 35
5.3 Experimental Evaluation . . . 36
5.3.1 Results from CSS . . . 36
5.3.2 Results from JS . . . 37
5.3.3 Results by combining CSS and JS . . . 38
5.4 Feedback from Focus Group . . . 39
5.5 Discussion . . . 39 5.6 Threats to Validity . . . 42 5.6.1 Internal Validity . . . 42 5.6.2 External Validity . . . 42 5.6.3 Construct Validity . . . 43 6 Conclusion 44 6.1 Conclusion . . . 44
6.2 Future Work . . . 44 Appendices . . . 50 A Code for CSS application . . . 50 B Experiment on Skanetrafiken website using our CSS
Abstract
Web page loading time is one of the critical challenges on the Internet. This topic attracts more researchers as it largely reflects the user satisfaction. A web page resources typically consists of Hyper Text Markup Language (HTML), Cascading Style-Sheet (CSS), JavaScript (JS), media files, etc. As the complexity of the web page increases, the size of files fetched from server also increases which causes delay in transmitting, loading, parsing and rendering the web page.
The web page is not rendered until HTML, CSS and JS files are loaded and parsed. Not all such files are needed to be rendered for the first page. Optimizing and loading only critical files required for the first page, can con-siderably reduce time taken to load the web page. After the first page is rendered, the rest of the files can be loaded and executed. In this thesis, we focus on improving the time taken for First Meaningful Paint(FMP) of website by loading the critical files initially. We used Design Science Re-search(DSR) methodology and created a PhantomJS application, to identify and segregate used and unused CSS for the first meaningful paint of the web page. We also analyzed script files to load only critical files required for FMP and the rest later. We evaluated our experiment by studying a case on Axis Communications AB and measured its website’s performance to find if our experiment reduced FMP time. It showed improvement in time taken for FMP from 1284ms to 372.6ms. Based on the results, we suggest to web developers to separate and load the files required for FMP and load the rest of the files needed for the website later, so that the first page is rendered quickly.
Acknowledgement
The satisfaction gained from completing this master thesis would not have existed without valuable contribution and guidance of certain people.
We offer our sincerest gratitude to our supervisor Daniel Spikol for con-stant guidance, invaluable support and also for time spent in this dissertation.
Special thanks to our external supervisors Guido Guidos and Ali Arafati from Axis Communications AB, for helping and guiding us throughout the thesis.
We would also like to thank our examiner Johan Holmgren for the guidance and support received which without them, we could not have com-pleted this project.
List of Figures
1.1 Average bytes per page by content type as on April 15, 2016 [4] 1 1.2 Average bytes per page by content type as on April 15, 2017 [4] 2
1.3 Highest correlation to render time on April 15, 2016 [4] . . . . 3
1.4 Highest correlation to render time on April 15, 2017 [4] . . . . 3
2.1 A three cycle view of DSR inspired from Hevner [15] . . . 10
3.1 Critical Rendering Path . . . 15
3.2 Page Load Performance [24] . . . 16
3.3 JavaScript execution showing async and defer [9] . . . 24
4.1 Summary of activities while loading the web page . . . 28
4.2 Dust-Me Selector . . . 30
4.3 JCLAIM application . . . 31
4.4 Audit results before CSS removal . . . 32
4.5 Audit results after CSS removal . . . 32
4.6 CSS Tool Implementation . . . 33
5.1 Audit after experiment . . . 36
5.2 Rendering time when CSS files are removed completely . . . . 40
5.3 Scripting time when removing external JS . . . 41
1 Before using CSS application . . . 54
List of Tables
2.1 Research Process . . . 7
2.2 Search Keywords . . . 8
3.1 Existing tools for identifying unused CSS . . . 22
5.1 Measurements for RQ2 . . . 37
5.2 Measurements for RQ3 . . . 38
5.3 Measurements combining RQ2 and RQ3 . . . 39
List of Acronyms
HTML Hyper Text Markup Language CSS Cascading Style-Sheet
WWW World Wide Web
HTTP HyperText Transfer Protocol JS JavaScript
FMP First Meaningful Paint DSR Design Science Research RQ Research Question
CSV Comma-Separated Values URL Uniform Resource Locator DOM Document Object Model CSSOM CSS Object Model
Chapter 1 Introduction
The World Wide Web (WWW) has touched all fields of development and technology. The Internet is accessible to everyone and we can find high usage of mobile phones, tablets, laptops, etc. The resources stored on the web are increasing steadily each year [4]. From simple HTML pages, it was transformed into complex scripts, style sheets, images, videos, other media etc. This makes web pages weigh heavy in terms of size and causes delays in loading and rendering the requested web page from the server to the browser as response. The steps involved in loading a page are Request, Response, Build and Render [18]. Users expect a web page to load quicker or they move on to other web pages which load faster. This leads to losing of valuable business customers. Web developers are modifying their web pages to optimize them to increase performance and add business value [30]. But still the problem of optimization is never ending due to the addition of new resources every second on the web.
Figure 1.1: Average bytes per page by content type as on April 15, 2016 [4] The Figures 1.1 and 1.2 show the statistics from HyperText Transfer Protocol (HTTP) archive website [4] on ’Average bytes per page by content type’ as on April 15, 2016 and April 15, 2017 respectively. This chart depicts the breakdown of website size by content type and the sizes are the transfer
Figure 1.2: Average bytes per page by content type as on April 15, 2017 [4]
sizes. The list of URLs considered by HTTP archive for statistics are based on the Alexa Top 1,000,000 Sites [6].
It reveals that there is a 9.28% increase in content size per page in just a year. CSS and JS are the render blocking resources. The web page rendering is blocked until these files are fetched and parsed. Figures 1.3 and 1.4 show the ’Highest Correlation to Render Time’ [4]. These charts show the CSS and JS correlation to start render time.
This research work studies web performance optimization on the front-end, to load the web page faster by analyzing the style-sheets and scripts, to reduce the First Meaningful Paint (FMP) time taken by the web browser. The explanation on FMP can be found in Section 3.1.3.
In this chapter, we briefly describe our research overview along with mo-tivation, research questions, expected results, limitations and formulation of this paper.
1.1
Motivation and Problem Statement
In the competitive business scenario, even small time delays in loading web applications lead to a loss of customers as they move on to other web pages when a page is not rendered as expected. Potential customers get frustrated if they find that they have to wait more time for pages to load. A study from
Figure 1.3: Highest correlation to render time on April 15, 2016 [4]
Figure 1.4: Highest correlation to render time on April 15, 2017 [4]
Akami [2] states that 40 percent of e-commerce customers will not wait more than 3 seconds before abandoning the site.
In general, over half of Internet users expect a website to load within 2 seconds. Anything longer makes them click away from that page. This can constitute to lower business value if a company’s website loads much slower than its competitors website. Slower loading websites are usually not desirable by users. The companies find it difficult to allocate resources specifically to handle website optimization and maintenance as it is large in scope and consumes more effort and research.
There are several suggestions and online tools to optimize website to im-prove performance. Major focus is on optimizing CSS and JS files, minifying and Gzipping them because of the fact that they are render blocking. Mini-fication is done by removing all unnecessary characters from source code without changing its functionality and gzipping is compressing files so that
they are smaller in size to help in faster network transfer. For CSS, there are tools to extract only used CSS selectors on the web pages. But they cannot be 100 percent reliable as they may remove some CSS selectors which are used after certain user interactions. Also, these resources are grouped in single script and style-sheets and transferred to browser. This aids in delay while parsing these huge files before rendering. Cache is one way to speed up website, but it is not helpful for first time visitors of the website.
For this scenario, it is important to load critical resources initially for first page rendering and defer load other resources. To our knowledge, there is no recent research which bridges this gap on how to improve load time of web page by reducing the initial content to be parsed by browser for the first page. Our experimental work analyzes this research gap and provides suggestions.
1.2
Research Questions
In order to achieve the goal of improving the web page performance in terms of load time, the following research questions are formulated,
Research Question 1: What are the key factors affecting web page performance?
This research question helps to understand how the web works and what are the key factors for web page load time delays and how researchers have dealt with the problem.
Research Question 2: Does separating and loading initially critical CSS and delaying the load of rest of the CSS im-pacts FMP?
This question focuses on how much impact the CSS selectors has on ren-dering a web page and focuses on different tools which helps to identify unused CSS selectors and the performance measure of how the delay while loading the web page can be reduced by separating unused CSS.
Research Question 3: Does loading critical JS files ini-tially and loading the rest of the files asynchronously help in improving FMP?
This question focuses on optimizing the JS files which are render blocking resources. We study if loading critical files initially and loading rest of the files asynchronously can improve time taken for FMP.
1.2.1
Goal and Hypothesis
The goal of this study is mainly to improve the time for FMP by loading only critical resources for first paint and later loading the rest of the files. The hypothesis of this work is that ”By identifying and separating the critical resources from the rest and loading only those required files initially, can improve the time for FMP of the web page”. Through the research questions mentioned above, we aim to achieve our goal of reducing time for FMP and apply the results on Axis Communications AB [3] website (Case Study) to measure how much performance is achieved.
1.3
Expected Impact
The impact of this experimental research is to help web developers to improve the time for FMP of their web page. Time as factor affects the companies and each millisecond is valuable in business scenario to sustain their customers and compete with competitors. Our application developed to separate critical and non-critical stylesheets can be used securely by the developers to run and test their website. We also formulate suggestions to web developers to analyze and load required scripts files initially and load the rest later based on the results of our experiment. Thus this study will be useful to organizations which are in need of optimizing their websites to speed up their load time.
1.4
Limitations
This research is limited to focus only on stylesheets and scripts as render blocking factors for web page though there are other factors such as media resources, network latency, devices, etc which affects web page load time. The main goal is to improve the FMP of the website and not interested in subsequent page load times. This work is based on a case study which investigated Axis Communications AB website and provided suggestion to web developers from the experimental results. More details on threats to validity will be provided in the Chapter 6.
1.5
Formulation of the Paper
The rest of the thesis is formulated as follows. Chapter 2 presents the re-search methodology which will be used for this thesis. Chapter 3 presents the background, related works and literature study to support our work. Chapter 4 describes the implementation of the work. Chapter 5 discusses the evaluation of the experiment and describes the results for the thesis re-search questions with threats to validity. Chapter 6 concludes this rere-search and discusses future work.
Chapter 2 Research Methodology
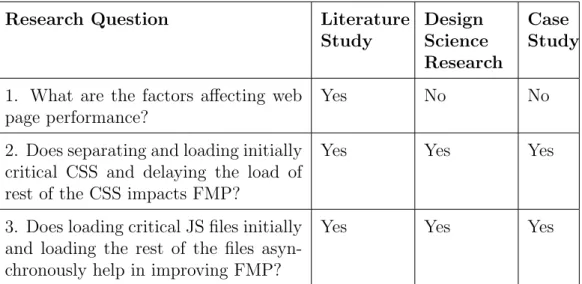
This section explains the research design and methodology of this paper. After the goal and research question identification, it is necessary to formulate the research design for achieving the results. The main research method in this thesis is Design Science Research (DSR). Literature review and case study were also used as research methods to answer the research questions. Table 2.1 briefly describes the relationship between the research questions and the methods used to study and answer them.
Research Question Literature
Study Design Science Research Case Study
1. What are the factors affecting web page performance?
Yes No No
2. Does separating and loading initially critical CSS and delaying the load of rest of the CSS impacts FMP?
Yes Yes Yes
3. Does loading critical JS files initially and loading the rest of the files asyn-chronously help in improving FMP?
Yes Yes Yes
Table 2.1: Research Process
2.1
Literature Study
The literature study is a crucial step for any academic research and is a tool to uncover existing knowledge and analyze the gaps or research opportunities to start a research study [33], [14]. It provides better deeper understanding of the area of interest. This thesis used literature review as a research method to understand and gain knowledge of web page rendering and its factors.
Through this study, we understood how web page is loaded and rendered, crucial factors affecting its load time and various optimization techniques which could be used to improve performance. This was of great help in finding the bottlenecks hindering performance and providing solutions by considering various aspects. A brief description of our literature review is in Chapter 3.
Online resources such as scientific books, articles from Google Scholar1, online discussions, etc. have been used for this study. Digital databases, provided by Malmo University, such as the scientific articles from Institute of Electrical and Electronics Engineers (IEEE)2 database and Association for
Computing Machinery (ACM)3 Digital Library were used. The Table 2.2
shows the keywords used for searching articles online.
Research Question
Keywords
RQ1 Web performance, frontend optimization, web page ren-dering
RQ2 Style sheet optimization, used and unused selectors, me-dia queries, CSS and web page rendering
RQ3 Javascript optimization guidelines, Javascript load time performance, defer and async
Table 2.2: Search Keywords
2.2
Research Philosophy and Paradigms
A paradigm can be a set of shared assumptions of thinking, visualizing or un-derstanding about some world aspect. In research work, it is the assumptions
1https://scholar.google.se/
2http://ieeexplore.ieee.org/Xplore/home.jsp 3http://dl.acm.org/
made during the start of research. It is of three types, Positivism where fac-tual knowledge is gained through observation, Constructivism which focus on how knowledge is learnt and understood from observation and Pragmatism deals with different ways to interpret the knowledge.
Our work matches Pragmatism [11], as we focus our attention on a re-search problem which is to improve the web page load time and use different methods like literature study and case study experiment to derive knowledge about the problem and also use design science to build artifact. Deductive pragmatism is a research method based on making qualitative assumptions on cause and effect, provide inferences on it by experiments, case study or observation. Deductive reasoning is used as we start with knowledge and un-derstanding of factors causing the problem to predict the observations and experiment it.
2.3
Research Methodology
The main research methodology used in our research work is DSR, which extends the boundaries of human and organizational capabilities by creating new and innovative artifacts. It concentrates on the development and perfor-mance of designed artifacts and also to improve the functional perforperfor-mance of the artifact. It has 3 cycles namely relevance, design and rigor cycle. Fig-ure 1 shows the 3 cycles depicted by Hevner in [15]. We built and developed (design) an application to optimize the style-sheets, based on the theories and artifacts (rigor) [32]. Later we evaluated our work by conducting an ex-perimental case study using Axis Communications AB website (relevance).
The tasks involved in our thesis can be divided within 3 cycles from design science [15].
2.3.1
Relevance Cycle
1. Requirements / Problem identification by brainstorming and con-ducting interviews with focus group (web developers at Axis
Commu-Figure 2.1: A three cycle view of DSR inspired from Hevner [15]
nications AB).
2. Field test is done by testing the artifacts with the focus group to evaluate its performance and usability.
2.3.2
Rigor Cycle
1. Analysis of project concept, feasibility and knowledge from a literature study on related works. The web developers suggestion and experience with existing scenario is analyzed.
2.3.3
Design Cycle
1. Design and Build The artifact is designed and developed based on the feedback gained from relevance and rigor cycle activities. The artifact is developed in 4 iterations as follows.
(a) Experimented and analyzed using different tools to check if our concept of separating and loading only critical resources can help in improving FMP.
(b) Built an application to automatically identify CSS rules/selectors which are used on a web page and retrieved all CSS files from that page and separated them as essential and unused CSS files. (c) Analysed JS files and separated critical scripts and loaded them
initially and asynchronously loaded rest of the files.
(d) Combined both (CSS and JS) solutions and measured the perfor-mance of website.
2. Evaluate/ Test The artifact is evaluated to test the performance of website after using artifact and check if it met the requirements of the focus group.
2.4
Project Iterations
The project plan included study on the related works from literatures, gath-ered knowledge from web developers (focus group) to understand their needs and difficulties, which helped to narrow down our focus and develop an ap-plication which can identify render blocking resources. This helped us to load critical files needed for FMP, asynchronously load the rest and finally measure the website performance after applying our results on it. For this process we had the following iterations. After each iteration, the results and artifact were reported to the developers and feedback was obtained to validate our tasks and continue to further iterations.
2.4.1
Iteration 1
This iteration was kick-started after performing the initial rigor (literature review) and relevance cycle (interview with focus group).The objective of this iteration was to test a hypothesis if the FMP can be reduced if we load only CSS selectors used for first page. In this iteration we experimented with different tools to separate CSS files and test the time for FMP before and after separation of CSS. The brief description of the experiment along with the tools can be found in Chapter 4.
2.4.2
Iteration 2
After iteration 1, it is found that the CSS rendering time is improved when loading only the used CSS selectors required for first page. But certain CSS selectors are needed or used for subsequent pages, therefore we need an artifact to identify and separate selectors needed for first page of the website and group them as used. All the other selectors are grouped as ’unused CSS’ which is to be loaded after initial rendering. The artifact was developed using PhantomJS to load an Uniform Resource Locator (URL), parse the HTML file and separate the CSS file as ’essentials.css’ and ’unused.css’ and save them locally. The details of its implementation and evaluation is discussed in Chapter, 5.
2.4.3
Iteration 3
The iteration 3 focus on optimizing JS files by loading, parsing and executing files which are critically needed for FMP and delaying the execution of rest of the files. Our case study website followed optimization rules priorly and had several JS files minified and combined. We developed an program in PhantomJS to find these files from the URL of the website and split them back into multiple single files. We experimented by loading certain files initially and deferring/asynchronously loading the rest to find how they affect the FMP. The implementation details can be found in Chapter 4.
2.4.4
Iteration 4
In this iteration we merged the solutions from iteration 2 and 3 (CSS and JS) and measured the overall improvement in the performance.
2.5
Case Study
Action research case study is used as a research method for this thesis. Ac-cording to Robson, action research tends to ”influence or change some aspect of whatever is the focus of the research” [26]. It is exploratory in nature to
find, seek and generate new ideas and also to improve specific aspects of the studied system. Ethnographic methods, like interviews with the focus group and observations of the existing system were used for data collection in case studies. The precision of the study is improved by triangulation. We used
1. Investigator triangulation by having more than one investigator (2 re-searchers and 1 developer from the international company)
2. Methodological triangulation combining different data collection meth-ods (focus group interview, literature review and experiments)
2.6
Alternative Research Methods
The alternative research methods that can be used to conduct this study is by systematically analyzing factors affecting web page rendering time and then experimenting each factor with suggested solutions. The results of all the experiment can be collected to frame guidelines for web developers. We could not pursue this method as it needs extensive study on each factor and adds time duration to complete tasks.
Chapter 3 Literature Study
3.1
Background Study
In this section, we describe web page rendering, critical rendering path, and time to first render that are needed to understand the rest of the project.
3.1.1
Web Page Rendering
Each web browser utilizes a rendering engine to transform HTML and accom-panying CSS into graphical output on the users screen. Most of the rendering engines follow a similar procedure in rendering a web page, described below. From this list, we focused on optimizing the third and fourth step, because here external CSS and JS files create a bottleneck in the rendering process, causing proceeding steps to become slower [18].
1. Begin constructing the Document Object Model (DOM) tree based on the HTML retrieved from the server.
2. Request CSS and JS resources.
3. Parse CSS and construct the CSS Object Model (CSSOM) tree. 4. Execute JS.
5. Merge DOM and CSSOM into the Render Tree. 6. Run layout, paint.
3.1.2
Critical Rendering Path
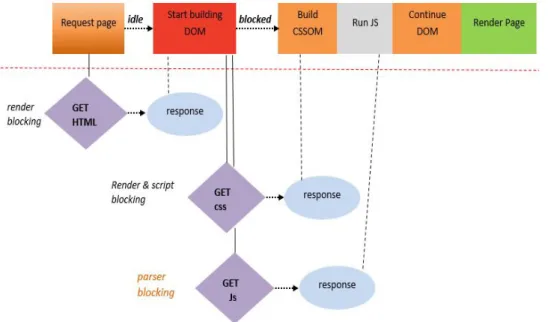
Critical rendering path is the set of steps the browsers must take to convert ”code and resources required to render the initial view of a web page” into rendered pixels on the screen [25]. The overview of web page rendering and handling critical resources is shown in Figure 3.1.
Figure 3.1: Critical Rendering Path
The external JavaScript file demands an additional request but the inline script would not have needed that. Also, no matter which file, CSS or JS, arrives first in the browser, the CSS has to be parsed first. Once the CSSOM is present, the script content can be executed. After that, the DOM parser gets unblocked and can finish its work.
Optimizing the critical rendering path refers to prioritizing the display of content that relates to the current user action. By optimizing the critical rendering path, we can considerably improve the time to first render of web page [13].
3.1.3
Time to Interactive
The time to first render is defined as the time span starting from the browser navigation, to the moment the first non-white content is painted on the browser viewport. It can be affected by multiple factors, including server processing speed, network speed and initial page parsing and rendering. Since the server and connection response time can be improved with upgrades to the hardware components, the best way a web developer can improve the time to first render is to help the browser speed up the processing of objects
Figure 3.2: Page Load Performance [24]
in the head tag [24].
First Contentful Paint is the time when some contentful thing (text, im-age, canvas) is painted for the first time.The time to First Meaningful Paint is defined as the time-span starting from the browser navigation, to the time when page’s primary content appeared on the screen [27]. FMP is essentially the paint after which the biggest above-the-fold layout change has happened, and web fonts have loaded [1] and our primary focus is to achieve a faster FMP.
Key Moments (First Paint, First Contentful Paint, First Meaningful Paint, Time to Interactive and Fully Loaded) in Web Page Loading is shown in Fig-ure 3.2.
3.2
Research Question 1
This section guides to answer the RQ1 which helps us to understand the factors affecting web page performance.
3.2.1
Factors Affecting Web Page Performance
The common factors which contribute to delays while loading web page is studied from literature works. The study on how infrastructure and inter-face design affects web pages is discussed by Razale Ibrahim et.al. [16]. Net-work and application latency, caching and server load are discussed under infrastructure as a factor affecting performance. Also, image type, size and number of images, HTTP and HTML are studied as interface design per-spective. These factors are conceptually investigated on the basis of how it affects the web page performance though they do not provide empirical stud-ies. It should also be noted that the time of writing was 5 years ago and it lacks inclusion of latest technologies and frameworks included in web applica-tions. The HTML and CSS properties affect the loading performance. The WebChar tool discussed in [28] is used to discover those properties which hinder browser performance. It analyzed data from around 200 websites and measured on browsers used in Android mobile phone and netbook us-ing Chromium. The result obtained revealed the 8 hypotheses on power consumption and performance by certain HTML and CSS features such as the cost of images, CSS descendant selectors, opacity controls, table layouts, background fills, etc when browser implements it.
The process of how the web pages load in a browser and what methods can be used to perform Front-End Optimization (FEO) is discussed in [17], which measures the response time before and after optimization of a web server using the Apache JMeter tool. The result shows that the growth in page size affects the loading of web pages and also increases bandwidth. The scripts included in the page deters the loading and causes other process to be halted, as it amends the DOM tree while loading.
Another interesting study on how the website structure affects its per-formance is made in [31]. They have picked reachability and coverability as metrics to capture inter-page access in six real web applications. Their results show that these metrics have little impact on performance but can be useful in identifying dead pages and broken links.
op-timization techniques was made. Yahoo provides best practices for speeding up the web sites [7]. It identifies that the HTTP requests constitute a main factor for the decrease in load time of web page. The solution to this is to combine all CSS and scripts into single CSS and script files respectively. Also the number of image request can be reduced by following CSS sprites and image maps. The time taken for transferring HTTP request and response across the network can be reduced by gzipping components. The study on various optimization techniques on the front-end is done in [20], which is based on reducing the quantity of transmission, by Content Delivery Net-work (CDN) and byte optimization using browser cache, optimizing CSS, JS and HTML content on client side by proper positioning of scripts and style sheets, pre-load and delay loading techniques. There are no experimental evidences or case study made to prove the suggestions included in the paper. Also, solutions stated are more generalized and are not specific.
Pre-loading of website resources is one way to increase the loading per-formance and it is evaluated in [10]. They propose their solution using a Markov model, utility function and clustering users based on their behav-ior patterns. This can be helpful when browser cache size is less in case of mobile browsers as it uses behavior patterns to pre-fetch resources which the user might use rather than all subsequent web pages. To make compo-nents cacheable, Yahoo suggests developers to use Expires header to avoid HTTP requests on subsequent views. Use of asynchronous scripts in the web page will also render quickly rather than making users to wait for it to download [5].
From the literature study, it is seen that the size of HTML, CSS, JS and images greatly affect the loading process and our key focus is to identify how the CSS and JS can lead to delays while being fetched and rendered.
3.3
Research Question 2
This section aims to answer the RQ2 which helps us to understand in iden-tifying the used and unused selectors and also how the load time can be decreased by loading CSS without blocking render.
3.3.1
Introduction to CSS
CSS is a language that describes the presentation style of a structured docu-ment, such as color, font and text size. By separating the presentation style of documents from the content of documents, CSS simplifies Web authoring and site maintenance. CSS are written as a set of rules [12]. Each rule is composed of a selector and a declaration part. The selector part selects one or more DOM elements from the web page. The declaration part contains one or more declarations, separated by semicolons. Each declaration includes a styling property name and its value, to be applied to the DOM elements selected by the selector part.
Every following property on a selector, shortens the list of possible ele-ments that it can affect. If an element matches the defined pattern, the CSS rules defined under that selector are applied to it in the render tree. A CSS selector can select one or more DOM elements from the web page [18]. There are three main mechanisms to select DOM elements by the selector type:
1. Element Selectors are defined by using DOM element types.
2. ID Selectors are defined by using the prefix ’#’ and are matched based on the value of the ID attribute of DOM elements.
3. Class Selectors are specified by the prefix ’.’ and are matched based on the value of the class attribute of DOM elements [12].
The selector part of the rule can either consist of a simple selector of any of the above three types or a complex selector that combines a number of simple selectors. Selectors can also be defined as pseudo classes and pseudo elements. Pseudo classes define styling for a special state of an element. Pseudo elements limit the scope of applying style declarations to specific parts of an element. Different selector parts with the same declaration can be grouped together to avoid code duplication in CSS [22].
3.3.1.1 Media queries
Media query is a CSS technique introduced in CSS3 and it uses the @media rule to include a block of CSS properties only if a certain condition is true. A media query condition can rely upon the type of screen the page is viewed on, its pixel ratio, width and height of the view port/device, orientation (Is the tablet/phone in landscape or portrait mode?), resolution and much more. These conditions can be combined to form more complex media queries that apply to a more specific group of devices. They are especially useful when a web page is expected to be responsive, allowing its layout to be adjusted in real-time. The browser loads all media queries before the initial render, regardless if they apply to the current device or not [18]. This approach creates even more network traffic by downloading larger files, where only a portion of the media queries could be used for the initial rendering.
3.3.2
Analysis on CSS selectors
Researchers from the University of British Columbia in Canada worked on a tool called Cilla that can detect unmatched and ineffective selectors and properties as well as undefined class values [22]. Another research has been performed between University of British Columbia and Concordia University where refactoring opportunities for CSS code in terms of duplication and size reduction have been analyzed [21]. We consider both as important steps for general optimization of CSS code which will keep it clean and up-to-date. However, they do little to help speed up the initial rendering of the page content, something that we focus on in this project.
Another option is to place all the link tags at the end of the body, thus allowing the browser to create the DOM tree and start rendering it before it encounters CSS styles that need to be applied to it. While this seems like a good approach, the drawback is that a phenomenon occurs called Flash of Unstyled Content. Because the browser has started the paint process without having any custom styles to use, it applies default styles integrated in each browser when rendering the elements. Usually this process is fast, but the bare elements will be visible to the user for a short period while fetching
these CSS files [18].
3.3.3
Loading CSS without blocking render
One of the most popular technique to get the content as speedily as possible is by asynchronously downloading stylesheets to prevent them from blocking page rendering. The principles behind these techniques are not new. The trick to trigger an asynchronous stylesheet download is to use an element and set an invalid value for the media attribute. Once the media attribute sets to false, the browser will still download the stylesheet, but it would not wait for the content to be available before rendering the page.
< l i n k r e l =” s t y l e s h e e t ” h r e f =” c s s . c s s ” media=”none”> The media attribute must be set to a valid value again, once the downloading of stylesheets has finished so the style rules will be applied to the document. The onload event is used to switch the media property to all.
< l i n k r e l =” s t y l e s h e e t ” h r e f =” c s s . c s s ” media=”none ” o n l o a d=” i f ( media ! = ’ a l l ’ ) media =’ a l l ’” >
This method of loading CSS will deliver usable content much quicker than the standard approach. Critical CSS can still be served with the usual blocking approach (or it can be used inline for ultimate performance). The non-critical styles can be progressively downloaded and applied later in the parsing/rendering process [19].
3.3.4
Tools
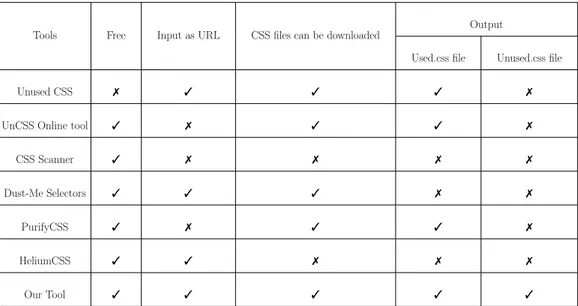
For the research, we analyzed different tools which could provide us the used and unused CSS files required for the web page. The summary of the tool analysis is shown in Table 3.1. We focused on the tools which can take a website URL as input and access HTML and CSS files to find selectors which are needed for the first page load. Some tools require the user to provide the HTML, CSS files as input to generate results which adds overhead to the
developer. It should also give the unused CSS file, as we find from the reviews of different tools that there are minor discrepancies which should be checked manually to correct the errors of the generated file. This will lead to over work by developers which is not desirable. The tool should be free to use and not an online tool as it could lead to security issues. The results generated should be available to download as CSS files.
From the Table 3.1, it is seen that Unused CSS, Dust-Me Selectors and HeliumCSS takes the URL as input which matches our criteria, but Unused CSS is not free to download and the results generated from HeliumCSS and Dust-Me Selectors cannot be downloaded as CSS files. Thus, we developed an artifact which meets all our criteria and generate CSS files as a result.
Tools Free Input as URL CSS files can be downloaded
Output
Used.css file Unused.css file
Unused CSS 7 3 3 3 7
UnCSS Online tool 3 7 3 3 7
CSS Scanner 3 7 7 7 7
Dust-Me Selectors 3 3 3 7 7
PurifyCSS 3 7 3 3 7
HeliumCSS 3 3 7 7 7
Our Tool 3 3 3 3 3
Table 3.1: Existing tools for identifying unused CSS
3.4
Research Question 3
This section aims to answer the RQ3 which helps us to understand in iden-tifying the used and unused JS files and also how the load time can be decreased by loading JS files without blocking render.
3.4.1
Introduction to JS
JavaScript is an object-based scripting language for Web pages. It is used to create interactive websites. JavaScript is an interpreted language, not a compiled language. JavaScript has no compilation step. Instead, an inter-preter in the browser reads over the JavaScript code, interprets each line, and runs it. The JavaScript translator (embedded in browser) is responsible to translate the JavaScript code [8]. JavaScript is an essential part of the modern web these days. JavaScript is at the core of not only the web today, but also becoming the dominant technology on the server-/cloud-side, and even finding its way into the IoT space [23].
JavaScript is considered as a ”parser blocking resource” i.e. the parsing of the HTML document is blocked by JavaScript. If we are loading several JavaScript files on a page then the behavior can be problematic, as it will interfere with the time to first paint even if the document is not actually dependent on those files [8].
Normal JavaScript execution
The default behavior of the <script> element is shown in Figure 3.3. The HTML file will be parsed until the script file is hit, at that point the parsing will stop and a request will be made to fetch the file (if it is external) [8]. The script will then be executed before parsing is resumed. By default, JavaScript files will interrupt the parsing of the HTML document in order for them to be fetched and executed. For slow servers and heavy scripts, displaying the web pages will be delayed [9].
Fortunately, the <script> element has two attributes, async and defer, that can give us more control over how and when external files are fetched and executed.
Figure 3.3: JavaScript execution showing async and defer [9]
3.4.2
Nonblocking of JavaScript Downloads
Splitting
Code splitting is one answer to the problem of monolithic bundles. By defin-ing split-points in the code, it can be split into different files that are lazy loaded on demand. This does not only improve startup time but also help to being interactive sooner [29].
Asynchronous execution
The async attribute is used to indicate to the browser that the script file can be executed asynchronously. With the <script async> attribute, HTML parsing may continue and the script will be executed as soon as its ready after being fetched in parallel with the document parsing [8].
Deferred execution
The defer attribute tells the browser to only execute the script file once the HTML document has been fully parsed. A positive effect of this attribute <script defer> is that the DOM will be available for the script. Like an asynchronously loaded script, the file can be downloaded while the HTML document is still parsing. However, the script is not executed until the pars-ing is complete, even if the file is fully downloaded long before [8].
Dynamically Writing Script Tags
Probably the most popular method to invoke the nonblocking of the download of JavaScript is to dynamically write the script tag with JavaScript. When
the external script is included in this way, it is downloaded without blocking, and executes immediately after the download has finished. Regardless of its popularity, this method has the drawback that execution order is not guaranteed and it may end up with scripts being executed in the wrong order [29].
Picking the Right Method
Dynamically inserting the script tag into the DOM is probably the best method at this moment, although the defer attribute is becoming increas-ingly well supported and may be the way to go in the future. Developers of the major browsers have made significant improvements to their JavaScript engines, and manipulation of the DOM tends to be the most expensive part of JavaScript-rich sites. Browsers have historically loaded JavaScript in a blocking manner, which can make pages appear slow to load. This is gradu-ally changing and there are also many tricks to get around this as discussed above but a lot depends on what it is used for, and how users access the site [29].
3.5
Summary
The goal of our research is to contribute towards improvement of web page load time. It is identified that there is no recent research which bridges this gap on how to improve load time of web page by reducing the time taken by browser to parse for the first paint without content removal. From the literature review conducted, it is found that there are several optimization techniques that claim to improve the web page load time. We intend to im-prove time taken by render blocking resources using optimization techniques like loading the critical resources asynchronously and developing a tool which helps us to identify used and unused CSS selectors. This is explained in the following chapters by experimenting various optimization techniques studied from literature review to improve FMP of the web page.
Chapter 4 Implementation
This chapter describes how we implemented our thesis work. It is divided into three sections describing the tasks performed from a case study, CSS and JS point of view.
4.1
Case Study - Focus Group Interview
Based on our concept, we planned to conduct a Case study on Axis Com-munications AB website and approached them. Axis has its headquarters in Lund, operating worldwide with offices, representatives and profound part-nership. They are the market leader in network video cameras and innovators in video surveillance. Their website is being visited by customers, partners and retailers for variety of services provided by them via their website. We discussed with their web developers to identify their requirements for im-proving web performance of their website.
We described our topic of interest and collected answers on the following questions as semi-structured interview from two of the web developers who were representing the web team at Axis Communications AB.
Questions
1. What is the major challenge you find from existing website’s perfor-mance?
2. Is your website optimized? Can you name few of those techniques used for optimization, if possible?
3. Is there any specific group or person responsible for optimizing the code developed for your website?
Their replies were that the major challenge with the existing website performance is to load the first page much quicker for the first time visitors of the page. This adds value as delays in webpage loading is undesirable by users. Time taken for subsequent visits to the page is enhanced through
cache, but for the first time users/customers performance is affected due to several factors such as the network, devices, CPU capacity, browser, etc. They required a solution to improve web page load time for first time visitors of the page without removal of existing code.
When asked about the existing optimization techniques, they added that their website is optimized. From the PageSpeed 1 test it is found that the desktop version of the website has scored 69/100. But suggests that still certain improvements are needed. The optimization techniques used in Axis Communications AB existing website are minification and concatenation of files into a single file. They also mentioned that there is a group of developers involved in optimization whom have collectively contributed to the website performance.
Based on their replies, it is found that their website is optimised, but they are still interested to improve their FMP time for first time website visitors. Then we obtained the functional and non-functional requirements for the research after finalizing the goal of the research work which is to improve FMP.
Functional Requirements (FR): Functional requirements define the functionalities which the system is expected to accomplish and it can be of technical details, calculations, processing functions or data manipulation. They are relevant to system design. For our research the functional require-ments of the system can be stated as follows
FR 1: FMP of the web page should load critical resources.
FR 2: The FMP time of the page should be improved when compared to existing time taken by website.
Non-Functional Requirements (NFR): Non- functional requirements are the criteria which are used to judge the operation of a system, quality attributes, etc. It explains how the system works and is related to the archi-tecture of the system. The non-functional requirements of our work can be listed as
NFR 1: The website should not look broken
NFR 2: Do not remove any existing code from the website
4.2
Iteration 1
We followed the research methodology discussed in Chapter 2. The time taken for the website (Axis Communications AB) to load on Google Chrome desktop version on Windows 10 is measured using Chrome Dev tool Perfor-mance tab. The summary of the time taken for resources of the web page to get loaded, parsed and rendered on browser is obtained from Time line view of Dev tools which is shown in Figure 4.1.
Figure 4.1: Summary of activities while loading the web page
The summary tab shows a breakdown of overall activity. We are con-cerned only with rendering and scripting time. The rendering time is related to CSS files ans scripting time is related to JS files. The page spends most of its time in rendering and scripting. Since performance is the art of doing less work, our goal is to reduce the amount of time spent doing scripting and rendering work thereby reducing FMP. For the first iteration we focused on CSS and experimented with different online tools and obtained used and un-used CSS files. Then it was tested and evaluated to find that it does reduce FMP time.
4.2.1
Experiment
Our experiment was performed on Windows 10 laptop using WIFI connectiv-ity.The processor is Intel(r) Core(TM) i3 M350 @ 2.27Ghz, 64-bit Operating
System and Ram 3GB. The Google Chrome browser Version 56.0.2924.87 in incognito window was used for loading and measuring website performance using Chrome Developer tools. We tested only for the website of our case study and interested in reducing the FMP time. We used the following tools for this iteration.
• Dust-Me Selectors Dust-Me Selectors2,browser extension) is the development tool in Firefox which is used to find CSS selectors used in the web pages. It supports style-sheets selectors upto CSS3 and can scan up to 5 pages per second. The data can be exported in JSON or Comma-Separated Values (CSV) format.
• JCLAIM JCLAIM3 is basically an instant messaging chat client. It
has some special tools one among which is clean CSS . This can be used along with Dust-Me Selectors to obtain clean CSS file. The CSV file of unused CSS exported from Dust-Me Selector is given as input to this application along with the original CSS file. The output file is clean CSS.
• Telerik Fiddler 4 Telerik Fiddler 44 is a free web debugging proxy
for any browser, system or platform. It can be used to manipulate web session by setting breakpoints, rewriting requests and responses, mimicking the original network traffic. It is used in our work to test the clean CSS file by using local proxy files.
• Chrome Dev tools The Chrome Developer Tools5 are web debugging
tools built into Google Chrome. It provides insights into the browsers internal working and helps developers in code optimization. We use this tool to inspect and measure the load time of the website.
The time taken for the website to load on Google Chrome desktop version on Windows 10 is measured using Chrome Dev tool Time line tab. The
2https://addons.mozilla.org/en-US/firefox/addon/dust-me-selectors/ 3http://jclaim.sourceforge.net/
4http://www.telerik.com/fiddler
average time taken out of 10 trails for loading first paint of the web page is measured as 1.52s.
We audited and measured the style-sheets using Audit tab from Chrome Dev tool. It was found that about 87% of the CSS is unused by the homepage of the website. Though Chrome Dev tools lists the CSS selectors which are unused, it cannot be exported in a portable format to generate clean CSS code. Therefore, we used Dust-Me Selectors to identify ’unused CSS’. Dust-Me Selectors analyses the CSS data of the requested web page (Axis Communications AB) is shown in Figure 4.2. It shows the unused selectors found in the Axis Communications AB website. The listed unused CSS selectors can be exported in either JSON or CSV format.
4.2.1.1 Unused CSS identification
The unused CSS file is exported in CSV format and stored locally. After ob-taining unused CSS selectors in CSV format, it is given as input to JCLAIM along with the original CSS file, which is copied using Dev tools and stored locally. The output from JCLAIM is a clean CSS file which contains only used CSS selectors. This cleaned file is to be used as proxy for testing the performance after code cleaning and removing unused CSS selectors. The JCLAIM application window is shown in Figure 4.3.
Figure 4.3: JCLAIM application
4.2.1.2 CSS optimization
The clean CSS file obtained from the previous step is set as proxy to original CSS file of the Axis Communications AB website using Fiddler. It was done by adding a rule to auto-responder tab to match the request to original CSS file to respond with locally stored clean CSS file. This is then tested using the Chrome Dev tools to verify if the removal has resulted in decrease of the time taken for FMP.
Figure 4.4: Audit results before CSS removal
Figure 4.5: Audit results after CSS removal
The experiment when repeated using the clean CSS file via Fiddler. The Figure 4.4 shows the Audit tab before the CSS removal and Figure 4.5 shows the Audit tab after the CSS removal. Before the experiment, it can be seen that 4017 CSS rules were unused but are loaded and parsed while the web page is rendered. After removal of unnecessary CSS selectors, there are 758 CSS rules which are unused. It also shows that only 57% of the CSS rules are not used by the current page rather than 87% before removal. Through this study is it understood that our hypothesis is true. By using clean CSS with only selectors which are necessary for the web page, the time (average of 10 trials) taken for FMP of the web page was measured as 1.24 s and decreased by 18.42% than the FMP measured before the experiment which is 1.52 s. The results found from this iteration were shown to developers at Axis Communications AB. They were concerned about the security issues when using different online tools to test their codes. So a requirement was made to develop an application which could be used by them securely. The application should take URL as an input and save Used and Unused CSS files locally. We followed up this task in iteration 2.
4.3
Iteration 2 - CSS
In iteration 2, we developed an PhantomJS application to identify, separate and store used and unused CSS file locally. From the previous iteration, it is found that about 87% of the CSS is unused by the homepage of the website [3]. From the literature study on tools, it is seen that the existing tools do not meet our requirements. Also, based on the suggestions from first iteration by the developers we developed a tool, in PhantomJS to identify used and unused CSS selectors, which consider also the media queries. It takes a URL as an input and finds the used and unused CSS selectors and saves them as used and unused CSS files. It searches for CSS rules in JS files and explores responsive design rules, media queries too. The code details for the tool can be found in Appendix A.
Figure 4.6: CSS Tool Implementation
The used CSS and unused CSS file obtained from our tool is set as proxy to CSS files from the website using Fiddler. It is done by adding a rule to the auto-responder tab to match the request to original CSS file to the response of the locally stored ’used CSS’ file. We have also loaded ’unused CSS’ file using <media="none"> as explained in Section 3.1.4.2 so that the non-critical styles can be downloaded and applied later in the parsing/rendering process. This is then tested using the Chrome Dev tools to verify if the removal has resulted in decrease of the time taken for FMP. The evaluation and its results are explained in the next chapter. This application was also tested on another website to evaluate the usefulness of it. Those results are shown in Appendix B.
4.4
Iteration 3 - JS
We investigated and found that Axis Communications AB website is using combined JS files that are included in header and footer of the web page and only the combined JS file included in header is required for first paint of their website.
For the optimization of combined JS file included in header part, we used code splitting approach and we split the combine JS file into different JS files that are then lazy loaded on demand. We wrote a program to fetch and download all the JS files from the combined JS file. By using Chrome Dev tool and Fiddler we tested and found that the 3 out of 9 JS files are required for the first paint without which errors were produced. The remaining six JS files were tested by loading them later. But delaying these 6 files may lead to race conditions as some of the files in the footer part were dependent on them. Thus, due to instability when using code splitting approach, we loaded the header JS files as such without modifications.
For the optimization of combined JS file included in footer part, we used the dynamically writing script method as explained in Section 3.4.2 so that the JS files can be downloaded without blocking and executed immediately after the download is finished.
We made the changes in code and then tested the experiment using the Chrome Dev tools to verify if the lazy loading and async have resulted in de-crease of the time taken for first paint. The results are shown in Section 5.3.2.
4.5
Iteration 4 - Combining CSS and JS
For this iteration we combined the solutions for improving CSS and JS from previous iterations and measured the website’s overall performance. The evaluation of the experiment and its results are explained in Section 5.3.3.
Chapter 5 Evaluation and Discussion
Our research idea is implemented and measured by using Axis Communi-cations AB website as a case study and experimenting it before and after optimization. This section explains the purpose of the experiment, its as-sumptions and constraints, experimental results from iterations 2, 3 and 4 followed by discussion and threats to validity.
5.1
Purpose
The purpose of the experiment is to find the answer to our RQ 2 and RQ 3. For RQ 2, we wanted to experiment if separating and initially loading only the CSS which is used by the first page of website can improve FMP time. The rest of the CSS selectors are loaded after the FMP. Similarly for RQ 3, we loaded first the scripts critical to FMP and asynchronously loaded the other scripts after FMP to gain performance improvement. This was done to measure the improvement in FMP time by separating and loading without content removal.
5.2
Assumption and Constraint
The experiment was performed on Windows 10 laptop using WIFI connec-tivity. The processor is Intel(R) Pentium(R) CPU N3700 @ 1.60 GHz, 64-bit Operating System and RAM 8.00 GB. The Google Chrome browser Version 56.0.2924.87 in incognito window is used for loading and measuring website performance using Chrome Developer Tools. We also conducted the experi-ment and measured only with WIFI connection. We have tested only for the website of our case study and are interested in reducing the FMP time. We also used Fiddler for proxying CSS and JS files.
5.3
Experimental Evaluation
5.3.1
Results from CSS
For this experiment, we are measuring the FMP time and rendering time from Chrome Dev Tool. For evaluating our study, we measured the results for 10 trials and had taken the average time as final results. This step was required as the results were dependent on various factors such as network, CPU capacity, etc. After doing experiment with CSS, It is found that the FMP was improved when loading only the used CSS selectors required for first page and loading unused CSS selectors after FMP. Table 5.1 shows the measurements for RQ2 regarding CSS. From the table, it could be seen that the FMP time has reduced to 447.1 ms from 1351 ms. The rendering time also shows a reduction from 358.3 ms to 160.61 ms because render blocking avoided by our approach by setting the ’media’ attribute to ’none’.
Figure 5.1: Audit after experiment
The Figure 5.1 shows Audit results after applying the modifications which shows that 99% of the unUsed.css file was not used on the page. This implies that our CSS application detects and separates unused CSS not required for first page. The missing 1% is due to media queries which are not used for the current screen size.
This application was also tested for another transportation company’s website and found that it separates the used and unused files which when experimented on Chrome Dev Tools with Fiddler showed that only the file ’unUsed.css’ had unused CSS which is not required for the first page. It is shown in Appendix B.
Trial Number Before After FMP(ms) Rendering(ms) FMP(ms) Rendering(ms) 1 1340 388.0 396 175.1 2 1320 358.0 449 172.0 3 1350 319.3 431 168.3 4 1170 335.4 464 145.7 5 1450 417.4 478 159.6 6 1390 376.2 435 158.7 7 1420 321.1 496 150.9 8 1460 399.9 411 153.5 9 1360 342.2 443 152.8 10 1260 325.5 468 169.5 Average 1351 358.3 447.1 160.61
Table 5.1: Measurements for RQ2
5.3.2
Results from JS
We measured the FMP time and scripting time taken when following the steps in iteration 3 ( 4.4). After doing experiment with JS, it is found that the FMP had improved when loading non-critical scripts dynamically. Table 5.2 shows the measurements for RQ2 regarding JS files.
Trial Number Before After FMP(ms) Scripting(ms) FMP(ms) Scripting(ms) 1 1340 709.1 895 677.8 2 1320 609.1 825 498.2 3 1260 652.2 845 688.7 4 1460 620.6 859 571.2 5 1300 659.5 831 587.7 6 1220 691.6 858 594.2 7 1500 633.0 850 566.6 8 1240 559.9 931 610.5 9 1290 598.8 795 563.2 10 1140 578.7 845 656.9 Average 1307 631.29 853.4 601.5
Table 5.2: Measurements for RQ3
From the table, it could be seen that the FMP time has reduced to 853.4 ms from 1307 ms. The scripting time also shows minor reduction because it also takes into account the time taken for dynamically loaded script files after FMP.
5.3.3
Results by combining CSS and JS
We combined both the experiments and ran it using Fiddler. We tested the experiment result with Chrome Dev Tool. Table 5.3 shows the measurements
after combining the solutions from RQ2 and RQ3. It is seen that the FMP had improved overall from 1284 ms to 372.6 ms.
Trial Number
Before After
FMP(ms) Rendering(ms) Scripting(ms) FMP(ms) Rendering(ms) Scripting(ms)
1 1270 355.0 556.6 331 156.0 608.7 2 1300 341.2 596.9 410 159.5 620 3 1250 345.4 623.1 382 148.2 688.5 4 1260 333.8 643.8 382 139.6 633.7 5 1320 324.9 656.1 344 165.7 625.8 6 1120 328.5 625.7 367 146.1 672.2 7 1350 336.0 560.1 395 167.4 645.6 8 1320 368.4 714.5 375 150.7 659.2 9 1420 356.8 644.4 382 162.3 667.1 10 1230 333.6 560.7 358 141.0 648.8 Average 1284 342.36 618.19 372.6 153.65 646.96
Table 5.3: Measurements combining RQ2 and RQ3
5.4
Feedback from Focus Group
After the research, the results were shown and analysed with the focus group. They commented that the solution seems a good strategy to tackle website’s performance for first time visitors and will further discuss with experts to include these suggestions from research work on their website.
5.5
Discussion
From this research work, we identified the various factors affecting the web page performance and then focused on the factors which are render blocking which is essential for the first paint of the web page. We tested our hypothesis
that by loading critical resources initially, the FMP can be improved on Axis Communications AB website and discussed its improvements with the developers at company. The suggestions to improve web page performance for FMP time can be generalized as follows
1. Identify render blocking resources.
2. Combine and minimize the size of resources transferred from server as much as possible by compression/gzipping etc.
3. Identify what resources are needed for the first paint and prioritize their load first.
(a) CSS - Suggested to use our PhantomJS application. (b) JS - Use async to load external non critical scripts.
For our case study, we tested and analyzed our suggestions on Axis Com-munications AB website. We experimented on the website by removing the render blocking resources - CSS and JS. Though at this condition the page appears to be broken without scripts and styling, we measured the reduction of time which is the possible range until which we can optimize. Figure 5.2 shows the reduction of rendering time when the external CSS were removed. It can be seen that the overall rendering time is reduced to 131.0 ms.
Similarly we measured the website by completely removing all the exter-nal scripts from the website and from the Figure 5.3 it is seen that the overall scripting time is just 19.3 ms.
Figure 5.3: Scripting time when removing external JS
It should be noted that these reductions tend to be useless as reducing to this level will break the appearance of the page since its without styles and scripts. Since most of the website have heavy scripting and styling on them, its difficult to reduce to this base level.
From the iterations, it can be seen that our hypothesis is proved by im-proving FMP of the website. The measurements for FMP and rendering time was repeated for 10 trials and average value for FMP was found to be 447.1 ms (Table 5.1). This answers our RQ2 that FMP improves when loading only essential CSS initially. The measurements for FMP and scripting time was repeated for 10 trials and average value for FMP was found to be 853.4 ms (Table 5.2). This answers our RQ3 that FMP improves when loading only essential JS files initially and asynchronously load rest of the files. The measurements for FMP, rendering and scripting time was repeated for 10 trials and the average value for FMP was found to be 372.6 ms (Table 5.3). This evaluates our study that FMP can be improved when loading essential or critical resources needed for the first page of the website. The summary of our research results based on research questions is shown in Table 5.4
RQ Evaluation Results
RQ1 Literature review Improve FMP by optimizing ren-der blocking resources
RQ2 Literature review and DSR arti-fact
FMP improved to 447.1 ms from 1351 ms .
RQ3 Literature review and experiment FMP improved to 853.4 ms from 1307 ms .
Table 5.4: Summary of results
5.6
Threats to Validity
The validity of a study denotes the trustworthiness of results obtained from the research. It analyzes to what extent the results are true and without bias. The various threats to validity for our work is discussed below
5.6.1
Internal Validity
Internal validity is the degree to which system minimizes systematic errors or bias. It refers to how well an experiment is conducted. Our measurements are taken from Chrome Canary web browser in ’incognito window’ with cache disabled. The experiment is also simulated on Chrome Dev tools with WIFI connectivity. It is not tested on other browsers.
5.6.2
External Validity
This validity is concerned to what extent it is possible to generalize the findings from the research, and the degree to which the findings are of interest to other people outside the case investigated. Our work investigated only case study website in detail. So the results cannot be generalized for all website. But our artifact can be used on other website to separate CSS files. The suggestions summarised in 5.5 can be used cautiously as websites are designed differently and developers need to prioritize their resources effectively.
5.6.3
Construct Validity
Construct validity reflects the degree to which a test measure or result matches what it claims to be measuring. It focuses on the relationship be-tween the observation and the theory behind the experiment. In our work, we claim that the time for FMP is improved if only the essential resources are loaded initially. The results obtained agree with our claim. But there are many other factors contributing to the load time which is not addressed in our work. Due to time constraint, our thesis is limited to CSS and JS as the key factors affecting rendering time of web page.
Chapter 6 Conclusion
6.1
Conclusion
This research work focuses on how to improve FMP and reduce the effects of render blocking resources such as scripts and styles. We had requirements to improve their website’s FMP from developers of Axis Communications AB. We followed DSR methodology to develop the solution to identify var-ious factors blocking the web page rendering and to improve the FMP. The different factors affecting the web page performance were analysed and the key factors which blocks the rendering of the web page is identified as CSS and scripts. Then we experimented by identifying the critical CSS and JS which are needed for FMP and loaded them initially for quick load of the page. The rest of the files were delayed and loaded after the FMP. In this way, without content removal we tried to improve FMP of the website. This research results prove our hypothesis that loading the critical resources ini-tially and loading the rest later can improve FMP of the website. From the experiment on the Axis Communications AB website it can be seen that the FMP has improved from 1284 ms to 372.6 ms.
6.2
Future Work
The long term goal of our research is to minimize the load time of web pages to gain business value and satisfy user expectations. In this research we focused only on render blocking resources such as CSS and JS but there can be other factors which influence the web page loading performance such as network delays, devices, CPU performance, images and media files, etc. Future work could be to consider all the factors and formulate a solution to web developers community which could help them test their website and optimize and improve loading time. It would also be a interesting study to experiment and gather results about the web page performance issues relating to different devices or browsers. As the companies collect analytics
on web pages, they could identify which browsers and devices, a majority of their customers are using and optimize web pages according to it.
Also, this research was applied and experimented on Axis Communica-tions AB website only. It needs to be tested on several websites and results can be compared and evaluated. This could lead developers to understand how different designs can affect website performance and to effectively iden-tify best guidelines to construct the website.
![Figure 1.1: Average bytes per page by content type as on April 15, 2016 [4] The Figures 1.1 and 1.2 show the statistics from HyperText Transfer Protocol (HTTP) archive website [4] on ’Average bytes per page by content type’ as on April 15, 2016 and April 1](https://thumb-eu.123doks.com/thumbv2/5dokorg/4001741.80211/11.892.247.622.716.928/average-figures-statistics-hypertext-transfer-protocol-average-content.webp)
![Figure 1.2: Average bytes per page by content type as on April 15, 2017 [4]](https://thumb-eu.123doks.com/thumbv2/5dokorg/4001741.80211/12.892.247.630.242.461/figure-average-bytes-page-content-type-april.webp)
![Figure 1.3: Highest correlation to render time on April 15, 2016 [4]](https://thumb-eu.123doks.com/thumbv2/5dokorg/4001741.80211/13.892.226.644.231.412/figure-highest-correlation-render-time-april.webp)

![Figure 2.1: A three cycle view of DSR inspired from Hevner [15]](https://thumb-eu.123doks.com/thumbv2/5dokorg/4001741.80211/20.892.191.700.231.522/figure-cycle-view-dsr-inspired-hevner.webp)
![Figure 3.2: Page Load Performance [24]](https://thumb-eu.123doks.com/thumbv2/5dokorg/4001741.80211/26.892.189.704.224.527/figure-page-load-performance.webp)
![Figure 3.3: JavaScript execution showing async and defer [9]](https://thumb-eu.123doks.com/thumbv2/5dokorg/4001741.80211/34.892.176.718.217.324/figure-javascript-execution-showing-async-defer.webp)
