ISSN 0347-5049
VTIsärtryck
t
1 14 7.986
RECTIFIER BATTERIES FOR COMPUTER HP computer
DC/AC CONVERTER MEASURING UNIT LASER ELECTRONICS with keyboard, display
SPC UNIT and printer.
Could be swinged to backseat ACCELEROMETER Inklinometer STARTER BATTERY FOR GENERATOR ACCELEROMETER (quarter car) DISTANCE RECORDER
LASER SUPPORT BEAM
The Laser Road Surface Tester (RST): synopsis
af presentations in Sydney and Melbourne,
A ustralia, March 1986
Dr. Peter W. Arnberg
w Väg- UCI) Eff/{- Statens väg- och trafikinstitut (VT!) . 587 07 Linköping
V77
srtryck
_1 14 1986
The Laser Road Surface Tester (RSTi: synopsis
of presentations in Sydney and Melbourne,
A ustralia, March 1986
Dr. Peter W. Arnberg
w Väg"'00/7 Eff/{- Statens väg- och trafikinstitut ( VTI). 587 07 Linköping
FOREWORD
In March, 1986, Dr. Peter W Arnberg from the Swedish Road and Traffic Research Institute gave a lecture concerning the Laser Road Surface Tester in Melbourne and Sydney, Australia. Dr. Arnberg is the project leader for the Laser Road Surface Tester as well as its original developer. He has been working in the areas of road measurement and Pavement Management Systems for more than 14 years. This report has been compiled from tape recordings of the two lectures. Mike May
(CMPS), who was also responsible for arranging the lectures, has
produced the first draft. The second draft was produced after revisions of the original draft by Dr. Peter Arnberg and his wife, Dr. Lenore Negrin Arnberg.
CONTENTS
SUMMARY
I INTRODUCTION
2 THE LASER ROAD SURFACE TESTER 2.1 How the Laser RST Functions
2.2 Measurement Variables
2.2.1 Rut Depth 2.2.2 Road Roughness
2.2.3 Macrotexture
2.2.4 Crack Measurements
2.2.5 Cross profile and Curve Radius
3 THREE-DIMENSIONAL PROFILE MEASUREMENT
# HIGH SPEED BEARING CAPACITY MEASUREMENTS BY MEANS OF LASER TECHNIQUE
5 APPLICATIONS AND FUTURE DEVELOPMENTS - THE STOCKHOLM EXPERIMENT
6 CONCLUSIONS REFERENCES FIGURES, page 18 - 42 Page & O O O X I ON U b D k » 13 15 17
SUMMARY
The Laser Road Surface Tester is a laser based, computer-automated
system having the ability to process data at the same time it is being
collected at 90 km/h traffic speeds. As the results are speed independent, adjustment can be made to variations in normal traffic speed during data collection. The system is highly flexible and the results can be used either directly or as a data base in any pavement manage-ment system. The variables measured are the following:
Distress variables: 1) Rut Depth; 2) Evenness (Quarter-car); 3) Cracking; #) Rough Macrotexture; 5) Fine Macrotexture.
Serviceability and safety variables: 1) Evenness (Comfort Value); 2) Rut Depth in conjunction with Fine Macrotexture (Aquaplaning).
The system is built with a human factor design in mind which means that it is both easy to handle and maintain. For example, all units in the system such as computer cards, lasers, etc. can be exchanged in a few minutes when necessary. The system thus replaces low-quality, labor-intensive work with high-quality, economic measurement.
At the present time, the Laser RSTs are in operation in Sweden the United States and Canada. Experiences with these vehicles have, so far, been highly positive.
1 INTRODUCTION
Sweden, where the Laser Road Surface Tester was developed, is a country of some 8 million people and with an area approximately equivalent to about 60% of the state of New South Wales. It is approximately 1.600 kilometres long from north to south, which gives rise to wide climatic variations. The northern regions are sparsely populated, with the majority of the population concentrated in the southern sections, especially in the areas surrounding the cities of Stock holm, Gothenburg, Malmö and Uppsala.
The road network in Sweden covers a total of more than 400.000 kilometres. Two-thirds of the public roads, 98.000 kms, are metalled and more than 90% of them allow an axle pressure of 10 tonnes and a bogie pressure of 16 tonnes. Sweden has approximately 850 kms of motorways and 400 kms of freeways.
Therefore, although differing with regard to climatic conditions, Sweden shares with Australia many of the same problems in relation to the road network, i.e., a low population density, tightly controlled road financing, a maturing road system and a growing awareness of the need to achieve
maximum utilisation of each "road" dollar.
The Pavement Management System concept is currently being adopted around the world by road administration authorities endeavouring to find more scientific methods to apply to the problem of road maintenance. The need for systematic means of acquiring and processing information for maintaining paved roads is recognised as a critical component of any
functional PMS.
Much of the road condition data presently used as inputs into road databanks is acquired manually (either visually or by labour intensive individual measurement of road parameters). The consistency of subjective ratings (even amongst experienced highway engineers) was queried in Sweden some years ago, with extensive testing being carried out to check the reliability of such methods. The results indicated a low correlation between observers and even among individual observers over
time (results unpublished in English). In another related series of studies it was also found that objective instruments correlated highly with subjective ratings of comfort when large groups of subjects were used (Magnusson & Arnberg 1974; Magnusson, Arnberg, & Pettersson 1976). These results, thus, indicate the possibility of using objective measure-ments for the measurement of certain variables, which can be expected to correlate well with subjective measurements of the same variables. It was as a direct consequence of these studies that a program for the objective measurement of road surfaces and, eventually, the RST was developed. The aim of such a measurement program was the develop ment of a totally objective system capable of measuring various road ._ condition parameters at general highway speeds. The entire task of data collection was to be automated in one highly uniform, consistent system. In addition, the ability to detect road conditions not yet possible by means of current methods was to be developed. For several years now in Sweden, data from Laser RST vehicles and their predecessors (the
Saab-Scania mechanical contact systems) (see Figures 2-5) have been used to
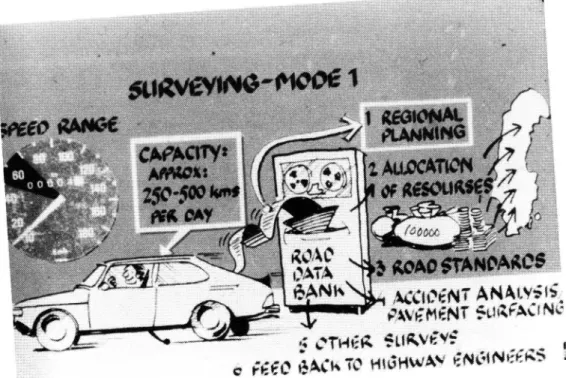
build a nationwide Road Data Bank (see Figure 6). Information therein is
used to formulate policies with regard to the following areas:
. Regional planning
Allocation of resources
Design of road standards
Accident analysis/pavement surfacing requirements Inputs into other types of highway-related surveys
0 \ \ J 1 : P \ ) J N *
2 THE LASER ROAD SURFACE TESTER
The Laser Road Surface Tester (RST) is a non-contact, objective system
for the measurement of pavement conditions and for pavement evalua-tion. The system was developed at the Swedish Road and Traffic
Research Institute (VTI), and is financed by the Swedish National Road
Administration. Separate companies have been established for informa tion dissemination and marketing of the RST concept outside Sweden. Today companies exist in the United States and Canada, which are jointly owned by the Swedish Government and private shareholders. In general, system development in the road measurement area in the past has consisted mainly of equipment design. As the equipment developed was often rather unsophisticated, little attention was given to the development of a user interface. Computer technology, however, has made it possible to design and develop highly sophisticated systems, many of which are purposely designed with user needs in mind such as facility of use and information quality. Such systems, like the RST system, are often highly comprehensive, covering the total range of activities from data registration and initial evaluation to data base management systems for the decision-maker. In order for such comprehensive systems to function from a technical, human, and social point of view, extensive interdisciplinary co-operation is essential. In addition to traditional disciplines representing the technical area, the team needs to be enhanced with experts on the functioning of the human. It must also include persons skilled in helping to solve problems related to the integration of the system into society, thus including not only technicians, researchers, and decision makers, but also businessmen and - lawyers.
2.1 How the Laser RST Functions
The Laser RST vehicle is a measurement system based upon the principle of non-contact laser sensing of the road surface (see Figures 7, 8A and
SB).
Continuous analysis and presentation of data is provided in the car during the measurement process. The measurements can be carried out at speeds up to 90 km/h (and for some variables, e.g. rut depth, at even higher speeds). Measurements are traffic-safe, objective, and are obtained at a low cost due to the high speed at which they are carried out as well as the fact that all variables are measured simultaneously.
The RST vehicle has also proven (over a period of some 5 years) to be
highly durable:
The Selcom AB (the Swedish manufacturer) laser units have been proven extremely reliable, their performance not being adversely affected by dirt, moisture or high road temperature.
All RST vehicles in the future will be equipped with the Hewlett Packard Integral Microcomputer System (a Unix-based, portable computer). This will facilitate easier servicing in the event of break down than was the case with the Swedish designed computer originally used. Programs will be in the C-language and this will also mean easy adaptation to specific user requirements. (At the time of publication the three Swedish cars are all already using the new HP computer and the new program. These three RSTs will measure approximately 30.000 km of road surface in Sweden during the summer of 1986 using the new system. During this work a unique method of identifying measurement units will also be used in which nodes from the Swedish Road Data Bank are stored on computer disks, in this way steering the road units to be measured directly from the vehicles.)
Data acquisition and processing is performed with the help of specially
designed Signal Processing Cards (SPCs), which are capable of operating
at speeds of 5 million instructions per second. It is this capability that allows real-time processing of data even at speeds of 90 km/h. Each variable measured by the RST is handled by a separate SPC, i.e., separate processing of parameters is carried out simultaneously. The processed information is then passed on to the "display" computer (the HP Integral), where it can be displayed immediately, printed out, and/or stored on floppy disks. The raw data is generally discarded after
processing, but may be stored if required. This would obviously result in large amounts of data being recorded, and would not generally be required.
2.2 Measurement Variables
The RST, in its latest operational configuration, is capable of objectively measuring the following parameters:
- Distance travelled Rut depth
- Road roughness (comfort as well as distress values)
- Fine and rough macrotexture - Cracking
- Cross profile and curve radius (when required)
If a skidometer BVll friction test trailer is towed behind the vehicle, it
is also possible to obtain friction measurements during survey exercises. A typical configuration consists of ll laser cameras mounted on a 2.6 metre wide frontbar with the two end cameras angled outwards to allow coverage of up to 3.2 metres road width (see Figure 9). A Laser RST, still having a 2.6 metre width, has been fitted with 13 laser cameras allowing for a coverage of up to 1+ metres. This vehicle has been developed for research purposes and will be tested during the summer of
1986.
The presentation of the measurement variables can be adapted according to measurement purposes and customer requirements. As the software is on floppy disks, new programs can easily be added by simply inserting a different program disk. Consequently, it is easy to adapt the output to any specific purpose at hand by carrying different programs in the car. This flexibility principle underlies a basic philosophy of the RST system. The hardware has been designed to serve as general a function as possible. The exact purpose which the RST will serve thus depends on the
software used. In this way continuous development is of importance to adjust the system to various specific user groups.
The individual measurement variables are described in greater detail
below.
2-2-1
Retlleetb.
The rut depth values are now (in most programs) determined by the differences between the values from the cameras in the Cross Profile
Sampler (CPS). A cross profile is produced for each sample and from this
a maximum rut depth is calculated (see Figure ll). The mean value of
the maximum rut depth for a road unit (the "object") is presented as well
as the percentage of the maximum rut depths exceeding a certain user-defined value, e.g., 10 and 20 mm (see Figure 12). The object distance can be determined by the operators, and represents the road distance for which a mean value is calculated. At 90 km/h, the sampling rate corresponds to approximately once every decimetre of longitudinal
distance travelled. Therefore, for an object distance of l00 metres (say)
the output would consist of one mean value for all 1.000 samples as well as the percentage of the individual sample maximum rut depths exceed-ing the above-mentioned figures.
The lateral position of the lasers relative to the ruts may result in a measurement error if the ruts are not flat at the bottom. Normally this measurement error is very small, but on certain roads where the ruts are especially deep, steeply inclined and where the rut bottom profile varies, the measurement error is sometimes of importance. Simulations and road
tests carried out in 1985 in order to further investigate this problem,
have shown that it is now possible to statistically compensate for the measurement error from the variance of the mean cross profile.
It would also be advisable in future survey programs to calculate more than the maximum depth of each rut. Even the whole cross profile could be stored. Programs that save entire cross profiles are already being used for special purposes. (During further developmental work during the
summer of 1986, the Swedish Road Data Bank will save whole RST cross
profiles every 20 meters (the mean of 200 cross profiles.)) Such a
measure would create a completely different opportunity to monitor road deterioration and assess the need for future maintenance measures. Whole cross profile measurements showing the variations between and within the ruts may indicate what is happening in the road body. This type of variation indicates, e.g., whether there is a bearing capacity problem or "only" wear from tyres travelling in the same wheel paths.
2.2.2 Road Roughness
Road roughness is perhaps the most salient variable in the road user's perceptual judgement of the road, i.e., comfort is a highly important road feature. The comfort value probably also correlates highly with many distress effects from vibration, e.g., damage to transported goods, wear on cars at different vibration levels, and extra fuel consumption. The comfort evaluation used in the RST was derived from comfort ratings provided by the results from experimental studies involving a large number of randomly selected road users. The users subjectively evaluated a variety of different roads while riding as passengers in cars, buses and trucks (see Magnusson & Arnberg 1976; Arnberg 1982 for a complete discussion of the comfort calculation validation procedure). The RST comfort value correlates highly with other international measures such as the Chloe. It is speed independent at speeds between 30 and 90 km/h and relatively speed independent at speeds between 5 and 30 km/h. The percentage of comfort values exceeding 6.5 is also presented as that value has been shown to be the maximum evenness value which road users accept (unpublished findings by Arnberg and
Magnusson) (see Figure 12).
At present, road roughness measurements are carried out in both wheel tracks in all programs. Only one mean value per road unit is presented, i.e., a comfort value where "l" is equivalent to a smooth road and "9" is equivalent to a rough road.
It may be preferable in the future to carry out between track measure-ments of road roughness. Instead of only providing a comfort value, the signal could also be divided into different wavelength bands. Such an analysis would facilitate a follow-up of the changes in the longitudinal surface characteristics of the road over time in a better way than is being provided by existing programs. Some types of changes in the amplitude at certain wavelengths probably indicate bearing capacity problems. It is speculated that the condition of the road structure near the surface can be determined by the shorter wavelengths while deeper structural problems are indicated by the longer wavelengths. A program for wavelength analysis already exists but has not yet been integrated into the general program.
In the most recently developed vehicle, a roughness distress measure-ment variable has also been developed for the U.S. market, namely quarter-car. In the U.S. the measure is used as an indicator of how vehicles and roads influence one another and as a means of prognosticat-ing the road's lifespan.
2.2.3 Macrotexture
Macrotexture influences many aspects of road performance. The measurement of macrotexture may facilitate the control and prediction of problems related to road, tyre, vehicle, and driver performance.
In the Laser RST, macrotexture is described by two measurement variables: "rough" and "fine". Both parameters are based on longitudinal sampling of the road surface. "Rough" macrotexture covers that part of the profile including wavelengths from lO to 80 mm. "Fine" macro texture covers wavelengths under 10 mm and is a measurement of the stone content in the pavement surface.
The RST calculates a root mean square (RMS) value for each of the
above variables every l metre. The RMS values are grouped into different classes so that a distribution (based on the RMS value) can be presented. Mean values and classes can also be provided for any road unit
(see Figure 13 for a sample printout with explanations and Figure IL; for the results of reliability measurements).
Measurements are presently being made in both wheel tracks, but this can be changed to suit user requirements. Four sampling points might be more suitable, as macrotexture can vary over the width of the road.
2.2.4 Crack Measurements
The RST provides information about a sample of the road surface. No attempt is made to count every crack. Such a procedure would be prohibitively expensive, time-consuming, and rather unnecessary.
A sample is representative of the whole road surface and is assumed to have properties similar to that surface. Information gained from the sample should thus be the same as information gained from any other section of the road. The field of statistics is, to some extent, concerned with determining the validity of a sample from an entire unit. The use of samples to obtain information about an entire population is the basis of statistical methodology.
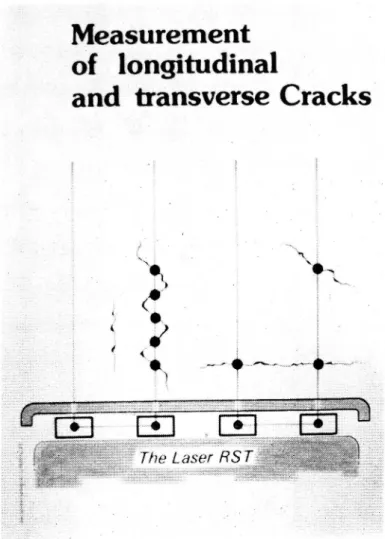
The understanding of this point is basic to an understanding of the RST crack measurement procedure. It does not count every crack because it does not sample the entire road surface. It samples only those sections that are beneath the four combination laser cameras which could measure both cracks and macrotexture. These four lasers are mounted at strategic locations (two in the tyre tracks and two towards the middle of the road). The operator can specify 3 width and 2 depth categories for the computer to use as crack size limitation areas resulting in six categories of crack size. The cameras are connected in pairs and a crack recorded within a specified distance by both cameras is considered as transversal. It may be suitable to add additional crack measurement cameras in the future. This will provide greater sampling of the road surface and increase the statistical validity of the crack sample.
10
The RST crack values give an indication of the severity of road cracking.
They also give an indication of what size cracks (within the user
determined limitations) are most prevalent (see Figures 15-18). The
identification of cracking patterns by an objective measurement technique such as the RST can be thought of as a problem relating to the correlation of identifiable sampling patterns with classifications made manually on test survey sections. The relationship of frequency of cracks per camera with comparisons between adjacent cameras (i.e. the frequency and distribution of cracks in a given distance) would be used to identify cracking patterns present in the road surface. Obviously, exten-sive testing would be necessary in order to implement appropriate pattern recognition systems in different geographical environments.
2.2.5 Cross profile and Curve Radius
A non-gyro system has been developed for measurement of cross profile and curve radius with the Laser RST. The system is easy to handle and reasonably inexpensive. It consists of an inclinometer which measures the vehicle's side angle and speed, and the curve radius is used to compensate for side acceleration. This system could also easily be used
ll
3 THREE-DIMENSIONAL PROFILE MEASUREMENT
Work to improve the Laser RST system with regard to longitudinal
profile measurements is in progress. A laser plane system (RST LP) for three dimensional measurements has been developed (see Figure 19A and B). The RST LP uses two external, stationary signal transmitters. These transmitters are placed relative to a known fixed point (the reference point to which all data is related). The RST-LP has two receiving masts that allow the central computer to continuously determine the exact location of the RST relative to the fixed reference point. This process provides the RST-LP with the necessary information for the accurate calculation of both longitudinal and cross profiles. This will make it possible to carry out profile measurements with even higher precision than is presently the case on roads, in addition to on airfields and bridges. The system will also be used in Sweden for the calibration of roughness and rut depth measurement carried out by means of the normal programs. (Of course other simpler calibration systems are also being used for all variables in the Laser RST.)
The RST-LP system is capable of high accuracy under good weather conditions. Because the system can be affected by fog, rain, high winds as well as by strong sunshine without any winds, measurements are best carried out at night, however. This can be quite suitable when surveying runways at busy airports.
12
# HIGH SPEED BEARING CAPACITY MEASUREMENTS BY
MEANS OF LASER TECHNIQUE
The methods so far described concern surface characteristic and surface detorioration measurement. Currently'research is underway aimed at locating structural problems when the road is in a critical state but has not yet deteriorated to the point of breakdown.
Work has been initiated and is now well advanced using two sets of eleven laser cameras, one preceding and uninfluenced by a wheel load and one directly following a rolling wheel load. The differences between the profiles taken before and after the rolling wheel load will, if handled statistically correctly and with frequent sampling, show the rolling load influence on the road surface. Extensive three dimensional simulations of the road body and investigations of how various loads, speeds and temperatures influence the road body are an integral part of this
exercise. The results will, hopefully, in the near future be used to
construct the Laser Road Deflection Tester. The first test vehicle is planned to be completed by the end of 1986 (see figure 20A and B and
figure 21).
The implications of this area of research as an extension of the Laser RST Technology will be highly significant to the road maintenance community. The applications of the Laser Road Deflection Tester can be
summarised as follows:
Diagnosis of pavements before failure actually occurs
Location of potential trouble spots for deflectometer survey
Feedback to pavement engineers for designing better pavement types
F
P
N
Analysis of variations in pavement response under varying conditions (temperature, wetness and dryness conditions, during varying time
periods, etc).
13
5 APPLICATIONS AND FUTURE DEVELOPMENTS -THE
STOCKHOLM EXPERIMENT
The RST system is not a static concept but can be characterised by the ongoing development and increasing sophistication which has marked the first five years of its history. This is demonstrated by projects such as the Stockholm Experiment.
During the summer of 1985 a series of extensive correlation/comparison
and evaluation studies were carried out using four laser RST vehicles and various other types of profilometers and pavement condition measuring devices. Forty highway engineers were also involved in subjective ratings of various road parameters. The location for these activities was approximately 90 kms of roads in and surrounding the capital city Stock holm. The work also will continue during 1986 and 1987 during which time roads from other parts of Sweden will be included in the study. Although the aims of the Stockholm Experiment are wide-ranging, one of its principal goals was to determine how outputs from different measur-ing devices relate to the RST outputs. A Finnish device with eleven
bicycle tyres and a width of 3.5 metres was, e.g., used and it correlated
reasonably well with the Laser RST (see Figure 22). The correlation was of course stronger, however, between two of the Laser RSTs (see Figure 23).
The Laser RST was also compared with other instruments for rut depth profile measurements (see Figure 24. For outprint in 1986, see Figure
25).
One other result emerging from the study, which undoubtedly warrants further investigation with less restriction of range in the variable, was the correlation between macrotexture and friction measurements. It is considered likely that, given improvements in the measurement tolerance of the laser cameras, it will be possible during the next few years to directly ascertain some friction values as another parameter of RST surveys.
14
Another foreseeable development of the system might be the inclusion of satellite navigation equipment in the vehicle to facilitate "mapping" of the survey route, and to allow checking of road location information as input by the operators. If the system is then equipped with video (digital) and a deflection tester a total system for road survey will be available. The advantages to be gained through joint research and sharing of knowledge between RST users become apparent when considering the above possible areas of development. Despite the considerable resources and the rather large amounts of funding currently being invested in the RST project, the VTI researchers cannot hope to apply themselves to all these areas at once, nor can they simulate different climatic and geographical conditions which may be relevant to individual users. It is thus necessary that an international cooperation with researchers abroad takes place. This will also undoubtedly prove to be highly stimulating and will perhaps be the ground for truly international traffic research work
15
6 CONCLUSIONS
In order to be able to move away from subjective measurements towards more objective measurements of road surfaces a great emphasis should be placed on developing measurement systems for roads. The importance of interdisciplinary work in this area is being increasingly recognised. This will not only benefit the road measurement field but society as a
whole.
At one level the RST is a complete system. It is functionally independent and requires no support in order for it to be able to provide its inform-ation. This of course does not mean that the quality of the system cannot be substantially improved through further development. At another level, however, the RST is part of a larger system. This larger system requires data from the RST in order to provide information necessary for road maintenance and road use at the societal level. The development of this larger system is still almost in its infancy and an extensive amount of work has yet to be carried out, e.g., experiments and statistical studies of relationships between RST variables and economically important variables such as fuel consumption, vehicle degradation, etc. Experience and development must be incorporated into this system and it must be integrated with the road and transport systems of other countries.
The advantages of the RST system can be summarised as follows: - Flexibility in programs and hardware
- Safety of use in normal traffic Ease of operation
- Ease of maintenance
- Synthesis of outputs to a format which can be more readily comprehended and used than that provided by other systems
- Reliability
- Objective uniform data collection of many variables
Direct access to data
The system is extremely flexible in that it gives the user the freedom to choose and adapt variables to individual requirements. Presentation and
16
storage of data can be modified for specific needs. This approach to system design was selected in order to allow the RST to be easily used on an international basis, thus allowing the development of a broad research base involving an active exchange between cooperating countries.
Because the RST vehicle is no wider than the average truck, it is quite safe to use in typical traffic conditions without the need of escort vehicles, etc. The operators need not be highly skilled nor is there a need for lengthy training periods. A self directed computer training program is currently under development in order to minimise costs in connection with training.
All components of the measurement system can readily be replaced in event of malfunction, and spare parts are carried in the vehicle as a normal procedure. The first 5-6 years of operation have shown the system components to be highly reliable, and productivity would not normally be adversely affected by component failures.
In a time of increasing utilisation of technology and a growing awareness of the cost/benefit advantages to be gained by automating labour intensive practises, the Laser RST points the way in which the road maintenance community must go. It is, in effect, a tool for a totally new methodology whereby roads will be built and maintained in the future.
l7
REFERENCES
Magnusson, G. and Arnberg, P.W. The rating and measuring of road roughness. VTI Report 83A, 1976.
Magnusson, G., Arnberg, P.W. and Pettersson, H E. Mätning och bedöm-ning av ojämnheter på grusväg. (The rating and measuring of road
rough-ness on gravel roads.)* VTI Report 123, 1977.
Arnberg, Peter, W. The influence of Road Roughness on Driver Perform-ance and Fatigue. A paper prepared by Dr. Peter W. Arnberg for the conference "Truck connection" at The University of Michigan, Ann Arbor, January 24 26, 1982.
18
View of the Swedish Road and Traffic Research Institute, which is the center for interdisciplinary traffic research in
Sweden. Fi ure l
19
»ng»M xw m
The Saab RST with its 26 arms with rubber tyres for rut depth measurement.
Figur 2
Profile of the Saab RST showing the fifth wheel for measurement of friction and roughness (1-9 comfort scale is the same as is used in the Laser RST.
20
ST and the hydraulic system p and down quickly.
on the Saab R
The gyrosystem Fi ure 4
21
The Laser RST was rst produced in 1981. This is the first vehicle sent to the U.S. in 1984.
22
Figure 6 Drawing covering the planning of the
RST project and the
use of the results from the middle ot" the 1 9705.
w ,,, 7.. ,,. .,. .,m ,,» ,,, 9
Figure 7 The laser light spot on the road surf
ace is projected on a light-sensitive displacement sensor.
Electrical signals representing vertical position and light intensity of the la
ser spot are recorded and computer processed.
23
Two of the first Laser RSTs used in Sweden in 1982.
tmmmfww mq
the United States
The latest Laser RST developed for use in and sent there in 1985.
24
Figure 10 Road distance transmitter (pulse transducers) and laser units fitted on vehicle. Notice the angled out lasers on the sides of the vehicle which increase the measurement range with-out making the car's width greater than that of a normal
truck.
81
32
F'g A Straight edgeS 7
82
83
E;
Wire surface87
SZ
Figure 11 Cross profile measurements for individual samples. The rut depth is the largest value of Si, SZ, 53, etc. Figures A & B represent two different currently methods being used.
Measurement examples
*** Laser Road Surface Tester ***
* i
* National Road & Traffic Research Institute *
* *
* 1984 02 23 Timo: 11:46 a
*** w. 5 . 00 annt
Straight edge method
g :O w w m w w m o m w w m o w o m Rut >16 >2 100 14.6 108.a 0 200 35.1 1Q8.0 0. 8 0 0 y ' V u 400 15.1 iQB.O 500 15.2 l00.8 538 15.4 i00.0 ma m m a s o m a o m o a . . . . . . . e o o m o o m o o a m c o x o a o w o m : 9 0 0 0 9 6 0 m o o m o a g Object = 1 Length = 538 m Readnr = : From = OOOAGOI.QB + Sm Towards= 0009002.00 Speed= 76 Km/h Roughness= . >é.5= Rutdepth= ) 10mm= ... (_D -Q O D G O Q O Q O O O D O H O U ] )( _ >2mmw Hang = Crack = wear = XX X X X ; Mean profile : 0.0 6. Deviation : 0 0 0 o c o o e o g o o m o o o m.,
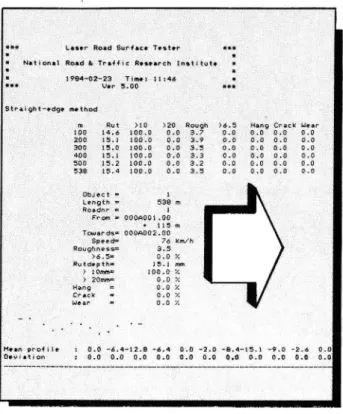
Printed output from a survey measurement
25
Object no:
Number of measurement object,
auto-matically counted from 1 to total number of objects
Measured length: Length of object Road no:
Identification of road where measurement occurs
From:
Intersection or other reference point at which distance measurement starts
" + 115" indicates the length from reference
point to start of the actual measurement Towards:
Intersection or other reference point towards which measurement is heading
Speed:
Average speed at which object is measured
Roughness:
Serviceability index on a nine-grade scale where "nine" represents a highly uneven road >6.5:
Percentage of object which has a service-ability index greater than 6.5. This limit can easily be changed
Rut depth:
Rut depth as measured, see separate sheet for principle
>1O mm, >20 mm:
Percentage of object which has a rut depth more than 10 mm respective 20 mm. These limits can easily be changed
Hang, Crack, Wear:
Manually registered parameters given in terms of percentage of occurrence in an object
Figure 12 Printed output from a survey measurement showing
26
Macrotexture output from Laser RST:
V 0.2 0 3 0.4 0.6 0.9 1.3 2 0 3.0 5 0 rms 0 2 0.3 0 4 0.6 0.9 1 3 2.0 3 0 5.0 macro 1 rough 0.61 0 O 8 55 31 5 1 0 0 0 fine 0.32 0 35 61 5 0 O 0 O 0 0 macro 4 rough 0.83 0 0 2 30 37 26 6 0 0 0 fine 0.66 O 0 O 59 31 8 2 0 0 0
! Root Mean Square (RMS) macro 1 and macro 4 refer to the
specific laser camera and rough and fine refer to the
type of macrotexture that was considered. The RMS value
provides information almost identical to a standard
dev-iation, the difference being that the RMS value is in
terms of the units being measured in this case millimeters.
! These 10 categories are in millimeter units. The information
provided is the percentage of the road surface with a
macro-texture within that range. For example, 35% of the road
surface fine macrotexture measured by laser camera 1 was
between 0.2 and 0.3 millimeters.
Figure 13 Macrotexture output from Laser RST. Root Mean Square (RMS) - "Macro 1" and "macro 4" refer to the specific laser cameras and "rough" and "fine" refer to the type of macro texture considered. The RMS value provides information almost identical to a standard deviation, the difference being that the RMS value is presented in terms of the units being measured in this case millimeters.
These lO categories are presented in millimeter units. The information provided is the percentage of the road surface with a macrotexture within that range. For example, 35% of the road surface fine macrotexture measured by laser camera i was between 0.2 and 0.3 millimeters. 1986 years verSion.
B
o
b
b
0
1
2
»
( D L D L o s e r R S I 2 \_ j9
9
9
,
0
9
9
,
0
9
9
N u t -[ 5 0 1 0 7 Figure 14 27MA CROTEXTURE RELIABILITY
(r = .99; p <= .OO1) D EJ ED DO U D |:] En D DD D D T I I I I I I I r r I r r I 0.2 0.4 0.6 0.8 1 1.2 1.4 Loser RST 1Macrotexture reliability. Results from repeated measure-ments with the macrotexture measurement system on actual
roads in the United States (r = .99; p <= .OOl) (road unit : 100 meters)
28
asurement
of longitudmal
_
and 1_fansverse CraCks
Figure 15 Measurement of longitudinal and transverse cracks. Illustra-tion of the four macrotexture and crack measuring lasers on
29
Sample output from the Laser RST
Crack count from Laser RST:
| | | | | | | | | | |
- The crack count for each of the four cameras ! Three width categories (3 6mm, 6 12mm, 12 50mm)
! Two depth categories (3mm and 6mm)
Macrotexture compensation factor for this measure (1.0)
> 3.0 6.0 V --> 3.0 6.0 12.0 3.0 6.0 12.0 both MC < ! 6.0 12.0 50.0 6.0 12.0 50.0 100.0 1.0 1 40 23 5 1 3 3 2 17 13 5 0 0 0 8 4 97 54 22 1 1 7 3 18 9 3 1 1 1 14 ! ! ! ! ! ! ! ! ! ! ! ! ! | ! ! g | |
i
! ! ! ! ! ! ! ! ! ! Area (mm) within which cracks counted by separate cameras-will be considered the same crack (counted only once)
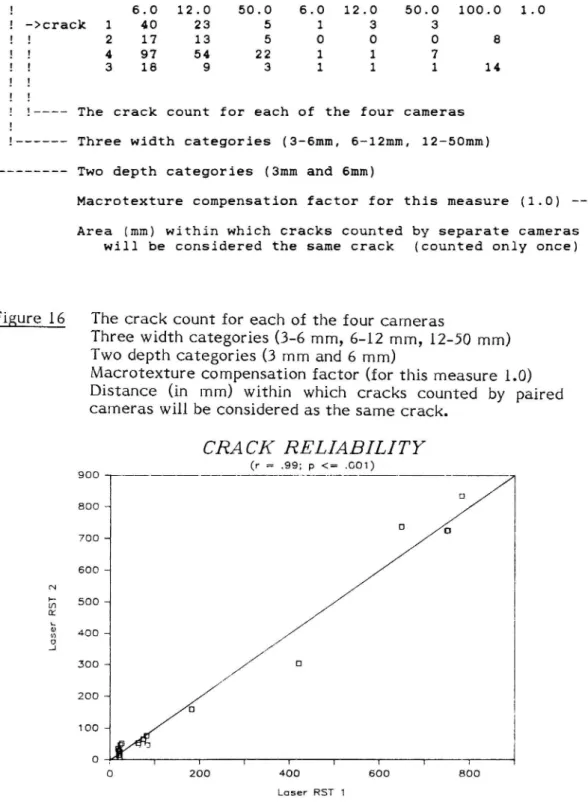
Figure 16 The crack count for each of the four cameras
Three width categories (3-6 mm, 6 12 mm, 12-50 mm) Two depth categories (3 mm and 6 mm)
Macrotexture compensation factor (for this measure 1.0) Distance (in mm) within which cracks counted by paired cameras will be considered as the same crack.
GRA CK RELIABILITY (r = .99; p <= .001) 900 D 800 a D D 700 -1 600 5 soo . (I
& 400 s
3 300-1 ////// D 200 D 100 -0 1 n | | r 1 T T 0 200 400 600 800 Loser RST 1Figure 17 Crack reliability. Results from repeated measurements with
four crack measurement cameras. (r = .99; p < : .OOl).
Correlations with manually measured cracks and with sub-jective ratings are also high (er=O.82 and 0.92
30
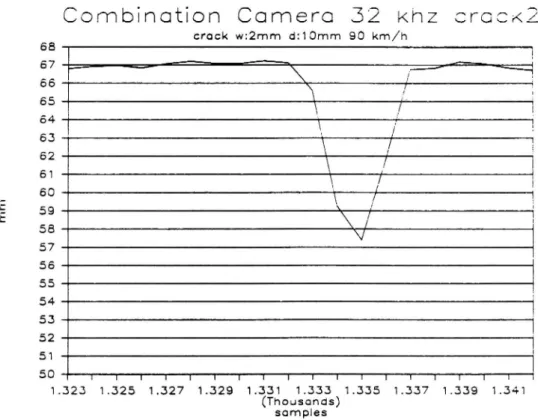
Combination Camera 32 khz
crack w:2mm d:10mm 90 km/h 01 (I) J r n m Ul Ul (n Ul Ul Ul 01 01 CD m 01 01 01 :> Ul 01 xJ (I ) (D (J » M (A ;> U! 0) ( n U | ( n ( n t. ) _» N u O (12 0&1 (16 O.8 1 1.2 LA 1.6 LB 2 (Thousands) samplesFigure 18A Cracks measured in simulated conditions by the laser
camera. At 90 km/h cracks with a width of less than 1 mm can be measured.
Combination Camera 32 KhZ crac-A2
8 crack w:2mm d:10mm 90 km/h 6 67 66 65 64 63 62 61 60 59 58 57 56 55 54 53 52 51 50 1.323 1.325 1.327 1.329 1.331 1.333 1.335 1.337 1.339 1.341 (Thousands) samples r n m
31
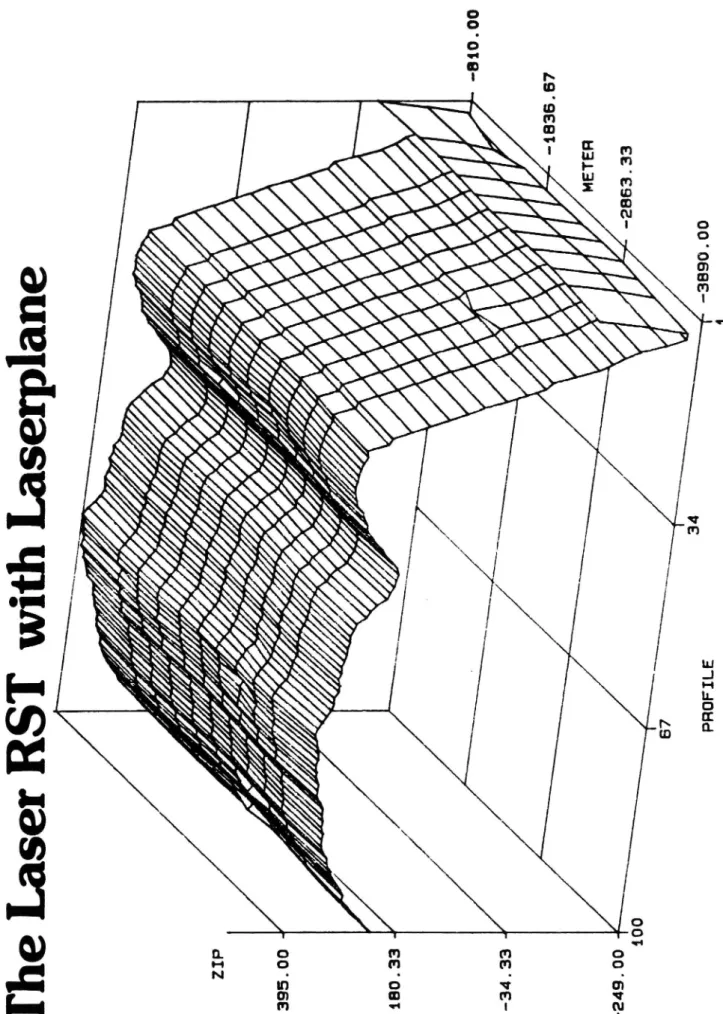
The Laser RST
, with Laser Plane
Laser Plane
Lase r Pl an e
Figure 19A RST Laser Plane System. Each of the eleven individual laser readings are related to a fixed coordinate system relative to the runway. Rotating laser transmitters stationed on the runway generate a horizontal and a vertical plane which are used as references. The laser transmitters are self-levelling and powered by 12 V batteries. Two receiver masts are mounted on the Laser RST which detect the laser planes on distances up to 1000 meters. The vehicle's vertical move-ment will not effect the height measuremove-ments since A+B+C will always be the distance from the laser plane to the measured surface.
Figure 19b
Th
The dimensional measurements with the Lasere
La
se
r
R
S
T
wi
th
La
se
rp
la
ne
,
N7
7
Wy
/Z
?¢
;¢
é%
gz
gz
gi
ga
b
\-N~
NN
**
*-~W
WW
\
*~
N
~
'
'
-/
/
/
%
%
%
W
W
W
/
'%
%
%
/
395
'00
d
/
//
//
%
%
./
///
///
M
/
W
W
M/
%
/
%
/ / / ~ /34
.3
3
J
-e
49
.o
o
+ 10
0
57
-~
W
W
\
P R O F I L E/
/-81
0.
oo
My
3233
Hllllll lllll
_ _ ? © © © \ \ X T Hw
a
©©
©
l lIHHIIIIIIIJ
[
WIIIIIHIIIIWI ?
_?
© HU
>
(
&_J
'x.[
Kw
\\\**
LJ '
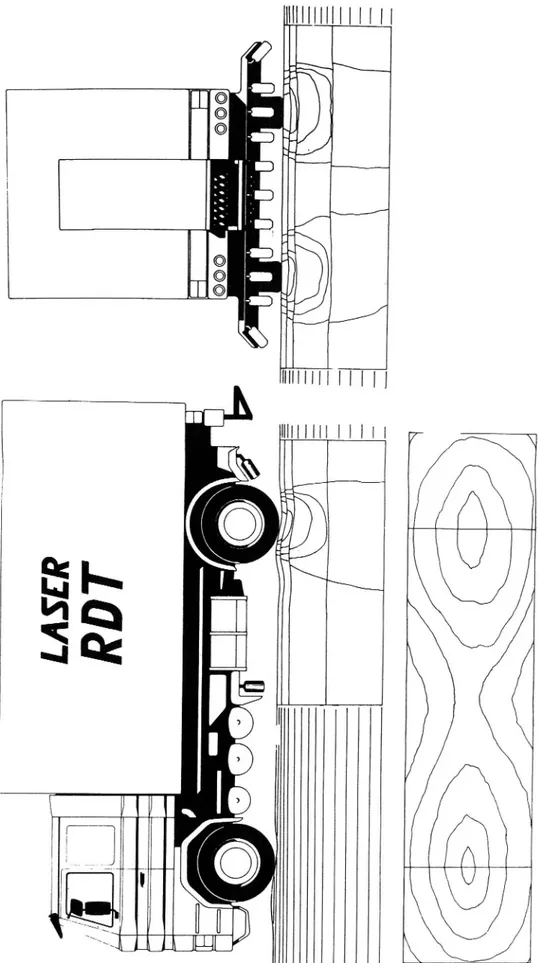
...iFigure ZOA Bearing capacity measurement under development at VTI.
An early drawing of the Road Deflection Tester (RDT)
illustrating the measurement principles involved.
34
Figure 20B Bearing capacity measurement under development at VTI.
An early drawing of the Road Deflection Tester (RDT)
35
EM) (static simulation of
). Dynamic simulation has from this been carried
he high speed deflection tester should
Photograph of finite element (F
half a tyre
out to find out how t be constructed.
Fi nnis h me as ur em ent ve hi cl e Lase r RS T vs. 36 []
u n
n
_
[J EJ E] [1 51:1:|
CD u
D
..
:|
|: IE
0 Du
*
IJ DD EPIQJ ElE?
El
|:
_
u åå
'='
:P
[J l l l l l I I 1 l !eaaaaasezeen
°
alatqu luawaJnseaw qstuutj
w
<5
ll
II>1
Figure 22 The Laser RST compared with the Finnish measurement vehicle having 11 bicycle tyres and a width of 3.5 metres.
16
20
24
28
(m
m)
12
La se r RS T r = 0. 8 137
Laser RST 1 RUT DEPTH
M
24 22. 20' 18. 16" 14! . 12' J J 4 aJ
§=13.8
Y=1.00X+0 .02 Figure 23 T 18 i 20 22 24. » Laser RST 2mmTwo laser RSTs compared with one another. The VTI i was of the old type with a measurement width of 3.1 metres and
the VTI 2 had a measurement width of 3.2 metres. The
38 mm " 20 10 -0 "G _ _ ,___ ---'1-|== _ mar- 47:21:
.10 "
°
. .
. . '
. . ) . '20 "" o o ' . n 9 0 . - PRIMALEN' STRAIGHT EDGE BAR O VTI RST
x 1 l I I 1 ;
100 200 300 350mm
Figure ZL; The drawn line represents the "primal", a slow, highly accurate laser-steered unit and the dots represent an other mechanical device. The round circles represent the Laser
RST. The results generally showed good agreement between
39 GI S) ubjeCt Object 12 From node 68528114 Start at 226 m To node 68528116 Road Num 6762 Lane 1 Length 26 m Heasured 26 m Speed 48 km/h Gear IRI 2.7 mm/m HO 2.2 miies/1666 Rut Depth 14.8 mm >16.6mm 88 % >26.6mm 13 %
Mean transverse profile (om)
..1 6123458778816 Camera ean Prof 6.6 11.1 -8.2 3.8 2.5 -4.4 11.8 13.7 12.7 -8.2 6. Dev Prof 6.6 5 8 4.8 4.4 3.9 3.3 3.2 3.3 3.4 2.4 6. 2.6 4.6 1.6 2.6 3.6 4.6 2.6 3.6 2.6 3.6 4.6 26.6 3.6 4.6 6.6 Crack 1 8 2 6 6 6 6 2 1 6 6 6 6 6 6 Crack 3 1 6 6 6 6 6 4 6 6 6 6 6 6 6 6.6 6.2 6.3 6.4 6.8 6.8 1.3 2.6 3.6 5.6 RHS 6.2 6.3 6.4 6.8 6.8 1.3 2.6 3.6 5.6 ---Macro 1 Rough 6.98 6 6 6 5 8 52 5 6 6 6 Fine 1.68 6 6 6 15 71 31 21 6 6 Macro 3 Rough 6.86 6 6 6 88 31 6 6 6 6 6 Fine 6.54 5 21 16 31 31 6 6 6 6 6
Figure 25 Printout from the Stockholm Experiment. Measurements are stored every 20 metres on computer disks. The variables measured were: Rut depth (maximum value and whole profile); roughness (Quarter-car and MO; roughness
measurements used in the U.S.); cracks (# lasers);
macrotexture with 2 lasers. (For explanation of figure, see
Fi ure 26 Schematic skiss over the Laser RST.
LA
SE
R
R
S
T
RO AD SU RF AC E TE ST ERRE CT IF IE R BA TT ER IE S FO R C O M P U T E R HP co mp ut er D C / A C C O N V E R T E R M E A S U R I N G UN IT L A S E R E L E C T R O N I C S wi th ke yb oa rd , di sp la y / SP C UN IT an d pr in te r. / Co ul d be sw in ge d to X ] ba ck se at . .1 IL IE . X ' ' .X \\ o . & \ axx. \\ / fx ,'kxl \\ ») 0 xs /\ I ' \:__ '¢ G E N E R A T O R N
A C C E L E R O M E T E R In kl in om et er L
f-
ET." ST AR TE R BA TT ER Y FO R G E N E R A T O R A C C E L E R O M E T E R . (q ua rt er ca r) DI ST AN CE R E C O R D E R LA SE R SU PP OR T B E A M40
41
;: . ...
EHA
..- |'
Figure 27 The width of the rectangle indicates the critical rut depth, in this figure 10 mm. The width of the grey rectangle shows the measured rut depth.
42
The Laser RST Principle
©! 'ggszm'§%:%g
)å' '_t' . ' ,'.,_v_ & _ B* A"; ' '( a , . .,i '&' (' ', å ' .' .. ;.s '94 ' & b . ' . ' ; x '_ ..E . . .: . - » _? ( &_ _ . : .," __ _. I." , ',,- '_4 _, _ .. .-r"\ k->, , _, .. . . ,,