Faculty of Landscape Architecture, Horticulture and Crop Production Science
Farmers’ perceptions of climate change
– A quantitative study of Scanian farmers
Lantbrukares uppfattningar om klimatförändringar
– En kvantitativ studie av skånska lantbrukareJohan Tejler
Degree Project • 30 credits Agroecology - Master´s Programme Alnarp 2019
Farmers` perceptions of climate change a quantitative study of Scanian farmers
Lantbrukares uppfattningar om klimatförändringar en kvantitativ studie av skånska lantbrukare
Johan Tejler Supervisor: Co-supervisors:
Examiner:
Johannes Albertsson, SLU, Department of Biosystems and Technology
Anna María Pálsdóttir, SLU, Department of Work science, Business economics and Environmental psychology
Kristina Blennow, SLU, Department of Landscape architecture, Planning and Management
Credits: 30 credits Project level: A2E
Course title: Master’s Thesis in Agricultural Science/Agroecology Course code: EX0789
Programme: Agroecology – Master’s Programme Place of publication: Alnarp
Year of publication: 2019
Online publication: http://stud.epsilon.slu.se
Keywords: farmers perceptions, climate change, questionnaires, IPA, adaptation, Scania
SLU, Swedish University of Agricultural Sciences
Faculty of Landscape Architecture, Horticulture and Crop Production Science Department of Biosystems and Technology
Foreword
During my previous Bachelor in Geography, at the University of Gothenburg, I had the oppor-tunity to visit interesting places and interact with local farmers. I did not know it then, but perhaps a seed to this master thesis was sown during that time. For two weeks we travelled the Chinese countryside and interviewed farmers about their opinions on climate change. It was an unforgettable experience and my interest in agriculture and particularly sustainable develop-ment issues was deepened and there to stay. The next excursion went to Uganda where we were instructed to set up our own mini-project, over three days. Me and my colleague were full of enthusiasm and wanted to examine whether the rural population in the area felt that their stand-ard of living had improved or deteriorated over the years. The encounters with the locals were rewarding but the distances to cover, by foot, were long and we only had time to interview six farmers. As I had finished my Bachelor, I was delighted to discover that a program existed, which was devoted to those issues I found most interesting from my previous studies. This was the master program in Agroecology, at the University of Agricultural Sciences, SLU, Alnarp. During the program I have met people from different parts of the world and with different ed-ucational backgrounds, which has very much enriched the studies and created a stimulating and diverse study environment. We have learnt about many relevant aspects of agricultural devel-opment and, most importantly, to embrace a holistic perspective on the issues we study, the Ecology of Food Systems. The encounters with farmers have continued, and it has been among the most developing and rewarding experiences of the program. However, I have kept that small stitch of frustration I picked up already in Uganda. I wanted to investigate more and be able to tell what a large group of farmers think about a particular topic. Therefore, this thesis has been a natural and satisfying closure of my studies, where I finally had the time and resources avail-able to carry out a quantitative investigation of farmers’ opinions on climate change. It has been an interesting experience where I have substantially improved my capability to plan and con-duct a larger study and learnt a lot on how to construct and analyze questionnaires. At the end of my work, I now feel ready to take the step out in the “reality” and apply my knowledge to real life working conditions. With confidence I look forward to devoting my career to issues that really matters, the development of a sustainable agriculture.
Acknowledgements
First and foremost, I want to thank my supervisor Johannes Albertsson for his unfailing support with this project. He has devoted much more time and energy than he was obligated to do and always helped me finding solutions to challenging tasks. I also want to thank my co-supervisor, Anna-Maria Palsdottir for her very valuable advice with the questionnaires and her positive attitude to my work, throughout the course of the study. She has always believed in me and the idea, which feels comforting during time of doubts. I further want to thank Erik Steen Jensen for encouraging me to start this project and for giving feedback during the course of work. My office colleagues Chris and Alexandra for linguistic advice and nice company and Agnetha Carlberg for providing me the office space and necessary equipment. I want to thank my friend and former classmate, Vimbai, for her support and her feedback on my work. Your proofreading has definitely improved the quality of the thesis! I also send a thank you to my parents and siblings for support, encouragement, feedbacks and ideas.
I am very grateful to Partnerskap Alnarp who has provided me with funds for this project, with-out which I could not have conducted it. Also, I am thankful to Länsstyrelsen in Scania who has shown an interest in my work.
Lastly, I want to direct a great thank you to all the Scanian farmers who has participated in my study. I am very grateful to all of you, who, regardless of the stressful conditions of a hot and dry summer, have taken your time to answer my questions!
Abstract
In this thesis, farmers` perceptions of climate change have been examined. Questionnaires were sent to 400 cereal farmers in the southernmost county of Sweden, Scania, of whom 221 replied. Four themes have been investigated: the farmers perceptions on past climate changes, their perceptions on future climate changes, their opinions on how the authorities are managing the climate change issue and their opinions on adaptation to climate change.
Study results indicate that 9 out of 10 farmers had experienced some type of climate change over the last 15 years. The most common notion was that the climate has become more “periodized” and that winters have become milder. As many as 97% of the farmers thought that the climate will change during the coming 30 years, but only 67% believes that temperatures will rise. There are different opinions on whether climate change will be mostly positive or negative for agriculture in Scania, although most of the farmers think that the negative consequences will dominate.
Most respondents think that the amount of information they receive from authorities, about climate change, is satisfactory. However, the majority thinks that the quality, or relevance, of the information is poor. They also think that more should be done in Sweden in order both to mitigate- and adapt to climate change. Large differences occur about the opinions on the EU-membership, in light of climate change, but most respondents are positive towards the membership.
Nine out of ten farmers have already started to adapt to climate change or consider doing so. The adaptations preferred by most farmers concern water management. Both improved drainage and expanded irrigation are seen as relevant adaptation measures. Many farmers also consider “reduced soil disturbance” as an adaptation measure to climate change. When it comes to crop choice, it seems as most adaptations are done as preventive measures to reduce risks rather than to take advantage of new opportunities.
The results of this study indicate similarities to other studies. In relation to farmers in other contexts i.e. in developed nations, the Scanian farmers are generally more aware of climate change. In some regards the farmers expectations for future climate change are in line with scientific predictions for Scania, but for other aspects, there are discrepancies. The farmers tend to underestimate the future temperature rises but overestimate the increase in periodized and more extreme weather.
The current study can be of good value for the authorities engaged in agriculture and climate change related issues. To possess knowledge of the farmers` opinions may facilitate the cooperation between authorities and farmers. This is an aspect of high importance from an agroecological viewpoint, where good communication and integration of different actors in the food system web, is emphasized.
Table of contents
1 Introduction ... 8
1.1 Aims and objectives ... 9
1.2 Research questions... 9
2 Background ... 10
2.1 Climate change ... 10
2.1.1 Natural climate change ... 10
2.1.2 Anthropogenic climate change... 11
2.1.3 Farmers and Climate change ... 12
2.2 Agroecology ... 12
2.3 Scania ... 13
2.3.1 Geography of Scania ... 13
2.3.2 Climate of Scania ... 14
2.3.3 Agriculture in Scania ... 14
2.3.4 History of Scanian agriculture ... 15
3 Materials & Methods ... 16
3.1 Data source ... 16
3.2 Selection of respondents ... 16
3.3 Population- and selection characteristics ... 17
3.4 Timeline ... 18
3.5 Questionnaire design ... 18
3.6 Descriptive quantitative analysis ... 20
3.7 Interpretive Phenomenological Analysis, IPA ... 20
3.8 Tag clouds ... 21 4 Results ... 22 4.1 Research question 1: ... 22 4.2 Research question 2: ... 25 4.3 Research question 3: ... 31 4.4 Research question 4: ... 35 5 Discussion ... 40
5.1 Reliability and validity ... 40
5.2 Response rates & generalizations ... 41
5.3 Response analysis ... 41
5.4 Research question 1 ... 42
5.6 Research question 3 ... 45
5.6.1 Information ... 46
5.6.2 Prevention, mitigation and adaptation ... 46
5.7 Research question 4 ... 47
5.8 Reflection of working process ... 50
6 Conclusions ... 51
7 References ... 52
8 Appendices ... 59
8.1 Appendix A ... 59
1 Introduction
Climate change is one of the major concerns in today’s society. It has become, perhaps, the most important environmental issue, both globally and in Sweden (Steffen et al., 2015). A lot of resources are spent both on how to predict future changes accurately and on how to mitigate climate change (IPCC, 2014). Efforts are also being made to convince people of the seriousness of this issue since many people still are sceptical towards the alarming future scenarios scientists are predicting (Hart & Nisbet, 2011).
Agriculture stands in the centre of the complex issues of climate change, for at least two reasons. Firstly, one of the major concerns about future climate change is that agricultural systems will not be able to produce at the same level as today because of changing conditions, mainly drought (Rosenzweig et al., 2013). Secondly, agriculture is a key factor in mitigating climate change. Depending on how agricultural systems are designed, they can either significantly enhance or mitigate climate change (Gliessman, 2015). This property is emphasized within Agroecology (ibid), the discipline within which the current thesis has been conducted. Additionally, even though the effect of climate change upon agriculture globally is predicted to be negative, it seems likely that some regions can benefit. Northern Europe, and thus Scania, is such a region where yields may increase (Bogren, Gustavsson & Loman, 2014).
Agriculture has gained a lot of attention in the climate change debate and research. However, one aspect which may not have been covered to the same extent is the farmers` attitudes to climate change. Such information is important for several reasons. It is important for authorities to know what the farmers think and believe, to achieve an efficient cooperation between the parties. (Grimble & Wellard, 1997). If this information is not provided, bad communication, misunderstandings, mistrust and inefficient utilize of resources are very likely to occur (ibid). Furthermore, it is likely that authorities can learn from listening to the farmers` stories. Their knowledge about the land and their observations of the climate can contribute with important information in this puzzle that climate change mitigation and adaptation is (Thompson & Scoones, 1994). To facilitate such communication and mutual learning between different actors in the agricultural sector, to achieve more efficient and sustainable systems, is an important part of Agroecology (Gliessman, 2015).
Farmers` perceptions of climate change has been investigated before. However, a lot of the studies are performed in developing countries (Temesgen et al., 2009; Truelove et al., 2016), which render them precarious to apply to other contexts. Of the relatively few studies performed in developed nations, following can be mentioned; (Barnes & Toma, 2011; Battaglini et al., 2009; Nguyen et al., 2016). These are conducted in (i) Scotland, (ii) France, Italy and Germany and (iii) Italy. A qualitative study (Rodriguez, 2015), with 16 respondents, has also been conducted in Scania, the dominating agricultural county of Sweden. Therefore, there is a scope for a new study in Scania, with a quantitative approach.
1.1 Aims and objectives
The overall aim of the current study has been to gain knowledge of Scanian farmers` perceptions of climate change. Scania is chosen based on its central role in Swedish agriculture e.g. more cereals are produced here than in any other Swedish county (SCB, 2018a) The study has been conducted with a mainly quantitative approach, which in this case means that a relatively large number of respondents (farmers) has been approached with standardized questions, from which the answers are possible to analyse statistically and to some extent generalize for a larger group of people. Results which can be generalized can be valuable for establishing an understanding of how large share of certain groups holds a certain opinion (Trost, 2001).
In more detail, the aim has been to examine the farmers` perceptions of climate change aspects that can be of value for the scientific community and authorities. To gain knowledge of how farmers perceive the authorities work with climate change, in combination with which adaptations they find relevant, can be of direct use for authorities, extension workers and researchers. Moreover, the farmers` perceptions of past and future climate change are also relevant in order to better understand how they remember and understand the past and how they picture the future. Thus, the questions in the questionnaire (Appendix A) are centred on these four themes,
(i) Perceptions of recent, past climate change, (ii) Expectations for future climate change,
(iii) Attitudes towards authorities work with climate change
(iv) Opinions on relevant and feasible adaptations to climate change.
1.2 Research questions
1. To what degree do farmers believe that the climate has already changed? 2. To which extent do farmers believe that the climate will change in the future?
3. What are the farmers` opinions towards the authorities work with the climate change issue? 4. To which extent has farmers begun to adapt to a changing climate and which type of
2 Background
2.1 Climate change
Climate change refers to the phenomena that climate on Earth, and for different regions, can change (Bogren, Gustavsson & Loman, 2014). It is one of the global environmental issues of highest concern (Steffen et al., 2015). The topic is highly debated and covered by media. For a long time, it has been known that the climate can change and has done so in the past. The fact that human activity could potentially lead to climate change has also been known. However, the extent to which the climate has changed since the onset of the industrial revolution has been debated and even more so which effects human activity will have on climate in the future. Today, the great majority of scientists agree that the emissions of fossil carbon to the atmosphere has started to change the climate and that it will continue to change (Bogren, Gustavsson & Loman, 2014).
Even though scientists are now virtually certain that humanity has affected the climate on Earth and that this change will continue, there are great uncertainties regarding to which changes and effects that will be seen in the future. This uncertainty is due to the complex nature of climate and weather. Each parameter can be understood by itself, but interactions between many parameters makes it difficult to produce exact predictions (Bogren, Gustavsson & Loman 2014). Some important parameters are unknown, as future emissions, population and land use which makes it impossible to state exactly how the situation will develop in the future. Currently, different scenarios exist and some of the scientific debate is focused upon which of these that are most likely to occur. The Intergovernmental Panel on Climate Change, IPCC, used a new type of scenarios called RPC:s (representative concentration pathways), for their fifth assessment report, which are named after the radiative forcing they will achieve, compared to preindustrial levels. From low to high radiative forcing the scenarios are: RCP 2.6, RCP 4.5, RCP 6 and RCP 8.5 (SMHI, 2014a)
2.1.1 Natural climate change
There are many factors which can lead to “natural” climate change. It has long been known that climate on Earth has varied greatly throughout the planet’s history (Heckman et al., 2001). Some of the factors which change throughout time, and can affect the climate, are; Earth’s orbit around the sun, solar output, volcanic activity and continental drift (Bogren, Gustavsson & Loman, 2014).
For the last 2.5 million years, the earth has been in a state of cyclical periods of glacials and interglacials. We are currently in an interglacial period, as the last Ice Age ended about 10 000 – 12 000 years ago (Bogren, Gustavsson & Loman, 2014). The time span of these cycles has varied but has consisted approximately of a cold period of 80 000 – 90 000 years and a warm period for some 10 000 years (ibid).
The greenhouse effect is a fundamental conceptual component in climate change theory. The greenhouse effect refers to the warming of the Earth that is achieved by different gases in the
atmosphere, mostly water vapor but also CO2 and other molecules as methane and nitrous oxide (Jones & Henderson-Sellers, 1990; Schmidt et al., 2010).
The natural greenhouse effect is so strong that Earth would be inhabitable without it. Without any greenhouse effect at all, the average temperature on Earth would drop from around 15º C to -33º C (NASA, 2018; Schmidt et al., 2010). The Swedish scientist, Svante Arrhenius, presented his theory that higher atmospheric concentrations of CO2 would lead to higher
temperatures, in 1896. The calculations he made do not deviate substantially from modern estimates (Bogren, Gustavsson & Loman, 2014).
2.1.2 Anthropogenic climate change
Since the early 20th century it has been suspected that human activity could influence climate (Bogren, Gustavsson & Loman, 2014). In fact, it was known much earlier that this could be the case, but then only at the local or regional level, as literature from the Antiquity explains (Neumann, 1985). In the 1950s, evidence started to appear that anthropogenic climate change was on its way, globally, but no concern was raised at this point. It has been proven since the 1960s that atmospheric CO2 levels are rising, approximately with the same quantities emitted
from combustion of fossil fuels (Keeling, 1960). It was not until 1988, when the American climatologist James E Hansen, participated in a hearing of the US senate, in which he testified that human activity was changing the climate, that the issue arose as one of the most prominent environmental issues on the global agenda (Bogren, Gustavsson & Loman, 2014). The hearing coincided with an unusually strong heat wave and drought which made it thoroughly exploited by media (ibid).
The Intergovernmental Panel on Climate Change, IPCC, was founded the same year, 1988, and has since then, published updated reports with the latest scientific evidence and predictions for future climate change and its effects. The latest report was published in 2014 (fifth assessment report) and the next will be published in 2022 (IPCC, 2017).
The enormous attention that anthropogenic climate change has gained in the last decades is explained by the fact that climate change will affect, agriculture, wildlife, cities, and many other areas. It is estimated that effects will mostly be negative (IPCC, 2014). For example, agricultural production may, in many areas, decline due to climate change (Rosenzweig et al., 2013) and especially due to water and heat stress (Bindi & Olesen, 2010). Natural ecosystems are likely to face such significant changes that a loss in biodiversity is unavoidable (Bellard et al., 2012) and sea level rise may pose severe challenges on coastal communities, among those, many of the world’s largest cities (Hinkel et al., 2014).
The Kyoto Protocol, from 1997, was the first major international, binding agreement on reductions of greenhouse gas emissions, GHG, (ibid). It has been commended for its success of establishing an agreement but even more criticised for its shortcomings to reach any substantial reductions in the emissions of GHG. (Rosen, 2015).
At the United Nations, UN, climate conference in Cancun, 2010, it was decided to strive to prevent the global mean temperatures in 2100 to exceed the global mean temperatures of
preindustrial levels with more than 2º C. This was believed by experts to be an acceptable change with not too strong impacts on societies and ecosystems. Since then, it has been questioned whether this 2º target can be reached and most experts now strongly doubt it (Tollefson, 2015; Rockström et al., 2017).
In Dec 2015, the Paris agreement was reached. This was the first major treaty for limiting climate change that includes all major nations (UNFCCC, 2018b). The parties agreed to take measures to limit global warming to well below 2º C, above preindustrial levels and to aim at even lower, 1.5º C (ibid). This prompted the IPCC to prepare a special report on the effects of 1.5 degrees C warming. It was released in October 2018 (IPCC, 2018).
2.1.3 Farmers and Climate change
Farmers are heavily dependent on the weather for their farm operations (Rosenzweig et al., 2013; Ashenfelter & Storchmann, 2014). They are adapted to a certain climate and chose their crops and type of orientation accordingly. Climate change can bring new challenges, as well as opportunities (Bogren, Gustavsson & Loman, 2014). Even if climate change, at a certain location, appears to be positive for agriculture, it may still be challenging to adapt to new conditions, fast enough. Farmers are often thought of as rather conservative (Swanson, 2015). Perhaps, this conception is deceptive, as they can also be innovative (Coughenour, 2003). The attitude towards climate change is a topic where these contrasting characteristics can be examined. As conservative, farmers can be expected to be sceptical towards climate change, which has also been proven by some research (Haden et al. 2012) but due to their dependence on the weather, they are also forced to accept climate change and adapt to it, to be able to continue farming successfully (Howden et al. 2007).
2.2 Agroecology
This study is conducted within the discipline of Agroecology. Agroecology is been defined as “the ecology of food systems” (Francis et al., 2003). It has also been described with the following words; “In Agroecology we move from a narrow concern with farming practices to the whole universe of interactions among crop plants, soil, soil organisms, insects, insect enemies, environmental conditions, and management actions and beyond that to the effects of farming systems on surrounding natural ecosystems” (Gliessman, 2015). It is a broad discipline concerned with sustainable development of agriculture and emerged as a response to the development of “industrial agriculture” after World War 2 and onwards (ibid). In many regards, the development of mainstream, or “industrial”, agriculture has been successful (elevated yields, less heavy manual labour, etc) but it has come with negative side effects to the environment and people (Pingali, 2012). Some of these effects include: air and water pollution, soil degradation, diminishing biodiversity, unsustainable consumption of fossil fuels and fresh water, cancer risks for agricultural workers and other health risks (as a result of inappropriate diet as well as food contaminants) for consumers (Horrigan et al., 2002).
Agroecology has not only evolved as a response to such problems, but also as a solution (Gliessman, 2015). Viewing agroecosystems as a whole, holds premise to detect and address potential negative consequences of agricultural practices (ibid).
In Agroecology, much of the attention is directed towards the management of the agroecosystem, but also aspects outside this sphere are recognized as highly important for a successful development of a truly sustainable agriculture. Market structures, consumer behaviour, values and ideas of both producers and consumers and similar features are of great importance to understand the prevalent situation and be able to move towards a more sustainable utilization of resources and land (Francis et al., 2003).
As opposed to mainstream agriculture, quite a lot of attention in Agroecology is directed towards traditional knowledge of small-scale farmers, in Latin America for example (Gliessman, 2015). Such practices can, sometimes complemented with modern research and technology, be very sustainable and often produce good yields (ibid). Although a population which has not been studied to the same degree is farmers in developed nations. Especially, not if they are considered “mainstream” and don’t know anything about agroecology. It is likely that if this knowledge gap (the opinions of farmers in developed nations) is addressed, it can facilitate the transition towards a more sustainable agriculture. as the knowledge of different stakeholders` opinions are important for achieving efficient cooperation and development (Grimble & Wallard, 1997). Thus, the current study will contribute to reach some of the objectives relevant in Agroecology.
2.3 Scania
2.3.1 Geography of Scania
Scania is the southernmost county in Sweden. It covers 10 939 km2 (SCB, 2012)(equivalent to
Lebanon or Jamaica)and has 1 322 193 inhabitants (SCB, 2017). County is the administrative level below national level, in Sweden. The population of Scania make up about 13.2% of the total population of Sweden (SCB, 2017). Although the county itself makes up only 2,4% of Sweden´s total area. This makes the population density of Scania much higher than the national average.
The current land use is partly determined by the physical geography and geology. As most of Sweden, much of Scania is covered by moraine soils. Although the parent material of the soil can be of different origin. This is apparent in Scania where the soils to the southwest has a much higher content of particles eroded from the sedimentary bedrock of the former Central European plate. This bedrock is rich in limestone resulting in very fertile, heavy moraine-clay/clay soils of southwestern Scania. Moraine and clay soils in other parts of Scania are not as fertile (Germundsson & Schlyter, 1999). These conditions are important to recognize in order to understand why agriculture differs spatially within the county and in the end to why such a large share of the respondents in this study are located where they are.
2.3.2 Climate of Scania
In Scania, on average, the mean annual temperature is around 7 º C. The mean annual
precipitation is around 650-700 mm (Germundsson & Schlyter, 1999). The interior, northern parts of the county are considerably wetter and colder than the southern and coastal areas (ibid). The vegetation period is around 270 days in the southwest and around 230 days in the northeast (SMHI, 2018a).
2.3.3 Agriculture in Scania
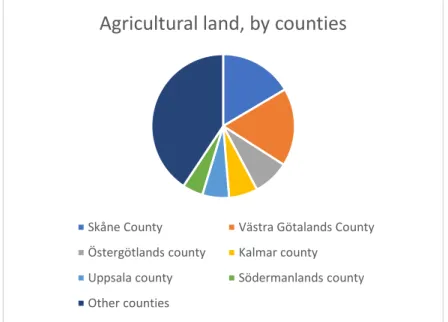
Scania is Sweden´s leading agricultural county, in many regards. The most productive soils in the country (actually some of the most fertile in the world) are found in this region, at Söderslätt, (Germundsson & Schlyter, 1999) and 16% of Sweden´s crop lands are located in Scania (2007) (see figure 1) (SCB & Jordbruksverket, 2011). Agricultural land inclusive of pasture and meadows covers about 50% of the surface of the county which is a higher share than for any other Swedish county (ibid).
Figure 1: Share of Sweden´s total amount of agricultural land, divided by counties. Only those counties with highest share are named, the rest are put together as “others”. Västra Götaland has slightly more agricultural land than Scania but is more than twice as large. SCB & Jordbruksverket, 2011.
Around 25% of Sweden´s total production of cereals is carried out in Scania. The Scanian production share for potatoes is 47% of the national total. As for sugar beets, which is an important crop at a national level, Scania totally dominates the Swedish production with a 96% production share (SCB & Jordbruksverket, 2011).
Scania also has a high number of agricultural enterprises (farms), counting 8196 with 10541 employees in the agricultural sector; the highest number of any Swedish county (ibid).
Agricultural land, by counties
Skåne County Västra Götalands County Östergötlands county Kalmar county
Uppsala county Södermanlands county Other counties
2.3.4 History of Scanian agriculture
Agriculture in Scania, as in Sweden in general, has gone through many profound changes with time, especially in the postwar era.Many of these changes are relevant in the context of climate change mitigation.
As the agricultural sector has modernized, it has become more efficient in terms of required working hours to produce a certain quantity of goods. The share of the population active in agriculture has declined from around 25% in the 1940s to less than 2% at the beginning of the 21th century (Flygare & Isacsson, 2003). The total area of agricultural land has also declined, but not to the same extent. As a result from mechanization, it has become possible for a single person to cultivate more land than was possible earlier.
External inputs of synthetic fertilizers and pesticides has also increased. For Sweden, on average, the amount of synthetic nitrogen fertilizers applied by hectare increased from less than 10 kg in the 1940s to over 100 kg in the end of the 1990s (Flygare & Isacsson, 2003).
Over the last decade there has been a trend towards a more environmentally friendly agriculture, as a result the use of pesticides has declined. In addition, different strategies to transform agriculture into a more sustainable system, such as precision agriculture (Lindblom, et al, 2016) and organic agriculture (Jordbruksverket, 2017) have spread. Despite this, the demand for few farmers to cultivate large areas remain.
3 Materials & Methods
Questionnaires were used to collect answers from farmers all around Scania. The questionnaires were sent to 400 respondents. Three methods have been used to analyse the retrieved data. Descriptive, statistical analyses of quantitative data have been made using Excel and Interpretive Phenomenological Analysis (IPA) has been conducted for the qualitative questions. Tag clouds has been used as a complementing method on the same questions as the IPA.
3.1 Data source
The approach used in this study necessitates an information source with contact details to possible respondents. Such a file was compiled by Statistiska Centralbyrån and Jordbruksverket in 2016; and it was used as the only information source about the respondents, throughout this study. The file is very extensive and contains all businesses somehow involved in the agricultural production sector, in Sweden. Personal data has to be handled with care. All answers has thus been processed anonymously and the use of the file has been in line with the regulations that was in place when the file was used to contact the respondents. Regarding “sensitive” questions, it was assessed that no estimation by a third part had to be made as this is not necessary for master students who conduct studies with more sensitive questions, regarding health, etc.
3.2 Selection of respondents
The delimitation of respondents (selection process) was made in five steps tallying to the same number of selection criteria.
1. The first delimitation is geographical. Only those who are located within the county of Scania were selected. The advantages to use the county level as delimitation is that a reasonable share of the whole population (all farmers who fulfil the criteria set for the study) (Trost, 2001) can be approached. National level could have been chosen but in that case only a very small share of the population could have been included, which would bring implications for the interpretation of the results. County level is then a good choice, as most statistics about agriculture is presented on this level.
2. The second delimitation was based on working hours. Only farmers who were assessed to work full time (or close) were included and therefore the minimum number of working hours per year was set to 1600. The file contained categories based on working hours, which is the reason to why 1600 hours, in particular, was chosen as delimitation. The reason to include only full-time farmers was to create a somewhat homogenous population of farmers who had farming as their main occupation.
3. Based on the same reasoning, only farms operating on more than 10 hectares were included. It is possible to have a full-time farm business on less than 10 hectares but then the
crop choice is generally of another type than what was aimed at, according to the next step in the selection process.
4. The third delimitation concerned farm type. It was decided to focus on those who are mainly cereal farmers. To do so, it was important to understand the classification system used in the file. A publication called “Rapporter från lantbrukets företagsregister 2000 (Reports from the agricultures register of businesses 2000) was used for this purpose (Jordbruksverket, 2000).
The businesses are divided into three levels. Main type (huvudtyp), Base type (bastyp) and
Detail type (detaljtyp). For an illustration of how the included categories were selected, see
appendix B. Included categories are marked as bold and italic. Of 38 possible categories covered in the file, 7 was included in this study.
When the delimitations had been made, the respondents who fulfilled all requirements were randomly sorted. The selection was of a type called unbound randomized selection (Trost, 2001). This new sheet contained the whole population, all persons who fulfilled the certain criteria outlined above (Trost, 2001). The population was 1055 people. From this population, the selection of respondents was made. It was decided to contact 400 farmers, which corresponds to 38% of the total population.
5. The last delimitation was to exclude those businesses which did not have contact
details for a specific person. As they were interspersed with the ones with personal contact
details, it was decided to just skip those without contact details and continue through the list until 400 respondents were reached. As around one fourth of the posts in the list lacked contact details (these includes not only private, smallholders but also operations such as Alnarps property and Findus), the counting went on up to post number 522, where 400 respondents was reached.
3.3 Population- and selection characteristics
The respondents are based all over Scania but some municipalities are much higher represented in the material since the agricultural sector is not equally important everywhere. The contrast is largest between the southwest, where agriculture is very common, and the northeast where much more of the land is forested (Germundsson & Schlyter, 1999).
Scania is divided into 33 municipalities (Region Skåne, 2018) and 29 of them were represented among the 400 farmers who received questionnaires. Those not represented were: Burlöv, Osby, Örkelljunga and Perstorp. Although Burlöv is located in the otherwise intensively cultivated region of southwestern Scania, it is the smallest commune in Scania (covering only 19 km2), of which much of it is urban. The rest of the non-represented municipalities are neither small nor heavily urbanized and are located in the north/north-eastern part of the county where agriculture, especially crop production, is not very common any longer. A municipality such as Skurup, smaller in size than Örkelljunga, is represented 21 times among the 400 respondents
and Örkelljunga is not represented once illustrates the spatial differentiation of agriculture and land use in Scania.
3.4 Timeline
The questionnaires were sent to all 400 respondents, accompanied by an introduction letter, in the beginning of June, 2018. About 3.5 weeks after the first wave of questionnaires were sent, a remainder to all who had not yet replied was sent. It contained a new copy of the questionnaire as well as an adjusted introduction letter, stressing the importance of the need of as many as possible responds. The collection of answers finalized the first of September. Before the second wave of questionnaires were sent (the first and only remainder) around 140 questionnaires had been received back. The following days a few more were received, which suggests that around 145 respondents answered on the first consignment and the rest, about 75 respondents, answered on the remainder.
3.5 Questionnaire design
A questionnaire is a tool that researchers use to gather information about people’s opinions on something. Questionnaires can be said to be a sub-class of interviews, with the important distinction from other type of interviews that the respondents of questionnaires do the work of noting the answers themselves (Trost, 2001). This method has been in use for over 200 years and can be an efficient way to gather data from a large number of respondents (Bernard, 2006). As a sub-class of interviews, questionnaires can be described as structured, as all respondent are exposed to the same stimuli (questions) (Bernard, 2006). Questionnaires have some important advantages compared to other type of interviews. They are considered cost and time effective; especially if the respondents are spread over a larger area (Ejlertsson, 2005). They also eliminate the “interviewer effect”, which is a well-documented phenomenon where respondents adjust their answers to how the interviewer behave. That can be an important benefit if the aim of the study is to remove possible bias (ibid).
The type of questionnaire used in this study is the mailed questionnaire (Trost, 2001). The design was based mainly on recommendations from two books, Enkätboken (The questionnaire book) (Trost, 2001) and Research methods in anthropology (Bernard, 2006).
An important distinction can be made between predominantly quantitative and qualitative questionnaires (Trost, 2001). In reality, most questionnaires contain elements of both types (ibid). Quantitative questions are those which can be analysed statistically, involving numbers. Different scales are used for the respondents to consider. The ratio scale has equal distance between the scale steps and contains a well-defined zero point. Most questions used in this questionnaire use an interval scale. It’s similar to a ratio scale, without a zero point. Another scale, used to a limited degree in this study, is the nominal scale. The alternatives cannot be ranked from low to high and does not have an equal distance to each other (ibid). Qualitative
questions, on the other hand, is when scales and numbers are avoided. Usually these questions are answered by the respondent, in her own words (Trost, 2001).
The questionnaire used in this study leans more towards a quantitative approach. The data gathering process was generally quantitative, since most of the questions were answered by choosing a number at an interval scale. In addition to the questions of quantitative nature, there were qualitative elements in the data gathering process, the questions where respondents are supposed to answer in their own words.
As for the quantitative questions, they were also analysed quantitatively. The qualitative questions are analysed qualitatively and to a certain extent quantitatively. A qualitative analysis would focus on why people think as they do. Yet, a quantitative analysis focuses on how large share of the respondents who reason in a certain way (Trost, 2001).
Most of the questions consisted of a scale from 1-7, where only 1 and 7 are labelled with a text description (the normal procedure when dealing with as many alternatives as 7) (Bernard, 2006). In the middle of the bar is number 4, which stands for neutral. At one direction number 1, 2 and 3 are found and 5, 6 and 7 represents the other direction. For example, question 7a demands the respondents which types of climate change they expect in the future, where 1 stands for colder, 7 stands for warmer and 4 is neither, neutral.For other questions a ratio scale is used and there is no neutral point in the middle (question 5a and question 6a).
The questionnaire consisted of 20 main questions, some of them with sub-questions. It may take up to 30 min to complete, depending on the respondent. The questionnaire had four parts, one for each research question, but it is not obvious, from the layout, to see where a new section starts. In addition to the main questions, there are four introducing background questions about year of birth, number of years as a farmer, geographic location (within which municipality) and farm size. Their inclusion has a twofold purpose. Firstly, to accustom the respondent to the process of filling in the questionnaire, giving them a “smooth” start (Trost, 2001). Secondly, they can be used as parameters in the analysis of the answers. The questionnaire can be found in appendix A.
Two important terms related to questionnaires are population and selection.
• Population refers to the all people who fulfil all the different criteria’s to be included as respondents in the study (Trost, 2001). It is important to define the population carefully so that no doubt exists about who is included and who is not. One must also find data of the population to know its size. Once the population is defined, thereafter follows a selection.
• In some cases, the whole population is included in the selection but that is generally too expensive and not necessary (Ejlertsson, 2005). Depending on different factors such as the size of the population, the budget and time budget of the study, etc. The selection can be of different size, everything from just a few percent of the population to the whole population is possible. The fundamental notion is that the selection should represent the population. To generate a representative selection, an unbound, random selection is done. The computer does this by choosing respondents randomly from the
population. There are also other types of selections which can be motivated in some cases, but these are not covered herein.
3.6 Descriptive quantitative analysis
Most of the results were possible to visualize in diagrams. The data from the questionnaires was firstly, transcribed into Excel and thereafter, different calculations and analysis could be made. In most cases, it is displayed how large share of the respondents that chose the different answer categories. The data could very well be used for further statistical analyses, but this was excluded based on time limitations.
3.7 Interpretive Phenomenological Analysis, IPA
IPA is a method for analysis of text. It was chosen to analyse the answers on questions were the respondents replied by writing with their own words. To include such questions was desirable as it appeared to be difficult to capture all aspects of the respondent’s opinions (about the chosen topics) otherwise. Naturally, answers on such questions cannot be processed in the same way as for the questions with pre-chosen answer alternatives, i.e. 54% or 68% thinks that it will be considerably warmer in the future, etc. The respondents expressed themselves in many different ways and to produce exact figures from these questions was not considered relevant. Instead, the aim has been to elicit the themes that was found in the respondents’ answers. IPA is thus a suitable method for such a purpose.
The method is used to construct themes from the answers of several respondents (Smith, 1999). This is suitable in the case of this study since the respondents of the free text questions often are around 100, rendering deep and careful analysis of each respondents’ exact use of words, and so on, overwhelming. Instead, the aim was to examine whether any common themes in their answers could be identified. According to the procedure described by Smith the answers of each respondent are read through and comments are written down in the marginal. These comments do not have to be constructed in any particular way. It can be reflections of how the respondent reason and/or key words that seems important. Since the answers processed in this study often are very short, it was not relevant to elaborate too much about how the respondent reason, what their motives or feelings are in relation to the subject. From an answer of two words, like “milder winters”, it is simply not possible to draw too many conclusions about the respondent. On the other hand, the number of answers processed in this work is considerably higher than in most cases where IPA is used. These two circumstances governed the tailor-made adaptations of the method (Smith, 1999) presented below.
1. For each respondent key words were drawn in the marginal. Sometimes it was just a copy of the respondents’ own words, sometimes the constructed key words where different from those used by the respondent. The general aim at this stage was to make sense and give the material some structure. The attempt to construct themes directed the creation of key words
in a homogenous way. Responses which contained very similar information were assigned identical key words. However, that could not be done naturally in this first step as it was not yet known how to label the key words in a structured way.
2. When all answers had been accompanied by comments, mostly key words, another column in the marginal of the paper was used to construct themes out of all these comments and key words. At this stage it became clearer what information the answers contained and it was generally easy to group very similar key words together and construct a common theme out of it. However, caution was taken not to group words together which could have different meanings. A good example of how this worked in practice is the presence of the key words “milder winters” and “warmer winters”. One could argue that they have slightly different meanings, but my assessment was that they are close to identical and thus they were all grouped together under the label “milder winters”.
3. When themes had been created, the next step was to investigate whether the themes could be grouped into “superordinate themes”. In some case this was easy, in some cases it took some elaboration and discussion with colleagues to create superordinate themes which made sense. After superordinate themes had been created, the outcome was the final illustration of the IPA, a sheet with information of the respondent’s opinions, displayed in three different detail levels, superordinate themes, subthemes and dimensions.
3.8 Tag clouds
To complement the IPA, tag clouds were used to visually display the frequency of different themes in the respondent’s answers. IPA does not illustrate how common the different themes are and it was desired to somehow examine this aspect, in a similar way as done for the quantitative questions. The subthemes constructed for the IPA was copied into a blank sheet and written the same number of times as they occurred in the material. For example, if milder winters occurred 11 times, it was written 11 times in the blank sheet. This body of text was then copied into a tag cloud generator. The tag cloud generator counts the words and display them in a new figure, in different sizes according to their frequency (Heimerl et al., 2014; wordclouds.com, 2018).
4 Results
The results are ordered after each research question. Meaning, for each of these four sections, the different methods of analysis are included. The first section describes how the respondents perceive past climate changes. The second section presents their opinions about future climate changes. The third section concerns the farmers` opinions on the authorities work with climate change and the fourth section present the farmers views on adaptation to climate change. The response rate of the study was 55.3%, which equals 221 received questionnaires. Four of these were not filled in, as the respondent had either died, moved or quit agriculture. Additionally, three questionnaires could not be included in the study as they were received just before the finalization of work. Unfortunately, 17 of the received questionnaires had been printed without back page which means that those respondents only had opportunity to answer half of the questions. As 7 received questionnaires could not be used (see above) 214 respondents were included in the study and of these 197 had the opportunity to send back a complete questionnaire. The average year of birth for the 400 chosen respondents was 1961 and the average year of birth for those who replied was 1959. The year of birth span was from 1918-1997, for the whole selection and from 1929-1991 of those who responded.
4.1 Research question 1:
To what degree do farmers believe that the climate has already changed? (Question 5.a and 5.b in the questionnaire)
5a. Have you noticed any changes in the climate over the last 15 years?
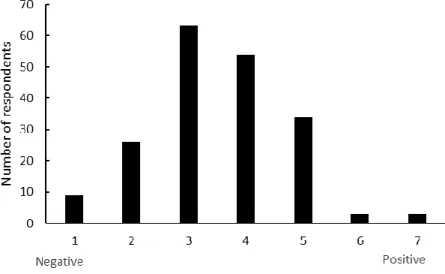
Figure 3: Perceived magnitude of climate change over the last 15 years. Category 1 means no changes and 7 means large changes. Number of respondents: 209.
A great majority of the respondents (92%), report having noticed at least some degree of changes. Category 5, which equals “considerable changes”, gathers the highest number of
respondents. The least amount of answers are found in category 7, which stands for large changes.
5b. If you have noticed any changes in the climate over the last 15 years, which are they? Table 1. The IPA table illustrates important themes in the respondents` replies, in three different detail
levels, with regard to question 5b.
Superordinate themes Subthemes Dimensions
Climate changes Warmer climate Milder autumns and winters,
generally warmer, earlier harvests
Changing patterns Periodized weather,
droughts and rainy periods, different winds, drier springs & summers
Extreme & unpredictable weather
Heavy rains, droughts, unpredictable, never
“normal” conditions for long periods, fast changeovers No climate changes No perceived changes Most years normal, no
changes in such short time span
Natural variations Climate has always varied, normal yearly variations
Two superordinate themes appeared for this question, those who perceived that they had experienced climate change, climate change, and those who had not, no climate change.
Climate change
Three subthemes emerged: warmer climate, changing patterns and extreme and unpredictable
weather.
Warmer climate: two closely linked dimensions of this subtheme were milder autumns and
milder winters. In most cases, they were not reported together by the same respondent. Milder winters was reported to a higher degree by older farmers than younger ones. One respondent states that; “Milder winters. December and January significantly milder and almost no amounts of snow. The southern climate zone has migrated northwards, for sure.” Another dimension was just generally warmer. Some respondents explicitly reported warmer summers or warmer springs, but this was not very common. The dimension earlier harvests, which is a result of warmer climate, was also found several times in the material.
Changing patterns: this subtheme expresses changes that can be seen as some type of
“patterns”, but which are not explicitly related to warmer climate. A very common dimension is periodized weather which mostly relates to precipitation patterns. The respondents believe that long dry periods, “droughts”, and long, rainy periods have been more common than before. Particularly described by one respondent as “The periods with rain or dry weather are longer”. Some respondents have used the term periodized, others have described the phenomena with
other words. Changing wind patterns was also reported, but only in a few cases. Drier summers, and especially, springs, was noted by some respondents whereas similar observations for autumns and winters were not made.
Extreme & unpredictable weather: this subtheme is closely related to the previous one, with
the distinction that this subtheme covers changes which can be seen more of as extreme events. Results reflect that heavy rains is a common dimension as well as extreme droughts. It was also expressed in the material that the weather has become “unpredictable” and never “normal” for a long period. One respondent says; “More extreme weather, namely cloudbursts, storms, etc, which are close to disasters.”
No climate change
Two subthemes emerged, no perceived changes and natural variations.
No perceived changes: some respondents assert that they have not noted any changes,
sometimes with the add that they have noted some changes but not in the latest 15 years. That most years are normal is also expressed. For example; “No, nothing that I can interpret any pattern from.”
Natural variations: the label of this subtheme can be interpreted in different ways. Since the
question was not for which reason the respondent think that climate has changed but whether they had experienced any changes, the interpretation was made accordingly. Therefore, when natural variations, or similar expressions was found it was interpreted as if the respondent had witnessed variations over the years but that this was not part of climate change. For example, one respondent answered; “Most years are quite normal if you consider the yields. Some years stand out, 1992, 2001, 2017, 2018.”
Figure 4: Tag cloud analysis displays the frequency of different themes in the respondents` replies, with regard to question 5b.
The tag cloud analysis illustrates that the term “periodized” is the most common theme. More extreme and milder winters are also very common.
4.2 Research question 2:
To which extent do farmers believe that the climate will change in the future?
6. What do you think the climate will be like in southern Sweden, 30 years from now?
Figure 5: Estimated climate changes for southern Sweden, 30 years from now. 1 stands for no changes and 7 stands for large changes. Number of respondents: 184.
Of the total respondents, 97% believe that the climate will change in the future. Most of the answers are found in category 3, 4 and 5, which stands for moderate changes. Of all the answers, 67% are found in some of these categories. Category 1 (no changes) and category 7 (large changes) has almost the same reply rate, 3% versus 4%.
7. If you believe that the climate will change during coming decades, which changes do you think will occur?
Figure 6: Estimated changes in the temperature climate, in southern Sweden, 30 years from now. 1 stands for colder, 7 stands for warmer and 4 stands for neutral/no changes.Number of respondents: 180.
Category 5 is by far the most chosen answer with 49% of the respondents choosing this answer. It can be said to express “slightly warmer climate”. A substantial share of the respondents, 27%, thinks that the temperature climate will stay the same (category 4) and 6% of the respondents believes it will be colder in the future (category 1, 2 and 3). Almost one fifth, 18%, thinks it will be significantly warmer (category 6 and 7).
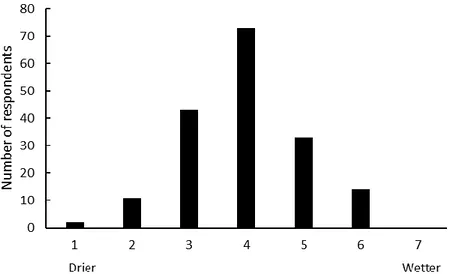
Figure 7: Estimated changes in the precipitation pattern, 30 years from now. 1 stands for drier, 7 stands for wetter and 4 stands for neutral/no changes. Number of respondents: 176.
Category 4 (no changes) is the most common answer with 44%. Slightly more respondents believe that it will be drier, rather than wetter, 32% (category 1, 2 and 3) versus 27% (category 5, 6 and 7). No respondent chose category 7.
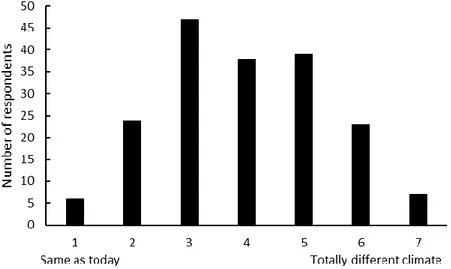
Figure 8: Estimated changes in differences between seasons, 30 years from now. 1 stands for smaller differences between seasons, 7 stands for larger differences between seasons and 4 stands for
The respondents generally think that the differences between seasons (like summer and winter) will be smaller in the future. The most chosen category is 3, with 37% of the replies. Overall, 55% of respondents believe in smaller seasonal differences (categories 1, 2 and 3), 24% do not believe in any changes (category 4) and 26% believes in larger seasonal differences (categories 5, 6 and 7).
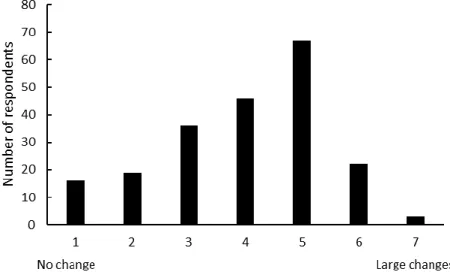
Figure 9: Estimated change in the occurrence of extreme weather. 1 stands for less extreme weather, 7 stands for more extreme weather and 4 stands for neutral/no changes. Number of respondents: 186.
The results show that most of the farmers (83%) believe that more extreme weather events will occur in the future (category 5, 6 and 7). Only 2% think it will become less extreme.
8. How do you think that eventual climate changes will affect agriculture in Scania?
Figure 10: Estimated effect of climate changes on agriculture in Scania. 1 stands for negative, 7 stands for positive and 4 stands for neutral/no changes.Number of respondents: 192.
The majority of the respondents believe that climate change will affect agriculture in Scania negatively, with 51% of the answers (category 1, 2 and 3). Those who think that the effect will be positive are 21% and 28% do not think there will be any effect of climate change.
8b. Why do you think that climate change will have such an effect (positive or negative as indicated by your answer on the previous question) on agriculture in Scania?
Most of the topics mentioned for this question are associated with something negative, as indicated by the respondent’s answers on question 8a. Frequently mentioned negative topics are; extreme weather, periodized weather and worse problems with pests. The positive topics include longer growing season and new crops.
9a. Which effects do you think climate change will have on agriculture? Focus on what you think. You can tick all boxes you think are relevant.
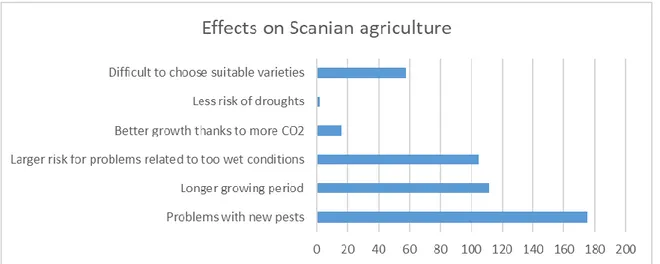
Figure 11: Assumed effects of climate change upon agriculture in Scania. The respondents can choose all statements, thus the total number of answers is higher than the number of respondents in the study.
The effect that most farmers (82%) think will be the outcome of climate change are problems with new pests and crop diseases. The second most anticipated effect is a longer growing season, appreciated by 52% of the respondents. Problem related to wetter conditions is assumed by 49%. The other alternatives are seen as relevant by relatively few respondents. Difficulties to choose suitable varieties is expected by 27% of the respondents, better growth thanks to more CO2 is anticipated by 7% of the respondents and less risk for drought only gather 1% of the
14. If you think that the climate is changing now and, in the future, what do you think the reasons are?
Table 2. IPA illustrating themes connected to beliefs of the causes of climate change. Three different
detail levels are displayed, with regard to question 14.
Superordinate themes Subthemes Dimensions
Anthropogenic climate change
Fossil fuel combustion Elevated atmospheric CO2
content, transports, unnecessary
overconsumption, other greenhouse gases, poor awareness & legislation, overpopulation
Land use Less vegetation,
deforestation, desertification, city
expansion, overpopulation, inefficient agriculture Other human activities Wars, nuclear tests, poisons,
ozone layer depletion, radiation from satellites No anthropogenic climate
change
Natural variations Natural cycles, huge climate changes in the past, solar activity, changing currents & winds
No changing climate Short term variations, speculations, no changes Two superordinate themes emerged; anthropogenic climate change and no anthropogenic
climate change.
Anthropogenic climate change
Three subthemes appeared; fossil fuel combustion, land use and other human activities.
Fossil fuel combustion: many dimensions connected to fossil fuel combustion were detected.
Elevated CO2 levels was mentioned frequently, although any reference to “atmosphere” or
“atmospheric” was not always seen. Perhaps this was implicit. Transports was a common dimension, illustrated by one respondent; “The cities large vehicle traffic”, or another one; “We have combusted way too much fossil energy during a short period of time. And I believe air traffics share is considerable. And then they blame the ruminants.”
Unnecessary overconsumption of products was another common dimension, but no specific products were mentioned here, just “crap” and that products lifetimes are too short. That people buy things they don’t need was perceived as a problem. Other greenhouse gases than CO2 was
mentioned very sparsely, but it occurred. Poor awareness and legislation is one dimension of why so much fossil fuels has been combusted, which appeared in the material. Overpopulation appears frequently in the material but was hard to place in any of the subthemes. It is never
explicitly mentioned in the material that too many people lead to too high fossil fuel combustion, instead overpopulation is usually mentioned on its own in a separate sentence.
Land use: a significant share of the respondents view land use changes as an important
contributor to climate change and all of the dimensions of this subtheme are linked to a diminishing vegetation cover. Deforestation is the most important dimension, but desertification and city expansion are also found. Farmers practices also seem to be of importance as one farmer state; “Too much organic farmers”.
Other human activities: this subtheme includes various dimensions which cannot be placed in
a homogenized category. The common denominator is that all dimensions are linked to human activities. The dimensions all appear to be rather scary subjects such as wars, nuclear tests and toxic substances. Ozone layer depletion is also linked to climate change by one respondent as well as radiation from satellites.
No anthropogenic climate change
This superordinate theme includes two subthemes; natural variations and no changing
climate.
Natural variations: the dimensions within this theme is closely related and it’s a blend of just
statements that climate change is natural and arguments for why it’s natural. Some respondents refer to that the climate has varied greatly in Earths past; “The climate has always changed. We were a burning ball in the beginning. We have had two Ice Ages. Everything before humanity.” Solar activity is mentioned as a reason to why we experience climate change, as well as changing winds and currents.
No changing climate: some respondents did not think that there was any climate change. Such
answers are gathered under this subtheme. The dimensions include reasoning like; what we have experienced during recent years are only short time variations and no real climate change and that the future climate change predictions are mainly guesses and/or speculations.
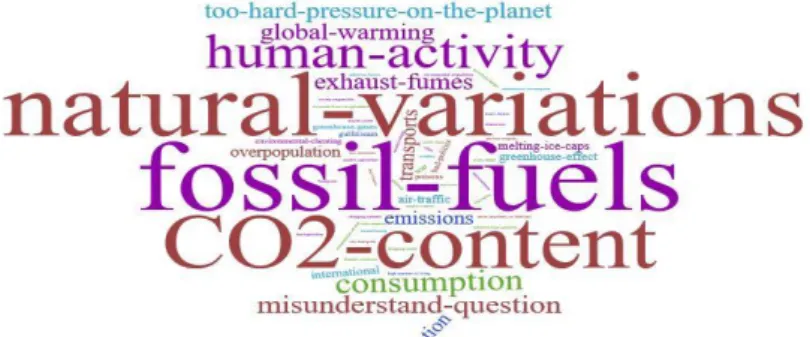
The tag cloud analysis paints a similar picture as the IPA. It can be seen that natural variations are embraced by many respondents but if the two similar themes of fossil fuels and CO2 content
would have been labelled unison, that word would have been significantly larger. Therefore, while analysing the tag cloud, it is important to keep in mind that many factors related to human activities, and especially fossil fuel combustion are spread out with different words.
4.3 Research question 3:
What are the farmers attitudes towards the authorities stand in the climate change issue? (Question 10, 11, 12 13, 15 and 16 in the questionnaire).
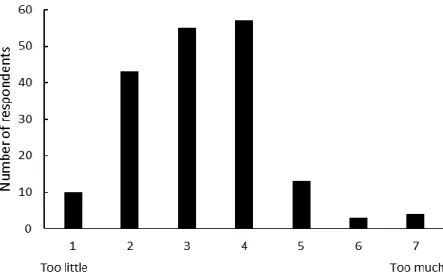
10. What do you think about the amount of information that authorities are offering farmers, regarding climate change?
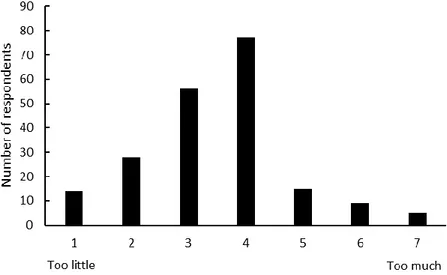
Figure 13: Farmers content with the amount of information, about climate change, provided by authorities. 1 stands for too little, 7 stands for too much and 4 stands for neutral/good amount. Number of respondents: 204.
The respondents are generally quite satisfied with the amount of information that the authorities are offering them since category 4 (the right amount) is chosen by 38% of the respondents. There are more respondents thinking that there is too little, (48%; category 1, 2 and 3) information rather than too much (14% ;category 5, 6 and 7).
11. What do you think about the relevance of the information that authorities are offering to farmers, regarding climate change?
Figure 14: Estimated relevance of the information authorities are offering Scanian farmers. 1 stands for poor, 7 stands for good and 4 stands for neutral/neither good or bad.Number of respondents: 185.
The distribution in figure 14 shows that the respondents are less satisfied with the relevance of the information than the quantity. Half of the respondents, 49%, think that the information is more towards the poor side (category 1, 2 and 3), 14% think the information is somewhat good (5, 6 and 7) and 37% think it is neither good, nor bad (category 4). Category 7, the most positive category, receive no answers at all. The most negative category, on the other hand, receives 7.5% of the respondents’ votes.
12. What do you think about the resources that society spends in order to prevent future climate change?
Figure 15: Farmers perceptions of the resources society devotes to prevent climate change. 1 stands for too little, 7 stands for too much and 4 stands for neutral/good amount. Number of respondents: 185.
The results show that the majority of the respondents think that society devote too little resources to prevent climate change. However, they think that it is fairly close to what would be considered appropriate. Of the respondents, 60% chose either 3 (a little too little) or 4 (good amount). Only 11% think that too much resources are spent on preventing climate change (category 5, 6 and 7).
13. What do you think about the resources that society spends in order to adapt to future climate change?
Figure 16: Farmers perceptions of the resources society devote to adapt to future climate change. 1 stands for too little, 7 stands for too much and 4 stands for neutral/appropriate. Number of respondents: 177.
The shape of this figure is similar to the previous one (figure 15), although on this one a slightly larger share think that too little resources are used. Category 3 gathers most assent, 37%. Compared to the previous question, category 3 and 4 stands for 66% here, instead of 60%. An even smaller share than for the previous question think that too much resources are spent, 8% (category 5, 6 and 7).
15. If we face future climate change, how will Scanian farmers be affected by the fact that Sweden is a member of the EU?
Figure 17: The attitude towards the Swedish EU-membership, in light of future climate change. 1 stands for negative, 7 stands for positive and 4 stands for neutral.Number of respondents: 202.
The respondents are more positive than negative towards the EU-membership, under a changing climate. The positive categories (5, 6 and 7) got 47% of the replies. The negative categories (1, 2 and 3) got 18% and the remaining, 35%, are neutral.
16. What do you think about the fact that Sweden is a member of the EU, from an overall sustainability perspective for Swedish agriculture?
Figure 18: The attitude towards the EU-membership from an overall sustainability perspective, for the Swedish agriculture. 1 stands for negative, 7 stands for positive and 4 stands for neutral. Number of respondents: 205.
The diagram differs from the previous one in that the flanks gets more support, both the negative and positive, but especially the positive. Of the respondents, 56% are positive (5, 6 and 7), 24% are negative and the remaining 20% are neutral.