http://www.diva-portal.org
Postprint
This is the accepted version of a paper published in Materials Science & Engineering: A. This paper has been peer-reviewed but does not include the final publisher proof-corrections or journal pagination.
Citation for the original published paper (version of record):
Kasvayee, K A., Ghassemali, E., Svensson, I L., Olofsson, J., Jarfors, A E. (2017) Characterization and modeling of the mechanical behavior of high silicon ductile iron. Materials Science & Engineering: A, 708: 159-170
https://doi.org/10.1016/j.msea.2017.09.115
Access to the published version may require subscription. N.B. When citing this work, cite the original published paper.
Permanent link to this version:
Characterization and modeling of the mechanical
behavior of high silicon ductile iron
Keivan A. Kasvayee1,a, Ehsan Ghassemali1, Ingvar L. Svensson1; Jakob Olofsson1, Anders E. W.
Jarfors1
1School of Engineering, Jönköping University, Box 1026, 551 11 Jönköping, Sweden aCorresponding author email: Keivan.Amiri-Kasvayee@ju.se
Abstract
This paper investigates the effect of the solidification conditions and silicon content on the mechanical properties of ductile iron and presents empirical models for predicting the tensile behavior based on the microstructural characterizations. Two ductile iron grades of GJS-500-7 and GJS-500-14 were cast with silicon content of 2.36 and 3.71%, respectively. The cast geometry consisted of six plates with different thicknesses that provided different cooling rates during the solidification. Microstructure analysis, tensile and hardness tests were performed on the as-cast material. Tensile behavior was characterized by the Ludwigson equation. The tensile fracture surfaces were analyzed to quantify the fraction of porosity. The results showed that graphite content, graphite nodule count, ferrite fraction and yield strength were increased by increasing the silicon content. A higher silicon content resulted in lower work hardening exponent and strength coefficient on the Ludwigson equation. The results for 0.2% offset yield and the Ludwigson equation parameters were modeled based on microstructural characteristics, with influence of silicon content as the main contributing factor. The models were implemented into a casting process simulation to enable prediction of microstructure-based tensile behavior. A good agreement was obtained between measured and simulated tensile behavior, validating the predictions of simulation in cast components with similar microstructural characteristics.
Keywords: Spherical graphite iron, component casting, silicon content, Ludwigson equation parameters, casting simulation.
1 Introduction
Microstructural characteristics of cast irons such as graphite shape and distribution, as well as the metal matrix microstructure depend on chemical composition, casting process, e.g. cooling condition [1, 2]. For ductile iron with nodular graphite particles, the overall graphite volume, area fraction of the nodular graphite (nodularity), number of nodules per unit area (nodule count), graphite size and the matrix microstructure, are strongly influenced by both solidification conditions and alloying element additions[3, 4]. The microstructural characteristics greatly affects mechanical properties of ductile iron [5, 6]. In addition, the amount and type of alloying elements can affect the mechanical properties by changing the metal matrix phases (e.g. changing the amount of ferrite/pearlite), nodularity and nodules counts [4].
Local solidification rate varies in a cast component due to variations in section thickness and dissipation of heat in different regions of the mold. In the case of ductile iron, this leads to variations in microstructure (e.g. graphite distribution, ferrite content, and pearlite fraction) in different parts of a component, resulting in variation of mechanical properties on mesoscale level. This variation influences the mechanical response of a component in its application and must be considered in the design of cast components [7, 8]. This emphasizes the need for investigation and quantification of the mechanical properties of ductile iron for different section thicknesses. In an extension, the investigations will also increase the quality of multiscale modelling as the local loads could be better described [9].
High silicon ductile iron is a type of ductile iron with silicon content close to 4wt.%. Silicon reduces the carbon solubility in ferrite which increases the amount of precipitated graphite [4, 10]. Silicon is a ferrite promoter and has a solid solution effect in the ferrite, that can increase hardness and strength of the ferritic ductile iron similar to those of ferritic-pearlitic grades [11, 12]. With a single phase matrix, higher hardness uniformity will be achieved in high silicon ductile iron grades, which results in a better machinability [13, 14]. This can reduce the production cost, which makes this material an interesting alternative for producing components (e.g. bearing housing) that were previously made of ferritic-pearlitic grades. However, silicon deteriorates the graphite shape, which needs to be counterbalanced during the production of high silicon ductile iron materials [14]. High silicon ductile iron have some drawbacks such as low impact resistance, that have limited its industrial application [13, 15].
Models describing the relations between the mechanical properties and microstructural characteristics are often used in design [16, 17], and were implemented in some simulation tools [18]. Models was developed to predict mechanical properties of high silicon compacted graphite iron (CGI) based on the microstructural characteristics and has been used in the simulation programs to predict the mechanical properties [19]. To the best knowledge of authors, there is a lack of research on empirical models to correlate mechanical behavior to microstructural features for high silicon ductile iron. The aim of this study is to elaborate the relation between the microstructure characteristics and mechanical properties of ductile iron grade GJS-500-7 and high silicon ductile iron grade GJS-500-14 cast for different section thicknesses. For this purpose, microstructural investigation as well as mechanical testing were performed. The results were compared with respect to plate thickness and silicon content. Empirical models were developed, using multiple linear regression and analysis of variance (ANOVA). The models were implemented in a casting process simulation software and validated by the experimental data.
2 Experimental
In this study, section thickness was varied between 7 to 75 mm. The silicon amount in the composition has been changed from 2.36 to 3.8wt% in the cast grades. The antimony concentration in the high silicon grade was varied between 60 and 160 ppm. In all the evaluations, the 15 mm section thickness was excluded in the model fitting and used for validation purposes.
2.1 Material
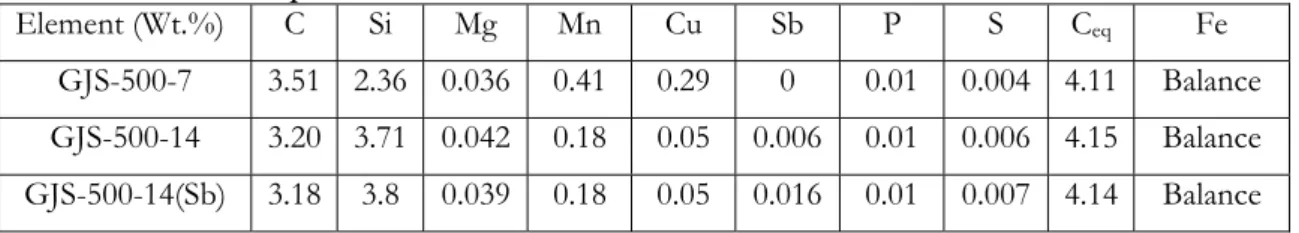
Two ductile iron grades of GJS-500-7 and GJS-500-14, with compositions presented in Table 1 were cast. The GJS-500-7 was cast in one batch. The grade GJS-500-14 (high silicon ductile iron) was cast in two batches one without and one with the addition of 160 ppm Antimony (Sb) named as GJS-500-14 and GJS-500-GJS-500-14(Sb), respectively. Sb was added to investigate its effect on the nodularity of high silicon ductile iron [20, 21].
Table 1. Chemical composition of the cast material.
Element (Wt.%) C Si Mg Mn Cu Sb P S Ceq Fe
GJS-500-7 3.51 2.36 0.036 0.41 0.29 0 0.01 0.004 4.11 Balance GJS-500-14 3.20 3.71 0.042 0.18 0.05 0.006 0.01 0.006 4.15 Balance GJS-500-14(Sb) 3.18 3.8 0.039 0.18 0.05 0.016 0.01 0.007 4.14 Balance
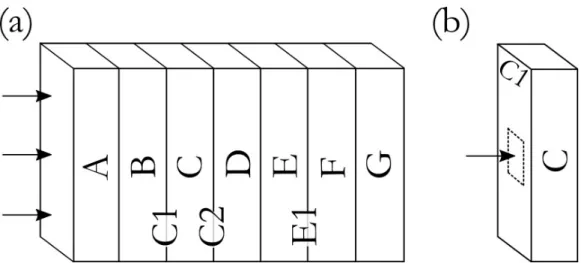
The cast geometry (Figure 1) contained six different cast plates with six different thicknesses of 3, 7, 15, 30, 50, 75 mm, which provided different cooling rates during the solidification (i.e. the thicker the plate the lower the cooling rate). Such a geometry represents real casting situations with different section thicknesses. Two feeders were designed for the 4 thicker plates to reduce the shrinkage
porosity. The plates’ length and width were 240 mm and 120 mm, respectively. The total weight of the casting was 105±5 kg.
Figure 1. Cast geometry, containing six cast plates with different thicknesses.
Magnesium treatment was done with Tundish cover method at 1490°C. The pouring temperature was 1360±10°C. The pouring time was 25 seconds. The cast molds were produced from quartz-feldspar sand with AlphasetTM binder.
2.2 Microstructure analysis
Every cast plate was divided into 7 equal sections which were marked by letters A to G, as depicted in Figure 2(a). The section A was the closest and the section G was the furthest to the filling gates. The surfaces between B-C, C-D and E-F sections were named as C1, C2 and E1, respectively.
Microstructure analyses were performed in the middle layer of C1, C2 and E1 to represent areas that hardness and tensile test samples were produced (see sections 2.3 and 2.5). Samples were mechanically polished and were etched by 5% Nital solution. Micrographs were recorded using an optical microscope (Olympus GX81) to cover at least 10 mm2 of each sample. Nodularity by area (ASTM E
2567 [22]), graphite particle count (number of graphite particles per mm2), nodule count (graphite
particles with the shape factor higher than 0.65 per mm2), graphite fraction (area fraction of graphite),
ferrite fraction (area fraction of ferrite in the micrographs) and pearlite fraction (area fraction of pearlite in the micrographs) were measured for the micrographs using the Olympus stream motion software, V1.9.1. The results of the 3 different areas were averaged to represent the microstructure of each plate.
Figure 2. (a) A schematic of a typical cast plate divided into 7 sections and marked by the letters A to G. C1, C2 and E1 are the surfaces between B-C, C-D and E-F sections, respectively. The arrows show the direction of the melt filling. (b) Schematic showing the C1 side. The arrow shows the middle part
2.3 Tensile test
Tensile samples were manufactured and tested according to the ISO-6892 Standard [23]. Dumbbell shape samples with gauge diameter of 10 mm and gauge length of 50 mm were machined from the center of the B, D and F sections (see Figure 2(a)). For the 7 mm plates, flat tensile samples were produced with the thickness, gauge width and gauge length of 5, 7.5 and 80 mm, respectively. Tensile tests were performed using a Zwick/Roell Z100 testing machine. The tensile test strain rate was set as 0.00025s-1 up to fracture. Up to 1% elongation, the strain was measured by a clip-on extensometer,
whilst the rest was measured by the machine crosshead. Elastic modulus was measured by the tangent method at 50MPa engineering stress. The tensile results that represented each plate was obtained from an average of the 3 tensile tests in each plate.
2.4 Porosity fraction in the fracture surface
Scanning electron microscopy (SEM), JSM-700IF, was used for fractography investigations. One side of the fracture surface of the tested tensile samples was analyzed to measure the porosity fraction, using systematic manual point count according to ASTM E 562-11 [24]. 3 micrographs, each covering 6.3 mm2, were taken randomly from the fracture surfaces. The average porosity fraction for the 3
micrographs gave the fraction of the porosity for each fracture surface. The chemical composition of the inclusions on the fracture surface of the tensile samples were analyzed using energy dispersive spectrometry (EDS) with an acceleration voltage of 20kV.
2.5 Hardness test
Brinell hardness was measured according to ISO 6506-1:2005 standard, using a load of 750 kg and 5 mm steel ball. Tests were performed at the 3 different locations in each cast plate, at the center of C1, C2 and E1 (Figure 2(a)), and their average used as representative for each plate.
2.6 Modelling
The data obtained from the tensile tests were analyzed using a MatlabTM script to measure elastic
modulus, 0.2% offset yield strength, ultimate tensile strength (UTS) and elongation to fracture. The UTS was measured as the maximum stress in the engineering stress-strain curve. The elongation to failure was the strain in which the stress dropped below 20% of UTS. In the Matlab code, the Ludwigson equation (Eq.(2)) [25] was fit to the experimental curves. For this purpose, n1 and K1 were found with the optimization of curve fitting for Hollomon equation (Eq.(1)). The obtained n1 and K1 were set in the Ludwigson equation, and n2 and K2 were optimized using Hooks-Jeeves pattern search method [26].
σ ε (1)
σ ε exp (2)
where σ is the true stress, ε is the true plastic strain, K1 is the strength coefficient and n1 is the strain hardening exponent. The exponential term of Eq.(2) containing the two dimensionless parameters K2 and n2, captures the deformation behavior at the early stages of loading, and diminishes at higher plastic strains.
The relations between mechanical properties and microstructural characteristics were statistically investigated. Except for the 15 mm plates, all extracted data from the tensile tests, hardness tests and microstructure analyses were imported to the Design-ExpertTM software, V10. Empirical models were
developed by multiple regression and Analysis of Variance (ANOVA), to identify the dominant factors and model the mechanical properties based on the microstructural features. The results from the 15 mm plates were excluded in the modeling and used as a validation test for the models. In terms of
validity this was an interpolation so the developed models are valid in the range of the investigated microstructural characteristics.
2.7 Simulation
A 3D geometry of the cast plates (Figure 1) was imported to the MAGMATM software, V5.3. The
simulation settings such as material grade, sand material, chemical composition, pouring time and pouring temperature were set identical to the experiment. Inoculation efficiency and heat transfer coefficient between the cast and sand mold were optimized to obtain the predicted microstructure as similar as possible to the cast microstructure in the 7, 30, 50 and 75 mm plates. The 15 mm plate was excluded from the microstructure optimization for validation of the simulated results. The derived models were implemented into a development version of the casting process simulation MAGMATM,
V5.3, to simulate the mechanical properties.
3 Results and discussion
3.1 Microstructure
The 3 mm cast plates were not completely filled in any of the casting trials. In addition, there was a lack of fill in the 7 mm plate for the grade GJS-500-14(Sb), due to problems in the mold for this particular batch. Thus, all the 3 mm plates together with the 7 mm plate of GJS-500-14(Sb) were excluded from this study.
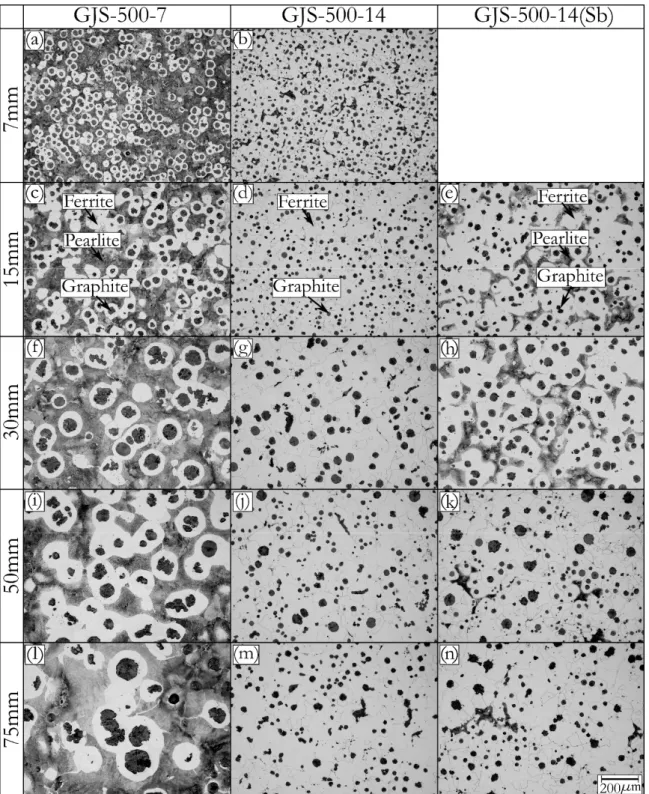
Figure 3 shows typical micrographs for the 3 cast batches which were taken from the center of the C2 sections (Figure 2) in each cast plate. The microstructure of the grade GJS-500-7 is characterized by nodular graphite embedded in the ferritic-pearlitic matrix (e.g. see Figure 3(c)), in which ferrite is preferentially formed around the graphite particles. The graphite size and their surrounding ferrite regions were increased by increasing the plate thickness (see grade GJS-500-7 column). This is attributed to the decrease of cooling rate with respect to the increase in plate thickness. Lower cooling rates in the thicker plates provided more time for carbon atoms to diffuse from the melt to graphite so that larger graphite particles, and consequently larger ferrite regions could be formed.
By increasing silicon content to 3.71% in the grade GJS-500-14, the amount of ferrite was significantly increased (compare Figure 3(c) and (d)), showing the ferrite stabilizing effect of silicon. Some pearlite was developed in the grade GJS-500-14(Sb) (Figure 3(e)), which proved the characteristics of the Sb as a pearlite promoter [20]. The graphite size increased from 7 mm plate to 30 mm plate in each grade, while it was almost constant for the thicker plates. Moreover, the graphite particles in the thicker plates (e.g. 75 mm plate) were much larger in GJS-500-7 compared to GJS-500-14.
Figure 3. Representative micrographs of the 7, 15, 30, 50 and 75 mm plates of the 3 cast batches; graphite particles (dark grey), ferrite (white) and pearlite (lamellar light grey). The plate thicknesses
are presented at the left side of each row. The material grades are presented at the top of each column.
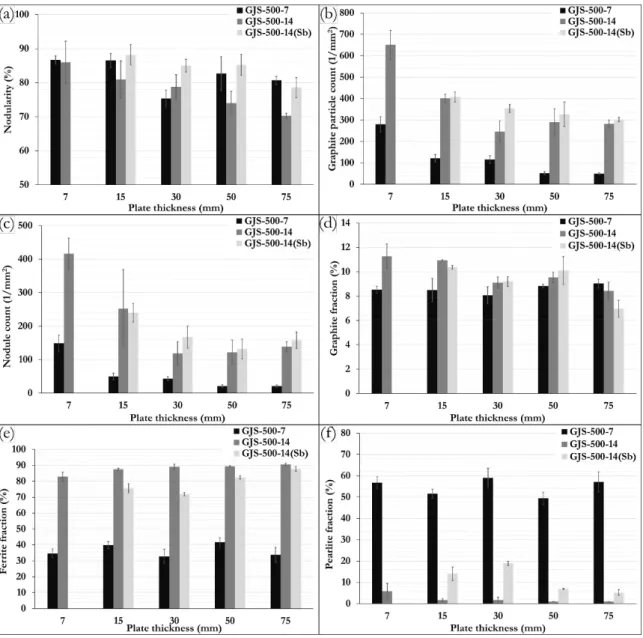
Figure 4 shows the measured microstructural characteristics of the cast plates. All the cast plates showed more than 70% nodularity (Figure 4(a)). No conclusive correlation or trend was found between the nodularity values and the thickness of the plates for GJS-500-7 and GJS-500-14(Sb). However, in GJS-500-14, the average of nodularity was decreased from 82% in 7 mm plate to 70% in 75 mm plate (i.e. 12% reduction). This can be attributed to the fading of magnesium and inoculants in thicker plates due to the longer solidification time [27]. Except for the 30 mm plates, the GJS-500-14 samples showed the lowest amount of nodularity in all the plate thicknesses. This indicates that increasing silicon
content can decrease the nodularity of ductile iron. The nodularity was higher in the GJS-500-14(Sb) compared to the GJS-500-14 by an average of approximately 8% in all the cast plates. This indicates that Sb can improve the nodularity of high silicon ductile iron.
Higher values of graphite particle count and nodule count were measured in the grade GJS-500-14 compared to the grade GJS-500-7 in all the cast plates. The highest values for graphite particle and nodule count were measured for the 7 mm plates in each cast batch (Figure 4(b) and (c)). In general, the graphite particle count and nodule count were decreased in each cast from 7 mm to 30 mm plate, and were similar in plates thicker than 30 mm. This could be due to the higher cooling rate in the thinner plates, which increased the number of nucleation sites for graphite particles and thus increased the graphite particle count [28, 29].
In contrast to the lower carbon content, higher graphite fraction was measured for the grade GJS-500-14 (Figure 4(d)). This was due to the higher amount of silicon content which increased the interval between stable and metastable eutectic temperatures and promoted the amount of graphite formed [4, 30].
No conclusive trend was found for the ferrite fraction in grade GJS-500-7 with respect to the plate thickness (Figure 4(e)) could be established. Higher amount of ferrite was expected in the thicker plates due to lower cooling rates [31]. This was due to that the thinner plates showed higher number of graphite particles resulting in shorter distance between the particles and thus also greater overlap between the ferrite regions formed around the graphite particles. While the ferrite regions in the thicker plates were less in number but larger (see Figure 3 grade GJS-500-7 column). Hence, similar ferrite fractions were obtained for all the plates. The ferrite fraction in the GJS-500-14 and GJS-500-14(Sb) were measured in the range of 82-90% and 71-88%, respectively. Higher amount of ferrite in these two casts were due to the ferrite stabilizing effect of silicon.
In grade GJS-500-14 (A), pearlite fraction was decreased from 6% in the 7 mm plate to 1% in the 75 mm plates (Figure 4(f)). This was again due to higher cooling rates in the thinner section plates, resulting in reduced amount of carbon diffusion from the iron matrix to the graphite particles with an increased pearlite formation as result. Higher pearlite fraction was measured for the GJS-500-14(Sb) compared to the GJS-500-14 due to the higher Sb content in this material.
Figure 4. Microstructural characteristics of the cast materials showing; (a) nodularity, (b) graphite particle count, (c) nodule count, (d) graphite fraction, (e) ferrite fraction, (f) pearlite fraction.
3.2 Porosity
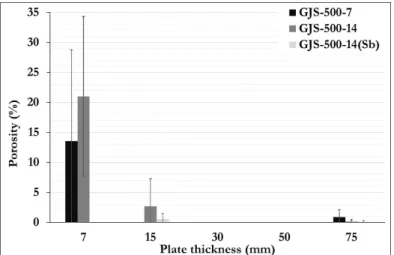
Figure 5 shows the fraction of porosity in the fracture surfaces of the tensile samples. The highest amount of porosity fraction was measured in 7 mm plates. The tensile properties of the samples containing porosities were deteriorated compared to the ones without porosity. Nevertheless, there were tensile samples without porosity in the fracture surface in every cast plate.
Figure 5. Fraction of porosity in the fracture surfaces of the tensile samples.
Figure 6(a) and (c) show porosity in the fracture surfaces of the tensile samples produced from the 7 mm plates of GJS-500-7 and GJS-500-14, respectively. An area of the porosity regions in the Figure 6(a) and (c) are magnified in the Figure 6(b) and (d), respectively. All the porosities were formed by the dendritic structure which indicated that they were shrinkage porosities.
Figure 6. The shrinkage porosity and their dendritic structure on the fracture surface of the tensile samples which were produced from the; (a) and (b) 500-7, 7 mm plate section D, (c) and (d)
GJS-500-14, 7 mm plate section B.
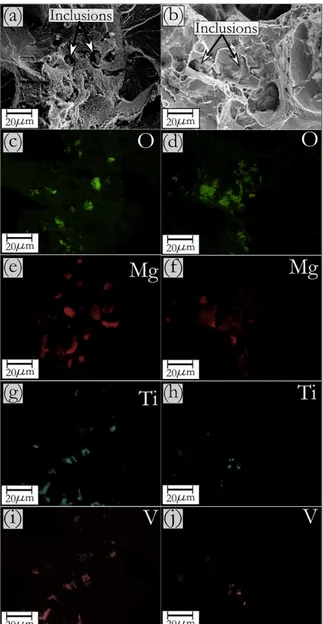
Figure 7(a) shows inclusions inside the pearlitic matrix of the grade GJS-500-7, 50 mm plate. Figure 7(b) shows the inclusions inside the ferritic matrix of grade GJS-500-14, 50 mm plate. In the presence of inclusions, fine small voids form and accelerate the coalescence between large voids, which are produced from the decohesion of graphite and matrix. This can cause early fracture in tensile test. Figure 7 (b)-(i) show the EDS elemental maps for the inclusion presented in Figure 7(a) and (b), which show high amount of magnesium, vanadium, titanium and oxygen in inclusions. These inclusions can be the oxide or carbide compositions of the mentioned elements, which can degrade the tensile properties [3, 32].
Figure 7. (a) Inclusions in pearlite in a cleavage fracture surface of the sample produced from GJS-500-7, 50 mm plate, section D. (b) inclusions in ductile fracture surface of the sample produced from
GJS-500-14, 50 mm plate, section F. (c)-(i) elemental maps for the inclusions. The left and right columns of the elemental maps relate to the micrograph (a) and (b), respectively.
3.3 Tensile properties
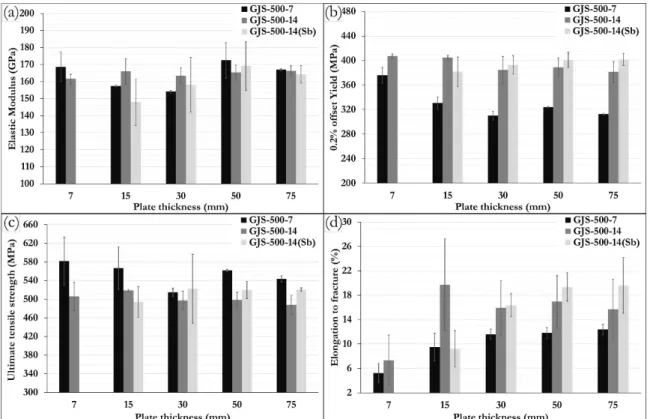
Figure 8 shows the tensile properties of the cast plates for the 3 cast batches. Marginal changes were observed in the elastic modulus and UTS with respect to the plate thickness as well as the cast grade (Figure 8(a)and (c), respectively). This indicates that silicon solution strengthening could promote the UTS of ferritic ductile iron in the level of ferritic-pearlitic grade.
In the GJS-500-7, the 0.2% offset yield decreased from 375 to 310MPa from 7 mm plate to 30 mm plate, and were in the same order over the plate thicknesses higher than the 30 mm (Figure 8(b)). The 0.2% offset yield in GJS-500-14 and GJS-500-14(Sb) was measured in the range of 381-407MPa and 381-401MPa, respectively. Higher values of 0.2% yield strength for the grade GJS-500-14 can be related to the solid solution hardening of the matrix by addition of silicon. This is a clear benefit of using high silicon ductile iron which has higher yield point compared to the regular ferritic-pearlitic grade. Marginal changes in the 0.2% offset yield of cast GJS-500-14 and GJS-500-14(Sb) were observed
with respect to the plate thickness. This can be considered as an advantage for this material that yield strength is less dependent on the plate thickness.
Higher elongation to failure was recorded for the grade GJS-500-14 compared to the GJS-500-7 by considering the average values (Figure 8(d)). This can be associated to the increase of ferrite fraction in the metal matrix (see Figure 4(e)). The low values of elongation to fracture in the 7 mm plates were due to the high amount of porosity in the tensile samples (see Figure 5).
Figure 8. Tensile properties of the cast plates illustrating; (a) Elastic modulus (GPa), (b) 0.2% offset yield (MPa), (c) Ultimate tensile strength (MPa), (d) Elongation to fracture (%).
3.4 Hardness
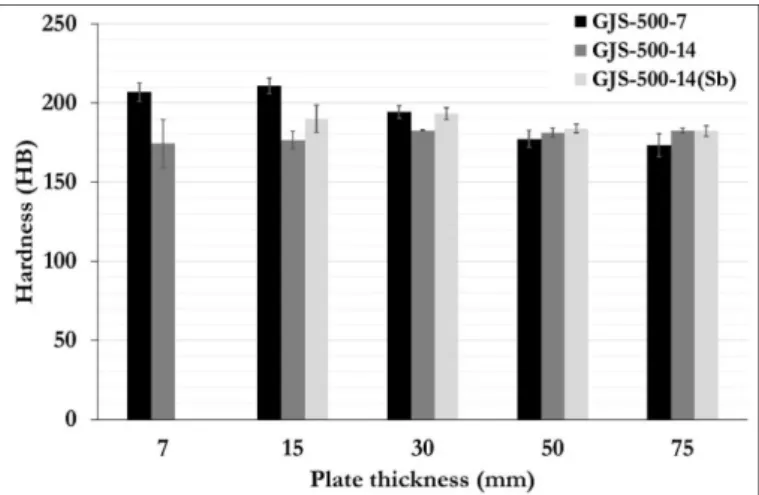
Figure 9 shows the Brinell hardness results. In the GJS-500-7, the 7 and 15mm plates showed the highest average hardness. No significant hardness differences were observed for the grade GJS-500-14 by changing the plates thickness. The measured tensile and hardness values were generally in agreement with the previous works done by other investigators [13, 15, 33].
Figure 9. Brinell hardness for the cast plates.
3.5 Modeling
Figure 10(a) shows typical tensile curves which were measured from the samples of the 30 mm plate. As it can be seen, the kink in the GJS-500-7 tensile curve occurred earlier compared to the two other curves, indicating earlier initiation of plastic deformation in this grade.
Figure 10(b)-(d) show the Hollomon and Ludwigson equation curve fits for the curves presented in the Figure 10(a), using the MatlabTM code; excellent fits to the experimental curves could be achieved
by using the Ludwigson equation. However, curves predicted by the Hollomon equation could not give a good fit specially at the curves kinks (i.e. yielding region). Note that the curve fitting was performed up to the UTS.
Figure 10. (a) Typical tensile curves for the 30 mm cast plates for the 3 cast materials. (b) Hollomon and Ludwigson curve fits for the tensile curve GJS-500-7 which is presented in (a). (c) Hollomon and
Ludwigson curve fits for the tensile curve GJS-500-14 which is presented in (a). (d) Hollomon and Ludwigson curve fits for the tensile curve GJS-500-14(Sb) which is presented in (a).
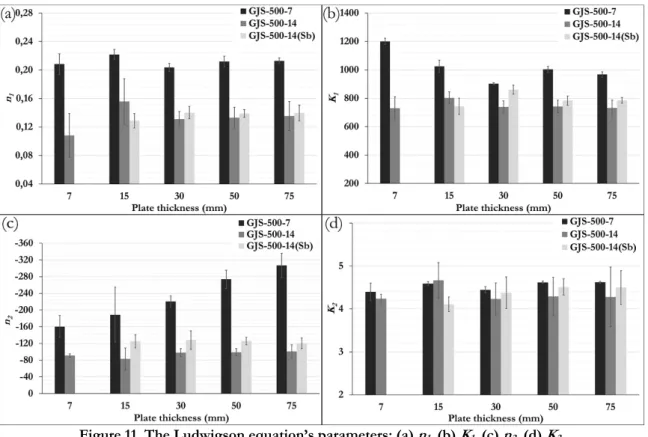
Figure 11 shows the Ludwigson equation’s parameters for the cast plates. The n1 values did not change significantly with respect to the plate thickness in the cast grades (Figure 11(a)). The n1 values for the 7 was in the range of 0.21-0.23, while this range was 0.11-0.16 and 0.12-16 for the GJS-500-14 and GJS-500-GJS-500-14(Sb), respectively. Lower values of n1 indicates lower rates of work hardening in the high silicon grade. This could be due to the lower work hardening of the ferrite phase during deformation as compared to the ferritic-pearlite structure. Similarly, lower K1 values were obtained for the grade GJS-500-14 compared to the grade GJS-500-7 (Figure 11(b)). These results are in agreement with the previously reported results [34].
Smaller n2 values were obtained for the GJS-500-7 compared to the GJS-500-14 and GJS-500-14(Sb) (Figure 11(c)), indicating higher amount of plastic deformation in the early stages of tensile test before the 0.2% offset yield. In the case of K2 values, not a significant change was observed with respect to the plates thickness and cast grade (Figure 11(d)).
Figure 11. The Ludwigson equation’s parameters; (a) n1, (b) K1, (c) n2, (d) K2.
All the measured tensile and hardness properties, except for the 15 mm plates (which has been used for model validation), were statistically analyzed with respect to their corresponding microstructural characteristics. In these analyses, the data from 51 individual tensile tests were used (not the average data for each plate). The variation of the measured properties was sufficiently large with respect to the silicon content and plate thickness for deriving empirical models in the investigated experimental window.
The independent variables were set as those that: (i) may have significant physical influence on the tensile properties of ductile iron [7, 35], and (ii) can be predicted by the simulation. This resulted in the following independent variables (factors): silicon content (Si) (%), nodule count (NC) (1/mm2),
graphite particle count (PC) (1/mm2), pearlite fraction (PF) (%), ferrite fraction (FF) (%) and porosity
on the fracture surface (PFS) (%). Note that the ferrite grain size becomes finer as the graphite diameter decreases. Smaller graphite diameter was obtained in the plates with higher PC, see Figure 3. This means that the PC and ferrite grain size were dependent, suggesting that using PC as independent variable implicitly covered the effect of ferrite grain size [36]. The dependent variables (responses)
were elastic modulus (GPa), 0.2% offset yield strength (MPa), UTS (MPa), elongation to fracture (%), hardness(HB) and Ludwigson equation parameters (i.e n1, K1, n2 and K2). All the dependent variables were considered to vary isotropically on mesoscale.
To derive the models, quadratic order was selected for the terms (i.e. Sequential sum of squares for the quadratic (A-squared, B-squared, etc.) independent variables) at beginning of the process. Forward method was used during the model selection. In this method, terms were checked and added one at a time to the model. Term not yet in the model was checked until no further improvements could be found given the terms already in the model. The term that improves the criterion the most is added to the model. Therefore, the model was built with the lowest possible power for the terms. Finally, the following two factor interaction models for the 0.2% offset yield (Eq(3)), n1 (Eq(4)), K1 (Eq(5)) and n2 (Eq.(6)) were obtained.
0.2% offset yield MPa 176.48 39.25 0.46 0.76 – 5.36 10 (3) 0.32 – 0.04 3.17 10 3.05 10 2.32 10 (4) 1654.76 – 275.55 0.51 – 5.22 (5) 659.61 147.36 1.61 – 0.43 (6)
The equations are in terms of actual factors, which are scaled to accommodate the original units of each factor, so should not be used to determine the relative impact of each factor. Accordingly, the models are valid for the silicon range of 2.4-3.8%, graphite particle count in the range of 30-700 (1/mm2), ferrite fraction in the range of 27-91%, and porosity fraction in the range of 0-30%.
Table 2 presents the ANOVA results for the above-mentioned models. R-squared is a measure of the amount of variation around the mean explained by the model. Reasonably good R-squared values were obtained for the models, considering ductile iron as a multiphase material in which variation in the local phases (e.g. size and morphology of the graphite) can cause scatter in the tensile properties. Adjusted squared is the squared adjusted for the number of terms in the model. Predicted R-squared is a measure of how well the model predicts a response value. In all the models, the predicted R-squared is in a reasonable agreement with the adjusted R-squared (i.e. less than 0.2 difference), indicating that the response transformation is not necessary. The F-value is a test for comparing model variance with residual (error) variance. The model and its individual terms were analyzed using Probability value (P-value). If the Prob>F value is very small (less than 0.05) then the terms in the model have a significant effect on the response. This due to that probability equals the proportion of the area under the curve of the F-distribution that lies beyond the observed F value.
The normal plot of the residuals indicated that the studentized residuals followed a normal distribution centered around the model. The residuals versus the predicted response values where checked to verify that the scatter around the model was independent of the prediction with a constant error span around the model. The Box-Cox normality plot was checked indicating no need for power transformation of the response data (e.g. transformation to square root or natural log) [37]. It should be mentioned that a few experimental results which were identified as outliers based on the Cook’s distance were omitted. In this way both the model and individual terms were assessed as statistically significant and the results validated as sound and unbiased.
Table 2. Models’ ANOVA statistics for the mechanical properties.
Models squared R- Adjusted R-squared R-squared Predicted Value F P>F Model
Eq.(3) 0.83 0.81 0.78 42 <0.0001 Significant
Eq.(4) 0.93 0.92 0.88 122 <0.0001 Significant
Eq.(5) 0.81 0.79 0.75 49 <0.0001 Significant
Eq.(6) 0.90 0.89 0.86 90 <0.0001 Significant
Eq.(4) indicates that n1 has a negative dependence to the silicon content, ferrite fraction and fraction of porosity on the fracture surface. This indicates that the solution hardened fully ferritic matrix is less prone to strain hardening during tensile deformation compared to the ferritic-pearlitic grade.
No direct and precise correlation with microstructural features was found for the elastic modulus, UTS, elongation to fracture and Ludwigson parameter K2. The obtained models for these responses usually suffered from low R-squared (i.e. lower than 0.8) or a significant lack of fit (i.e. the models did not fit the data within the observed replicate variation). This could be because of the presence of the micro-porosities and inclusions in the cast material that led to a large scatter in some of the measured data. In addition, this might be due to the interrelation and overlapping of the different independent variables (e.g. silicon and ferrite fraction) and/or not considering all the possible microstructural characteristics that could influence the mechanical properties (e.g. graphite size, graphite nearest neighbor distance or pearlite lamellar spacing). Nevertheless, it is possible to consider an average of 163±6GPa, 514±41MPa, 186±12HB and 4.3±0.4 for elastic modulus, UTS, hardness and K2, respectively.
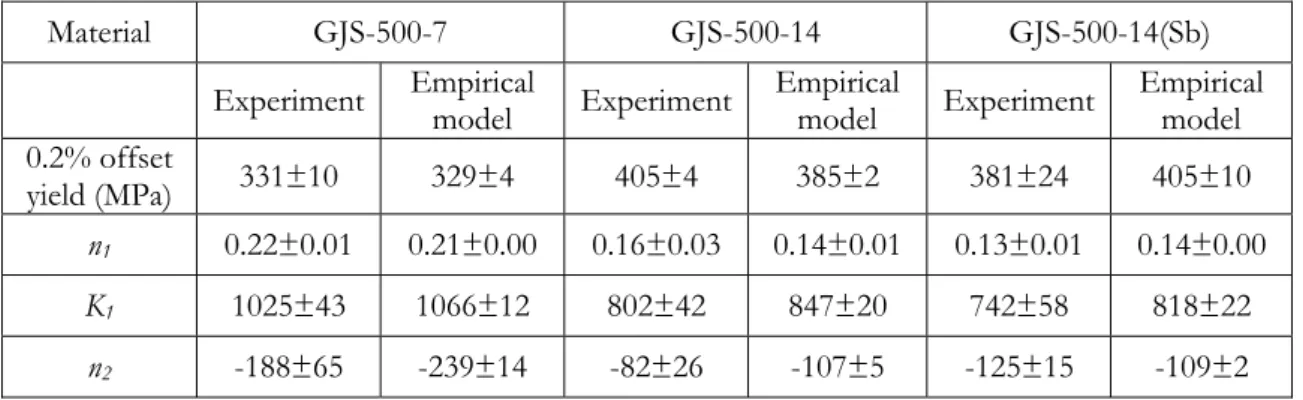
The microstructural characteristics of the 15 mm plates were implemented in the empirical models and the predicted properties were compared to the experimental results, see Table 3. The predicted results reasonably conform with the experimental results validating the empirical models for the 15 mm plate thickness and validating the interpolation of the tensile properties for the valid range of the microstructural characteristics.
Table 3. Validation of the results obtained from experimental data from the 15 mm plate and predicted by the empirical models.
Comparing the developed models with the previous works, Ceschini et al [7] modeled yield strength for ferritic-pearlitic ductile iron based on nodule count, ferrite fraction, nodularity and graphite fraction. A reasonable approximation of yield strength can be obtained by using their model and applying the measured data for the GJS-500-7. Hardness, UTS and elongation was modeled as well in their work. The use of non-linear regression analysis might be the reason for being able to model these properties. In addition, compared to this study, wider range of section thicknesses (20-210 mm) was tested with addition of graphite nodule area as an extra input variable. However, their model cannot be used for high silicon grades since the ferrite fraction usually exceeds the valid range of the regression
Material GJS-500-7 GJS-500-14 GJS-500-14(Sb)
Experiment Empirical model Experiment Empirical model Experiment Empirical model 0.2% offset
yield (MPa) 331±10 329±4 405±4 385±2 381±24 405±10
n1 0.22±0.01 0.21±0.00 0.16±0.03 0.14±0.01 0.13±0.01 0.14±0.00
K1 1025±43 1066±12 802±42 847±20 742±58 818±22
model. Donelan [16] modeled yield strength of ductile iron using the results of a number of separate studies. The yield strength was related to the ferrite grain size, pearlite fraction, carbon composition and silicon composition. However, the effect of the graphite particle count was not taken into the account, which is proved to have a big influence in this study.
3.6 Simulation
The simulation predicted no porosities in the plates after the solidification, thus the amount of the porosities was considered as zero. The effect of Sb on the microstructure of ductile iron has not been defined in the simulation software. Therefore, the GJS-500-14(Sb) was not simulated. Moreover, the nodularity in the simulation was set constant at 80% for all the ductile iron grades and section thicknesses. However, in the experiment, variation in the nodularity caused variation in the ratio of nodule count to particle count in different section thicknesses which effected the ferrite fraction (higher particle count causes more ferrite fraction). Thus, the amount of graphite particle count in the experiment was correlated to the nodule count in the simulation to obtain similar amount of the ferrite fraction.
The simulation was performed and the results were evaluated by averaging in the 3 regions of C1, C2 and E1 similar to the experiments (see Figure 2). Figure 12(a) and (b) show the measured and simulated values for the graphite particle count and ferrite fraction in the 15 mm plate, respectively. A reasonably good agreement could be obtained which validated the microstructural predictions by the simulation.
Figure 12. The evaluation of the simulated (a) graphite particle count and (b) ferrite fraction for the 15 mm plate.
Figure 13 compares the tensile curves plotted based on experimental data and the results obtained from the simulation for the 15 mm plates. The curves highly conform which validates the simulated 0.2% offset yield, n1, K1 and n2.
Figure 13. The evaluation of the tensile curves for the 15mm plate plotted based on the simulated results using the predicted microstructure into the Ludwigson equation and comparing to an actual
tensile test curve for: (a) GJS-500-7 and (b) GJS-500-14.
4 Conclusions
Evaluation of the microstructure revealed higher graphite particle count and nodule count for the high silicon grade 500-14 compared to the grade 500-7. Addition of 160 ppm Sb to the grade GJS-500-14 increased the nodularity by an average of 8%. Moreover, grade GJS-GJS-500-14 showed higher 0.2% offset yield compared to the grade GJS-500-7 in all the cast plates (e.g. 24±4% increase in 30mm plate).
Using the Ludwigson equation, a good fit could be obtained for the tensile curves. Lower strain hardening exponent (n1) and strength coefficient (K1) were obtained for the grade GJS 500-14 compared to GJS-500-7 (e.g. 31% and 36% decrease in 30mm plate, respectively).
Empirical models were developed for 0.2% offset yield, n1, K1 and n2 based on the microstructural characteristics (excluding the 15mm plates results for validation), indicating influence of silicon content as the main contributing factor. Using the developed models, the predicted results for the 15mm plates reasonably conformed with the experimental results, validating the empirical models.
Implementing the derived models in the casting process simulation, the casting simulation predicted the microstructure and tensile behavior with a high accuracy, resulting in a good agreement between the experimental and simulated tensile curves. This indicates that the combination of the empirical models and simulation can be used for the prediction of the mechanical properties for the components that are casted with the similar conditions and comprise similar microstructural characteristics.
5 Acknowledgments
The authors acknowledge the Swedish Knowledge Foundation for financial support under the CompCAST project (20100280) and SKF Mekan AB and Nya Arvika Gjuteri AB for providing the cast material. Associate professor Kent Salomonsson is acknowledged for help in the coding of tensile curve fitting.
6 Reference
[1] R. Ghasemi, L. Elmquist, H. Svensson, M. König, A. Jarfors, Mechanical properties of Solid Solution-Strengthened CGI, Int J Cast Metal Res (2016) 1-8.
[2] L. Collini, G. Nicoletto, R. Konečná, Microstructure and mechanical properties of pearlitic gray cast iron, Materials Science and Engineering: A 488(1) (2008) 529-539.
[3] K.-F. Nilsson, V. Vokál, Analysis of ductile cast iron tensile tests to relate ductility variation to casting defects and material microstructure, Materials Science and Engineering: A 502(1–2) (2009) 54-63.
[4] C. Labrecque, M. Gagné, Review ductile iron: fifty years of continuous development, Canadian Metallurgical Quarterly 37(5) (1998) 343-378.
[5] P. Minnebo, K.F. Nilsson, D. Blagoeva, Tensile, compression and fracture properties of thick-walled ductile cast iron components, J Mater Eng Perform 16(1) (2007) 35-45.
[6] H. Nakae, H. Shin, Effect of graphite morphology on tensile properties of flake graphite cast iron, Materials Transactions(Japan) 42(7) (2001) 1428-1434.
[7] L. Ceschini, A. Morri, A. Morri, E. Salsi, R. Squatrito, I. Todaro, L. Tomesani, Microstructure and mechanical properties of heavy section ductile iron castings: experimental and numerical evaluation of effects of cooling rates, Int J Cast Metal Res 28(6) (2015) 365-374.
[8] M. Hafiz, Mechanical properties of SG-iron with different matrix structure, J Mater Sci 36(5) (2001) 1293-1300.
[9] A. Jarfors, S. Seifeddine, J. Olofsson, I.L. Svensson, Critical Description of Defects and Mechanical Behaviour in Casting Process Modelling of Light Metals for Automotive Use, 22nd International Conference on Processing and Fabrication of Advanced Materials (PFAM XXII), Singapore, 18-20 December, 2013, 2013.
[10] M. Wessen, On the mechanism of structure formation in nodular cast iron, Division of component technology, Jönköping University, Jönköping, 1997.
[11] L.E.H. Bjorkgen, K. , Silicon alloyed ductile iron with excellent ductility and machinability, Hommes et Fonderie(France) 307 (2000) 10-20.
[12] E. Foglio, M. Gelfi, A. Pola, S. Goffelli, D. Lusuardi, Fatigue Characterization and Optimization of the Production Process of Heavy Section Ductile Iron Castings, International Journal of Metalcasting 11(1) (2017) 33-43.
[13] R. Larker, Solution strengthened ferritic ductile iron ISO 1083/JS/500-10 provides superior considtent properties in hydraulic rotators, China Foundry 6(4) (2009) 343-351.
[14] W. Stets, H. Löblich, G. Gassner, P. Schumacher, Solution Strengthened Ferritic Ductile Cast Iron Properties, Production and Application, International Journal of Metalcasting 8(2) (2014) 35-40. [15] U. de La Torre, A. Loizaga, J. Lacaze, J. Sertucha, As cast high silicon ductile irons with optimised mechanical properties and remarkable fatigue properties, Mater Sci Tech-Lond 30(12) (2014) 1425-1431.
[16] P. Donelan, Modelling microstructural and mechanical properties of ferritic ductile cast iron, Mater Sci Tech-Lond 16(3) (2000) 261-269.
[17] O. Yanagisawa, T. Lui, Effect of carbon content and ferrite grain size on the tensile flow stress of ferritic spheroidal graphite cast iron, Metallurgical Transactions A 16(4) (1985) 667-673.
[18] J. Olofsson, I.L. Svensson, The effects of local variations in mechanical behaviour–Numerical investigation of a ductile iron component, Mater Design 43 (2013) 264-271.
[19] R. Ghasemi, J. Olofsson, A.E.W. Jarfors, I.L. Svensson, Modelling and simulation of local mechanical properties of high silicon solution-strengthened ferritic compacted graphite iron, Int J Cast Metal Res (2016) 1-8.
[20] M. Wessén, I.L. Svensson, R. Aagaard, Influence of antimony on microstructure and mechanical properties in thick- walled ductile iron castings, Int J Cast Metal Res 16(1-3) (2003) 119-124.
[21] Z.H. Li, Y.X. Li, Effect of Sb on the graphite morphology and mechanical properties in heavy section ductile iron, Materials Science Forum, Trans Tech Publ, 2005, pp. 2769-2772.
[22] ASTM Standard E2567-13a, 2013,"Standard Test Method for Determining Nodularity And Nodule Count In Ductile Iron", ASTM Internationals, West Conshohocken, PA, 2013, DOI:10.1520/E2567–13A, www.astm.org.
[23] E. ISO, 6892-1 Metallic materials Tensile testing Part 1: Method of test at room temperature, International Organization for Standardization (2009).
[24] A. Standard, E562-11, Standard Test Method for Determining Volume Fraction by Systematic Manual Point Count, Oct., ASTM International, West Conshohocken, PA (2011).
[25] D. Ludwigson, Modified stress-strain relation for FCC metals and alloys, Metallurgical Transactions 2(10) (1971) 2825-2828.
[26] I.L. Svensson, K. Salomonsson, Mathematical characterization of the tensile deformation curve of cast iron materials, 10th International Symposium on the Science and Processing of Cast Iron – SPCI11 2017.
[27] S. Kim, S.L. Cockcroft, A.M. Omran, Optimization of the process parameters affecting the microstructures and properties of compacted graphite iron, J Alloy Compd 476(1–2) (2009) 728-732. [28] S. Bockus, G. Zaldarys, Influence of the section size and holding time on the graphite parameters of ductile iron production, Metalurgija 48(1) (2009) 19.
[29] X.G. Diao, Z.L. Ning, F.Y. Cao, S.Z. Ren, J.F. Sun, Effects of antimony addition and section size on formation of chunky graphite in ductile iron, Mater Sci Tech-Lond 27(4) (2011) 834-838.
[30] E. Dötsch, Melting Processes for Iron and Non-Iron Materials, Induction Heating and Heat Treatment, ASM Handbook, ASM International2014.
[31] M. Górny, E. Tyrała, Effect of cooling rate on microstructure and mechanical properties of thin-walled ductile iron castings, J Mater Eng Perform 22(1) (2013) 300-305.
[32] K.-F. Nilsson, D. Blagoeva, P. Moretto, An experimental and numerical analysis to correlate variation in ductility to defects and microstructure in ductile cast iron components, Engineering Fracture Mechanics 73(9) (2006) 1133-1157.
[33] L. Bjorkegren, K. Hamberg, Silicon alloyed ductile iron with excellent ductility and machinability, Hommes et Fonderie(France) 307 (2000) 10-20.
[34] I. Svensson, T. Sjögren, On Modeling and Simulation of Mechanical Properties of Cast Irons with Different Morphologies of Graphite, International Journal of Metalcasting 3(4) (2009) 67-77.
[35] A. Alhussein, M. Risbet, A. Bastien, J.P. Chobaut, D. Balloy, J. Favergeon, Influence of silicon and addition elements on the mechanical behavior of ferritic ductile cast iron, Materials Science and Engineering: A 605 (2014) 222-228.
[36] O. Yanagisawa, T.S. Lui, Effect of carbon content and ferrite grain size on the tensile flow stress of ferritic spheroidal graphite cast iron, Metallurgical Transactions A 16(4) (1985) 667-673.
[37] G. Box, W. Hunter, J. Hunter, S. Addelman, S. Fienberg, J.W. Drane, W. Kruskal, J. Tanur, J.E. Jackson, G. Judge, Statistics for Experimenters, 1979.