This copy is an author generated postprint of
“Variation in costs of CBCT examinations among health care systems” Dentomaxillofacial Radiology 2012,
Volume 41, Issue 7, Pages 571-577
The definitive published version can be found on the publisher’s website. http://dx.doi.org/10.1259/dmfr/22131776
Variation in costs of CBCT examinations
among health care systems
Abstract
Objectives: To analyse the costs of Cone Beam Computed Tomography (CBCT) in different
health care systems for patients with different clinical conditions. Methods: Costs were calculated for CBCT performed in Cluj (Romania), Leuven (Belgium), Malmö (Sweden), and Vilnius (Lithuania) on patients with (i) a maxillary canine with eruption disturbance, (ii) an area with tooth loss prior to implant treatment or (iii) a lower wisdom tooth planned for removal. The costs were calculated using an approach based on the identification,
measurement, and valuation of all resources used in the delivery of the service that combined direct costs (capital equipment, accommodation, labour) with indirect costs (patients’ and accompanying persons’ time, “out of pocket” costs for examination fee and visits). Results: The estimates for direct and indirect costs varied among the health care systems, being highest in Malmö and lowest in Leuven. Variation in direct costs was mainly due to different capital costs for the CBCT-equipment arising from differences in purchase prices (range 148 000 – 227 000€). Variation in indirect costs were mainly due to examination fees (range 0 – 102.02€). Conclusions: Cost analysis provides an important input for economic evaluations of diagnostic methods in different health care systems and for planning of service delivery. Additionally, it enables decision makers to separate variations in costs between systems into those due to external influences and those due to policy decisions. A cost evaluation of a dental radiographic method cannot be generalised from one health care system to another, but must take into account these specific circumstances.
Key-words: Cone-Beam Computed Tomography, Costs and Cost Analysis, Diagnostic, Oral
Introduction
The use of Cone-Beam Computed Tomography (CBCT) in clinical dental practice has increased rapidly over the last decade,. Examinations with CBCT are currently used in the diagnosis of various maxillofacial conditions, either as an addition or as a substitute to previously used imaging methods. The diagnostic accuracy of CBCT has been reported as higher than that of conventional imaging methods in in vitro studies on furcation
involvements1,2, periapical lesions3,4; and teeth with eruption disturbances5. However for health care systems faced with limited resources the question that decision-makers need to address is whether the additional benefits of CBCT-imaging justify any additional costs incurred. Economic evaluations are therefore important when establishing selection criteria and guidelines of a new imaging method6.
To our knowledge there is only one study of the economic costs of different diagnostic methods used in oral health care7. This study models the costs of true-positive occlusal dentine caries detection for (i) visual-tactile examination, (ii) visual-tactile examination combined with bitewing radiographs, and (iii) selective radiographic examination of patients with lesions detected clinically by applying the prevailing charges per item of service in the public health care system in Sweden to assumptions about specificity and sensitivity of alternative approaches.7 As Drummond et al6 note there is probably no substitute for a well-conducted original costing study based on primary data collection. Cost-calculations based on patient-level data will give more valid results than those of a model analysis based on
assumptions. We anticipate that difference in cost between CBCT and conventional imaging methods may vary both within and among different health care systems. Within a health care system differ examinations of patients with different clinical conditions may require varying number of CBCT volumes while among different health care systems the configuration of
services, distribution of facilities and health care polices concerning access to care may differ. The aim of this study was, therefore to analyse the costs of CBCT in different health care systems for patients with different clinical conditions.
Materials and methods
The health care systems selected were four departments using the following CBCT machines: New Tom 3G (QR, Italy) purchased 2006 in the Faculty of Dental Medicine, University of
Medicine and Pharmacy in Cluj-Napoca, Romania,
Scanora (Soredex, Finland) purchased 2008 in the Oral Imaging Centre, Katholieke Universiteit Leuven, Belgium,
Accuitomo MCT-1 (Morita, Japan) purchased 2003 in the Department of Oral and Maxillofacial Radiology, Malmö University, Sweden,
New Tom CVT 9000 (QR, Italy) purchased 2002 in the Vilnius University, Vilnius, Lithuania.
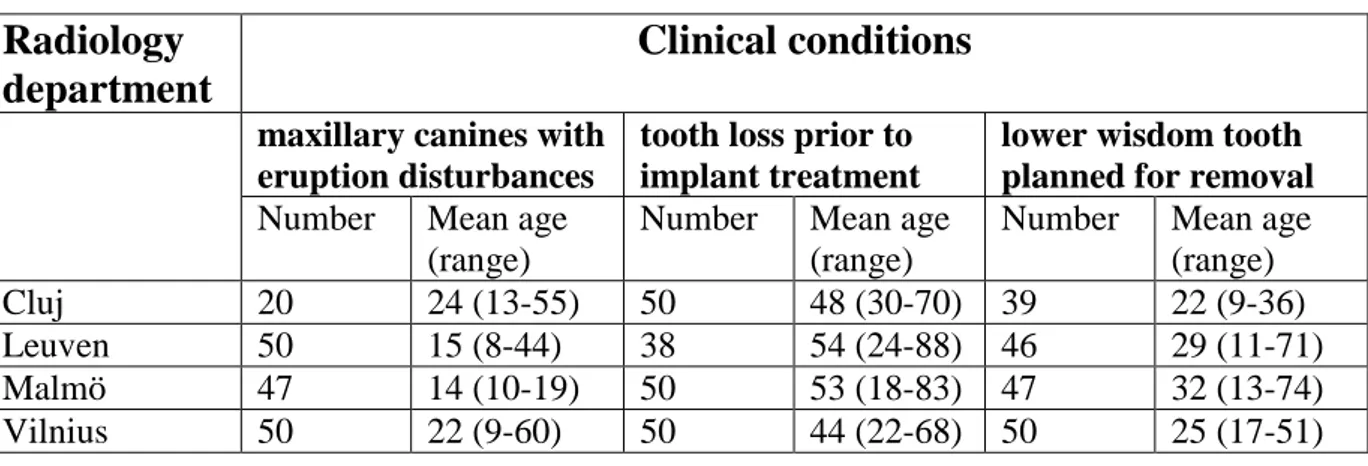
CBCT examinations were performed on three different patient groups: patients with (i) a maxillary canines with eruption disturbance, (ii) an area of tooth-loss prior to implant treatment, and (iii) a lower wisdom tooth planned for removal. All patients referred for a CBCT examination during the period March 2009 - March 2010 were included in the study. Table 1 presents the number and age of study patients with different clinical conditions.
Cost calculations
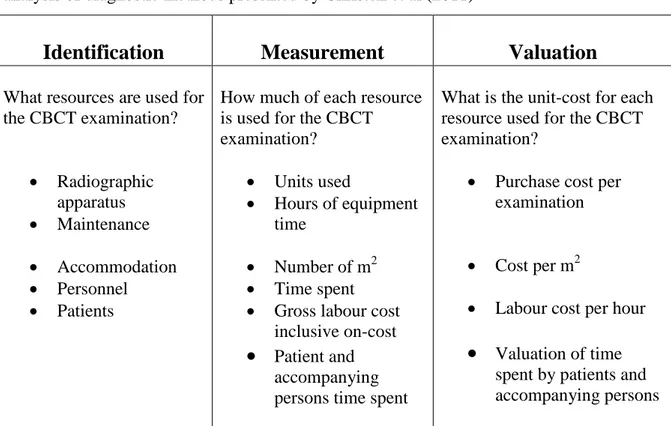
The costs of the CBCT examinations were calculated using an approach for costing diagnostic methods described previously8. Table 2 presents an overview of the approach, which consists of three steps:
identification of different resources used
measurement of the quantity used of each resource monetary valuation of the total resources used.
This approach calculates an average cost per CBCT examination based on the sum of direct costs (costs of delivering the service) and indirect costs (costs incurred by patients in using the service) 8. Data for the cost calculations were collected using three data collection
instruments:
a protocol for apportioning the cost of capital equipment to each procedure
a form for measuring the time of health care providers devoted to the examinations a patient survey to measure the time and other costs for patients and accompanying
persons.
2.1 Direct costs
The direct costs cover the costs of capital equipment (radiographic apparatus, computers, digital screens), accommodation, (clinic and office space), and provider time (radiologist, radiographer, imaging technician, dental nurse etc.) in each of the health care systems. The annual cost for the radiographic apparatus was calculated by dividing the purchase cost by the expected lifetime. The annual cost of equipment was divided by the number of CBCT
volumes taken during 2008 (450 in Cluj, 1500 in Leuven, 948 in Malmö, 435 in Vilnius) to produce the average cost per volume. This was then multiplied by the average number of volumes taken per examination of each clinical condition to give an average cost per examination.
Costs associated with maintenance and repairs were based on a mixture of costs for prepaid maintenance contracts and actual repair costs. For service contracts, the contract cost for 2008 was used. For repair costs an average annual figure for the period 2005-2008 was calculated in order to smooth out fluctuations in actual repair costs over time. The cost for the clinic and office accommodation was calculated by applying the cost per m2 used by the hospital finance department (including costs for services such as cleaning and utilities such as lighting and heating), to the area of accommodation used. The area was estimated from the construction maps of the clinics. Where the hospital finance department was unable to provide a cost per m2 for office accommodation, the rental cost in the local property market for equivalent (size and location) office space was used.
The calculation of the cost of providers´ time is based on the annual salary together with the overhead cost of employment. The total annual employment cost is divided by the total working hours of the providers to produce and employment cost per worked hour. Estimation of the working-time spent by the specialists or the radiographers for the imaging process was based on direct observation and recorded on the data collection form. In Cluj and Vilnius, the examinations were performed by radiologists, in Leuven by radiographers and in Malmö by dental nurses. Provider time included time for patient-related administration, the actual examination, the imaging process and post-imaging procedures. Estimation of the time spent by the radiologists for interpreting the CBCT images and writing the radiological report was based on direct observation of one radiologist performing these tasks for a subsample of 20 patient images in Malmö.
The indirect costs included the time spent by the patients (and where applicable an
accompanying person), for travelling to, waiting for and undergoing the examination, as well as “out of pocket cost” for transport (fares) and services (patient charges). Information on travel time, distances and out of pocket costs were collected in the patient survey using self-reported data for each patient and accompanying person.
For several patients in Cluj, Leuven and Vilnius, the visit to the radiology department was added on to a visit to another clinic e.g. the orthodontic clinic or the maxillo-facial surgery clinic at the same facility. Hence, for these patients no additional travel costs were incurred. Patients’ costs were limited to time spent waiting for and undergoing the examination and any examination fees.
For patients and accompanying persons 18 years or over, the value of time was based on an average gross annual earnings for 2007 from Eurostat Statistics9 for Romania, Belgium and Sweden respectively and on the gross average monthly earnings for 2007 taken from Statistics Lithuania10 multiplied by 12 for Lithuania. These annual earnings figures were then divided by the number of working-days (holidays and vacations excluded) in 2008 to get the average earnings per worked day and then divided by eight (the number of working-hours per day) to get an estimate of the average wage rate per hour of 1.96€ in Cluj, 16.85€ in Leuven, 16.80€ in Malmö, and 2.84€ in Vilnius. These data were used as a measure of the value of adults’ time in each system.
For patients below 18 years, the value of time (per hour) was valued at 0.40€ in Cluj, 6.72€ in Leuven, 7.84€ in Malmö, and 0.72€ in Vilnius. These values were based on the minimum wage rates for Belgium, Lithuania and Romania11. For 2008 there was no national minimum
wage for Sweden. We therefore used the last reported national minimum wage for 2004 12.and increased this by 2.5% per year based on increases reported for collective bargaining
agreements.
The transport cost per kilometre for patients using private transport was based on rates used by Rotary International for 200813 Average parking cost per patient was estimated using survey responses for a subsample of patients. Public transport fares were not included because most patients using public transport were holders of prepaid fixed price public transit passes.
The study was conducted in accordance with the ethical principles of the World Medical Association Declaration of Helsinki (2008 version) and approved by the Iuliu Hatieganu University of Medicine and Pharmacy in Cluj-Napoca Ethics Committee, Romania (18514/4.09.2008), Commission for Medical Ethics of the Faculty of Medicine of the Katholieke Universiteit Leuven, Belgium (B32220083749)Regional Ethical Review Board, Lund, Sweden (H15 606/2008) and Vilnius regional committee for biomedical research ethics, Lithuania (2010-05-05 Nr. 158200-01-138-39).
Results
Costs of CBCT examinations in different health care systems
The estimates of direct costs and indirect costs of CBCT examinations varied among the health care systems (Table 3 – 5), being highest in Malmö and lowest in Leuven, irrespective of clinical condition examined. The variation among systems in direct costs was mainly due to different capital costs for the CBCT equipment arising from differences in the purchase price of the equipment. Compared to cost of 147 880€ in Cluj (year 2006) the purchase cost was 37% higher in Malmö (year 2003), 52% higher in Vilnius (year 2002) and 8% higher in
Leuven (year 2008). As a result of the different age of equipment and local purchasing policy relating to maintenance costs, the costs of repairs and maintenance also differed between the health care systems.
The accommodation cost per examination varied across systems (1.29€ in Cluj, 1.60€ in Leuven, 6.14€ in Malmö and 1.82€ in Vilnius) as a result of differences in the space for accommodation (19m2 in Cluj, 6m2 in Leuven, 16m2 in Malmö. 28 m2 in Vilnius) and the cost per m2 ( 30.49€ in Cluj, 400.00€ in Leuven, 215.00€ in Malmö, 20.29€ in Vilnius).
Indirect costs also varied among systems (Tables 3-5) with average indirect costs per patient
being highest in Malmö (between 59.44 - 147.48€ according to clinical condition), second highest in Vilnius (21.73 - 100.09€), third highest in Cluj (90.43 – 96.30€), and lowest in Leuven (21.76 – 41.96€). Overall where examination fees were charged, these comprised the major part of the indirect costs.
The visit to the radiology department for examination was added on to a visit to another clinic in 30-50% of the patients in Cluj, 23-61 % in Leuven and 34-66 % of the patients in Vilnius. In Malmö all visits to the radiology department represented separate trips for the patient..
The valuation of the time spent by the patients and - where applicable, by the accompanying person - resulted in the highest cost in Malmö, second highest in Leuven, third highest in Vilnius and lowest in Cluj. The range for the average travel distance to and from the radiology clinic for the three clinical conditions was shortest in Malmö (23-28 km), followed by Leuven (21-30 km), Vilnius (15-47 km) and longest in Cluj (72-126km).
The average waiting time (in min) per visit in the clinic was estimated to be 25 in Cluj, 19 in Malmö and 10 in both Leuven and Vilnius.
Costs of CBCT examinations of patients with different clinical conditions
The direct and indirect costs of examinations of patients with different clinical conditions within the same health care systems varied somewhat except for in Cluj, where the costs were similar for all clinical conditions examined (Tables 3-5). In Leuven, the indirect costs for examinations of maxillary canines with eruption disturbances were higher than those for the two other clinical conditions, arising from cost for the accompanying person´s time. In Malmö, the indirect cost for examination of maxillary canines was around half the cost of those of the other clinical conditions, since most patients with maxillary canines were below 19 years, the threshold for exemption from examination fees. In Vilnius, the fee for
examination prior to implant treatment was much higher than for the other conditions.
Discussion
Little is known of how differences between health care systems affect the costs of a diagnostic method. One reason for this is that there is a considerable variation in the methodology of the cost-analysis and the range of costs included in published studies14. Thus, the results of different studies are difficult to compare. The approach used in this study was based on three clearly defined steps: identification, measurement, and valuation of resources used for a diagnostic examination in oral health care. The three steps provide a coherent overview of the calculations and facilitate analyses of different direct and indirect costs that comprise the unit-cost of a diagnostic examination and were applied to the three most common clinical
Even when using this explicit, transparent costing approach, the measurement and valuation of resources underpinning the calculation of direct and indirect costs is complex and time-consuming. Data collection often requires a range of different sources for the required
information and the particular sources may differ between systems. In this study, the primary data collection e.g. the provider time by different providers, was performed by different individuals in each system. This may introduce problems with the accuracy of data collected in the separate systems resulting from pressures of work, and other system specific conditions.
The radiology clinics in Cluj (Romania), Leuven (Belgium), Malmö (Sweden), and Vilnius (Lithuania) were selected to participate as they represent different health care systems. The countries constitute different institutional structures and political contexts. The percentage of the GDP spent on health care is around 5% in Romania and Lithuania, approximately half of the corresponding share of GDP in Belgium. Similarly the government share of health care expenditure ranges from 66% in Romania to 85% in Sweden16.
There are few published studies on cost comparisons among health care systems in general6 and to our knowledge no studies exist on imaging methods in different oral health care systems. Therefore, a comparison of our results of a multi-centre study using the same methodology for costing was not possible. We might expect differences in costs associated with different “costs of living” and levels of wealth in the countries being compared, which would lie outside the control of health care managers and policy makers. There was, however, no clear association between the estimated costs and the economic well being of the country as measured by GDP per capita population. So although Belgium had a GDP per capita of 32,091€ in 200817 it had the lowest average cost per CBCT examination. Hence, in this study variations in cost could not be explained simply by the differences in economic well-being.
Instead we need to consider the configuration of service delivery in terms of the equipment used, the staff employed, the integration of the service into existing service delivery, the location of service and health care policies relating to direct patient payments.
The estimated direct costs of CBCT varied among the health care systems. Differences were due to different prices (price of the CBCT equipment, wage rates) and differences in the types of staff used. Prices of equipment and labour are generally outside the control of decision makers. For example, wage rates are often set through broad collective bargaining
mechanisms while new technology tends to be most expensive when it is first introduced with prices falling, often substantially, as the technology is disseminated. Hence early adopters such as Vilnius (purchased in 2002) paid a higher price than Cluj (purchased in 2006) for equipment from the same manufacturer. Paying a “higher price” is, however, not without some corresponding benefit, since the CBCT service has been available for use with patients in “early adopting” centres for several years prior to access being made available to patients in “late adopting” centres.
Decision makers may have control over the number of CBCT volumes being performed and the types of staff used. This provides decision-makers with opportunities to consider whether similar levels and quality of service could be provided using different configurations of service delivery. More CBCT volumes per machine were performed in Leuven than in Cluj with a similar equipment cost thus reducing the average equipment cost per volume. Higher volumes per year may represent a wider range of conditions for which CBCT is used, higher need populations, different thresholds for referral, different catchment populations, or a combination of these factors. In terms of staff used, the examinations were performed by nurses in Malmo, radiographers in Leuven and radiologists in Cluj and Vilnius. Moreover,
Malmo used two nurses per patient while the other centres delivered care using a single provider. Consideration might therefore be given to alternate staff configurations as ways of influencing service costs. For example if the CBCT examination could be performed safely using only one dental nurse, the cost per examination would be reduced by almost 5€ assuming no reduction in examination time. Substituting the specialist in Cluj or in Vilnius with a radiographer for the examination would reduce the cost per examination by 1 – 1.5€.
The accommodation cost per square meter and the space required for the CBCT equipments varied among the health care systems, which may be the result of existing physical structure of clinic space. Although the cost per square meter was almost twice as high in Leuven compared to that in Malmö and about ten times higher than those in Cluj and Vilnius, the average cost for accommodation in Leuven was about the same as in Cluj and Vilnius due to the minimal amount of space partitioned off to the CBCT equipment.
Indirect costs
The most significant part of the indirect costs was the examination fee paid by the patients. Patient charges were relatively low in Leuven, but relatively high in Cluj and Malmö. The examination fee paid by the patient also varied according to the clinical condition examined. In Malmö, there was no patient charge for CBCT examinations of maxillary canines with eruption disturbances. In Vilnius, the fee was high for patients with tooth loss examined prior to implant treatment, but low for other clinical conditions. Because patient charges lie outside the control of those responsible for delivering the service, they represent external influences on the observed cost differences between systems and conditions. However, patient charges are likely to influence the volume of examinations performed, and hence the direct cost per examination, unless patients have some form of insurance through which such costs can be
recovered. Policy makers at the higher level may need to be engaged in order to understand the impact of patient charges on indirect costs and hence utilisation and the impact this may have on direct costs.
The transport cost for the patient was highest in Cluj because of the longer travel distances for patients. The clinic in Cluj serves a large geographic catchment population as the clinic is home to one of only two CBCT machines in Romania. A further factor influencing indirect costs is the patient’s (and accompanying person’s) time, which is highly dependent on the organisation of the service. In Cluj, Leuven, and Vilnius, between 23 and 66 percent of the patients arrived at the radiology clinic directly from another clinic in the same facility resulting in a lower average time per patient than in Malmö, where no patients came directly from another clinic. Every patient in Malmo was required to make a separate trip to the radiology clinic for a CBCT examination. Clearly the definition of catchment populations and the integration of services into care episodes provide further opportunities for finding cost savings in the delivery of CBCT examinations.
In conclusion, a cost evaluation of a dental radiographic method cannot be generalised from one health care system to another but must take into account the specific circumstances. The estimated cost of a CBCT examination of patients with different clinical conditions -
maxillary canine with eruption disturbances, tooth loss prior to implant treatment, and lower wisdom tooth planned for removal - vary considerably across the four health care systems studied. In the same way, because costs might differ among systems, an intervention or procedure that is cost-effective in one system might not be cost-effective in another system, even though the effectiveness of the intervention or procedure is the same in both settings18. The cost analysis provides an important input for economic evaluations in comparing costs
and consequences of diagnostic methods in different health care systems, and for planning service delivery in both public and private sectors.
Acknowledgements
The research leading to these results has received funding from the European Atomic Energy Community’s Seventh Framework Programme FP7/2007-2011 under grant agreement no 212246 (SEDENTEXCT: Safety and Efficacy of a New and Emerging Dental X-ray Modality).
References
1. Vandenberghe B, Jacobs R, Yang J. Detection of periodontal bone loss using digital intraoral and cone beam computed tomography images: an in vitro assessment of bony and/or infrabony defects. Dentomaxillofac Radiol 2008;37:252-260.
2. Noujeim M, Prihoda T, Langlais R, Nummikoski P. Evaluation of high-resolution cone beam computed tomography in the detection of simulated interradicular bone lesions. Dentomaxillofac Radiol. 2009;38:156-162.
3. Stavropoulos A, Wenzel A. Accuracy of cone beam dental CT, intraoral digital and conventional film radiography for the detection of periapical lesions. An ex vivo study in pig jaws. Clin Oral Investig 2007;1:101-106.
4. Sogur E, Baksi BG, Gröndahl HG, Lomcali G, Sen BH. Detectability of chemically induced periapical lesions by limited cone beam computed tomography, intra-oral digital and conventional film radiography. Dentomaxillofac Radiol. 2009;38:458-464. 5. Alqerban A, Jacobs R, Souza PC, Willems G. In-vitro comparison of 2 cone-beam
computed tomography systems and panoramic imaging for detecting simulated canine impaction-induced external root resorption in maxillary lateral incisors. Am J Orthod Dentofacial Orthop. 2009;136:764-11; discussion 764-5.
6. Drummond MF, Sculpher MJ, Torrance GW, O´Brien BJ, Stoddart GL. Methods for the economic evaluation of health care programmes. (3rd edn). Oxford: Oxford University Press, 2005.
7. Norlund A, Axelsson S, Dahlén G, Espelid I, Mejàre I,Tranaeus S, Twetman S. Economic aspects of the detection of occlusal dentine caries. Acta Odontol Scand 2009;67:38-43.
8. Christell H, Birch S, Horner K, Rohlin M, Lindh C. A frame-work for costing diagnostic methods in oral health care. An application comparing a new imaging technology with a conventional approach for maxillary canines with eruption disturbances. Submitted to Community Dent Oral Epidemiol 2010.
9. Eurostat Statistics. [Internet]. Structure of Earnings Survey (SES), 2007. [Updated 2011 Feb 15; cited 2011 Feb 15]. Available from:
http://epp.eurostat.ec.europa.eu/tgm/table.do?tab=table&init=1&language=en&pcode =tps00175&plugin=1
10. Lithuanian Statistics, [Internet]. Average gross monthly earnings. [Updated 2011 Feb 15; cited 2011 Feb 15]. Available from:
http://www.stat.gov.lt/en/pages/view/?id=1350
11. Eurostat Statistics. [Internet]. Minimum wages 2007. Structure of Earnings Survey (SES), 2009. [Updated 2010 July 5; cited 2010 March 5] Available from:
http://epp.eurostat.ec.europa.eu/portal/page/portal/product_details/publication?p_prod uct_code=KS-CD-09-001
12. Skedinger P. Hur höga är minimilönerna? The Institute for Labour Market Policy Evaluation, IFAU 2004. Rapport 2005:18 IFAU, p 28. (in Swedish)
13. Rotary International, The Rotary Foundation, ‘mileage reimbursement rates’. [Updated 2011 Feb 15; cited 2011 Feb 15]. Available from:
http://www.rotary.org/RIdocuments/en_pdf/rits_mileage_rates_en.pdf
14. Adam T, Evans DB, Koopmanschap MA. Cost-effectiveness analysis: can we reduce the variability in costing methods? Int J Technol Assess Health Care 2003;19:407-20. 15. SEDENTEXCT [Internet]. Work Package 5: Cost-effectiveness. 2007. [Updated 2011
March 21; cited 2011 March 21]. Available from:
http://www.sedentexct.eu/content/work-package-5-cost-effectiveness.
16. Kravitz AS, Treasure ET, The Council of European Dentists, EU Manual of Dental Practice: (version 4.1 2009), October, 2009.
17. World Bank Data [Internet]. GDP per capita (current US[Updated 2010 Nov 21; cited 2010 Nov 21]. Available from:
http://data.worldbank.org/indicator/NY.GDP.PCAP.CD$).
18. Birch S, Gafni A. Economics and the evaluation of health care programmes: Generalisability of methods and implications for generalisability of results. Health Policy 2003; 64: 207-19
Table 1 Number and age (mean age and range) of patients with different clinical conditions
examined with CBCT in four radiology departments representing different health care systems.
Radiology
department
Clinical conditions
maxillary canines with eruption disturbances
tooth loss prior to implant treatment
lower wisdom tooth planned for removal
Number Mean age (range)
Number Mean age (range)
Number Mean age (range)
Cluj 20 24 (13-55) 50 48 (30-70) 39 22 (9-36)
Leuven 50 15 (8-44) 38 54 (24-88) 46 29 (11-71)
Malmö 47 14 (10-19) 50 53 (18-83) 47 32 (13-74)
Table 2 Overview of the steps performed in cost-analysis of the CBCT examinations of
patients in different health care systems. The overview is based on the framework for cost-analysis of diagnostic methods presented by Christell et al (2011)
Identification
Measurement
Valuation
What resources are used for the CBCT examination? Radiographic apparatus Maintenance Accommodation Personnel Patients
How much of each resource is used for the CBCT examination? Units used Hours of equipment time Number of m2 Time spent Gross labour cost
inclusive on-cost
Patient andaccompanying persons time spent
What is the unit-cost for each resource used for the CBCT examination?
Purchase cost per examination
Cost per m2
Labour cost per hour
Valuation of timespent by patients and accompanying persons
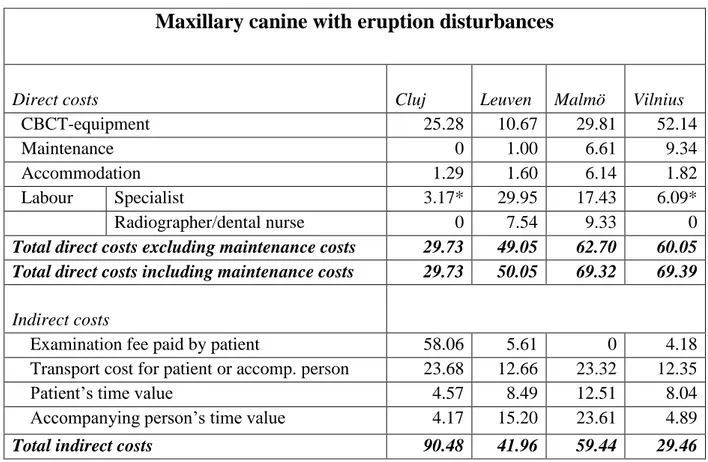
Table 3 Direct and indirect costs of a CBCT examination of a patient with maxillary canine
with eruption disturbances in different health care systems. Costs in Euro.
* The specialist performed both the examination and the report
Maxillary canine with eruption disturbances
Direct costs Cluj Leuven Malmö Vilnius
CBCT-equipment 25.28 10.67 29.81 52.14
Maintenance 0 1.00 6.61 9.34
Accommodation 1.29 1.60 6.14 1.82
Labour Specialist 3.17* 29.95 17.43 6.09*
Radiographer/dental nurse 0 7.54 9.33 0
Total direct costs excluding maintenance costs 29.73 49.05 62.70 60.05 Total direct costs including maintenance costs 29.73 50.05 69.32 69.39
Indirect costs
Examination fee paid by patient 58.06 5.61 0 4.18
Transport cost for patient or accomp. person 23.68 12.66 23.32 12.35
Patient’s time value 4.57 8.49 12.51 8.04
Accompanying person’s time value 4.17 15.20 23.61 4.89
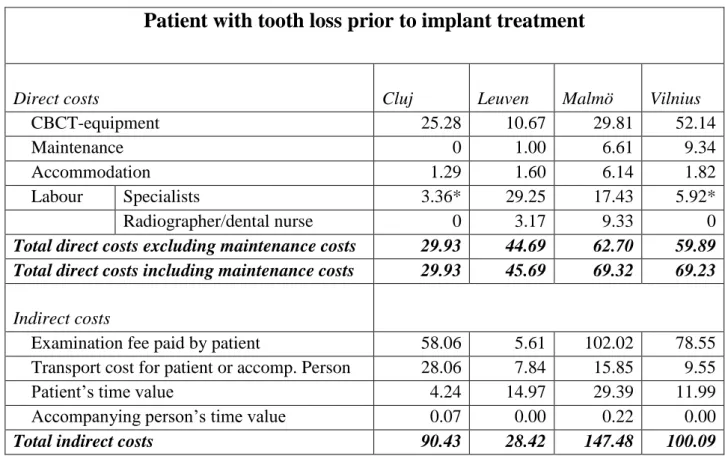
Table 4 Direct and indirect costs of a CBCT examination of a patient with tooth loss prior to
implant treatment in different health care systems. Costs in Euro.
* The specialist performed both the examination and the report
Patient with tooth loss prior to implant treatment
Direct costs Cluj Leuven Malmö Vilnius
CBCT-equipment 25.28 10.67 29.81 52.14
Maintenance 0 1.00 6.61 9.34
Accommodation 1.29 1.60 6.14 1.82
Labour Specialists 3.36* 29.25 17.43 5.92*
Radiographer/dental nurse 0 3.17 9.33 0
Total direct costs excluding maintenance costs 29.93 44.69 62.70 59.89 Total direct costs including maintenance costs 29.93 45.69 69.32 69.23
Indirect costs
Examination fee paid by patient 58.06 5.61 102.02 78.55
Transport cost for patient or accomp. Person 28.06 7.84 15.85 9.55
Patient’s time value 4.24 14.97 29.39 11.99
Accompanying person’s time value 0.07 0.00 0.22 0.00
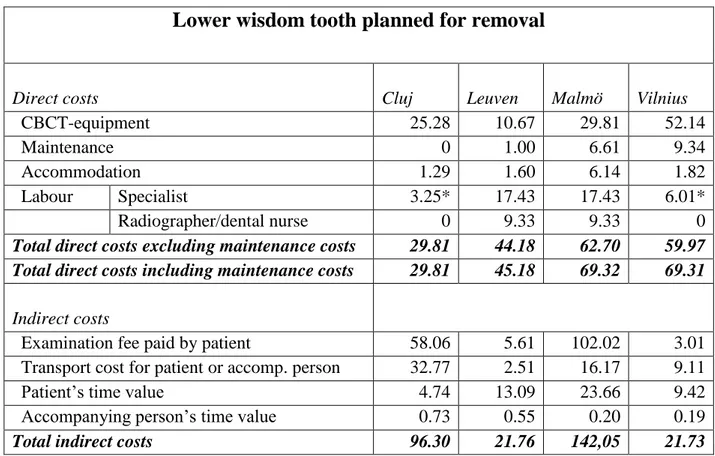
Table 5 Direct and indirect costs for a CBCT examination of a patient with a lower wisdom
tooth planned for removal in different health care systems. Costs in Euro.
* The specialist performed both the examination and the report
Lower wisdom tooth planned for removal
Direct costs Cluj Leuven Malmö Vilnius
CBCT-equipment 25.28 10.67 29.81 52.14
Maintenance 0 1.00 6.61 9.34
Accommodation 1.29 1.60 6.14 1.82
Labour Specialist 3.25* 17.43 17.43 6.01*
Radiographer/dental nurse 0 9.33 9.33 0
Total direct costs excluding maintenance costs 29.81 44.18 62.70 59.97 Total direct costs including maintenance costs 29.81 45.18 69.32 69.31
Indirect costs
Examination fee paid by patient 58.06 5.61 102.02 3.01
Transport cost for patient or accomp. person 32.77 2.51 16.17 9.11
Patient’s time value 4.74 13.09 23.66 9.42
Accompanying person’s time value 0.73 0.55 0.20 0.19