Faculty of Veterinary Medicine and Animal Science
Stress and meat quality in two lines of the
Yorkshire pig breed: Swedish and Dutch
Stress och köttkvalitet i två linjer av grisrasen Yorkshire: svensk
och nederländsk
Stress and meat quality in two lines of the Yorkshire pig breed:
Swedish and Dutch
Stress och köttkvalitet i två linjer av grisrasen Yorkshire: svensk och nederländsk
Andreas Andersson
Supervisor: Anna Wallenbeck, Swedish University of Agricultural Sciences, HMH Assistant supervisor: Anders Karlsson, Swedish University of Agricultural Sciences, HMH Examiner: Nils Lundeheim, Swedish University of Agricultural Sciences, HGEN
Credits: Level: Course title: Course code: Programme: 30 credits A2E
Degree project in Animal Science EX0872
Agriculture Programme – Animal Science
Course coordinating department: Department of Animal Breeding and Genetics
Place of publication: Year of publication: Cover picture: Online publication: Keywords: Uppsala 2019 Andreas Andersson https://stud.epsilon.slu.se
Swedish Yorkshire, Dutch Yorkshire, Stress, meat quality, behaviour test, Novel Arena test, Startle test, lactate, temperature and pH
Pigs are exposed to several different environmental stressors in the modern produc-tion from weaning, mixing, crowding etc. Preslaughter stressors may result in meat quality problems, such as the formation of pale, soft and exudative meat as well as the formation of dark, firm and dry meat, which makes the meat to be unattractive. In 2012, the Swedish Yorkshire (SY) was replaced with the Dutch Yorkshire of the Z-line (ZY) for financial decisions as well as the ZY having a more efficient breeding progress in the ZY line. The SY has been indirectly selected for social behaviours to a larger extent compared to the ZY since the sows of the SY has been selected in group housed systems while the sows of the ZY have been housed individually. The aim of this pilot study is therefore to investigate if there are differences in stress re-lated behaviours and meat quality between the SY and the ZY and between pigs pro-vided with social training (access pen) early in life with pigs not allowed social train-ing (control pen). The stress levels and meat quality were measured on in total of 60 pigs. Aiming to assess stress, a Novel Arena test and a Startle test were performed in the pig facility short before slaughter and a Novel Arena test was also performed at the slaughter plant. The lactate level in the blood and the temperature and pH of the carcass was measured at the slaughter plant. During the suckling period, half of the litters were in the access pen and had the opportunity to walk between two pens while the remaining stayed within their pen, control pen. The result showed that there were no significant differences in stress levels or meat quality between the breeds but the SY had a significant higher meat percentage (P=0.021) compared to the ZY, which may indicate that the ZY have a higher fat storage. If both of the breeds were kept in control pens during the suckling period, the ZY had a significant higher growth rate (P=0.008) and lower age at slaughter (P=0.008) compared to the SY. The pigs in the control pen performed significant more hesitation (P=0.01) and activity (P=0.038) compared to the pigs in the access pen in the Novel Arena test in the slaughter plant, which may indicate that the pigs in the control pen may have been more stressed. There was no significant difference in the meat quality for the different treatments. In conclusion, there is no significant difference in the stress levels and meat quality between the breeds. It may be a difference in stress levels between the treatments, where the pigs in the access pen and thus with extra social training were less stressed, but no significant difference between treatments was found for meat quality.
Keywords: Swedish Yorkshire, Dutch Yorkshire, stress, meat quality, behaviour test,
Novel Arena test, Startle test, lactate, temperature and pH
Grisar utsätts för flera olika typer av stress i den moderna produktionen från avvänj-ning, blandavvänj-ning, trängsel m.m. Stress innan slakt kan leda till köttkvalitetsproblem så som till exempel förekomst av blekt, mjukt och vattnigt kött samt bildandet av mörkt, fast och torrt kött som gör köttet oattraktivt. Den svenska yorkshire rasen (SY) ersat-tes år 2012 med den nederländska yorkshire rasen av Z-linjen (ZY) på grund av eko-nomiska anledningar samt att ZY har en mer effektiv avelsframgång. SY har indirekt avlats för socialt beteende i större utsträckning än ZY eftersom suggorna av SY har selekterats i grupphussystem medan suggorna av ZY har hållits individuellt. Syftet med denna pilotstudie är därför att undersöka om det finns skillnader i stressrelate-rade beteenden och köttkvalitet mellan SY och ZY samt mellan grisar som fått extra social träning (åtkomstbox) tidig i livet och grisar som inte fått extra social träning (kontrollbox). Stressnivån och köttkvaliteten mättes på totalt 60 grisar. Novel Arena test och Startle test utfördes i grisanläggningen för att mäta stress såväl som Novel Arena testet i slakteriet. Laktatnivån i blodet samt temperatur och pH i slaktkroppen mättes också på slakteriet. Under di-perioden var hälften av kullarna i en åtkomstbox och hade möjligheten att gå mellan två grisningsboxar medan de resterande stannade i sin egen box, kontrollbox. Resultatet visade att det inte fanns några signifikanta skillnader mellan stressnivåerna och köttkvaliteten mellan raserna, men SY hade en signifikant högre köttprocent (P=0,021) än ZY, vilket kan indikera att ZY har en högre fettlagring. Om båda raserna hölls i kontrollboxen under di-perioden så fick ZY en signifikant högre tillväxthastighet (P=0,008) samt lägre ålder vid slakt (P=0,008) jämfört med SY. Grisarna i kontrollboxen tvekade mer (P=0,01) och hade en högre aktivitet (P=0,038) jämfört med grisarna i åtkomstboxen under Novel Arena testet i slakteriet, vilket kan indikera att grisarna i kontrollboxen var mer stressade. Det fanns ingen signifikant skillnad i köttkvaliteten mellan de olika behandlingarna. Sammanfattningsvist så finns det ingen signifikant skillnad i stressnivåerna och kött-kvaliteten mellan raserna. Det kan vara en skillnad i stressnivåerna mellan behand-lingarna, där grisarna i åtkomstboxen och därmed med extra social träning var mindre stressade, men ingen signifikant skillnad mellan behandlingarna visades för köttkva-liteten.
Nyckelord: svensk yorkshire, nederländsk yorkshire, stress, köttkvalitet, beteende
test, Novel Arena test, Startle test, laktat, temperatur och pH
Skillnad i stress och köttkvalitet mellan den svenska
och den nederländska Yorkshire rasen?
År 2012 ersattes den svenska Yorkshire rasen (SY) med den nederländska Yorkshire rasen (ZY). Detta har resulterat till funderingar bland de svenska lantbrukarna kring grisarnas beteende och köttkvalitet. Har stressnivån och köttkvaliteten förbättrats el-ler försämrats vid bytet av Yorkshire linjen och är det en skillnad i stressnivån och köttkvaliteten hos grisarna vid olika uppfödningsförhållanden?
För att undersöka stressnivån och kött-kvaliteten har olika mätningar utförts in-nan och efter slakt på totalt 60 grisar av SY och ZY som växte upp under ett kon-ventionellt produktionssystem. Under di-perioden hölls hälften av SY och ZY i en åtkomstbox där de hade möjligheten till extra social träning genom att gå mellan två grisningsboxar. De resterande gri-sarna stannade i sin box (kontrollbox) och hade inte tillgång till social träning.
Sedan längre tillbaka har suggorna av SY avlats i grupphållningssystem (under dräktigheten) medan suggorna av ZY av-lats i ett system där suggorna hålls indi-viduellt under dräktigheten. Detta har re-sulterats till att SY har indirekt avlats för socialt beteende i en större utsträckning än vad ZY har. Detta kan innebära att SY är mindre stressad i grupphållningssy-stem och därmed bättre lämpad för såd-ana inhysningssystem jämfört med vad ZY är. Grisar utsätts för flera olika typer av stress i den moderna produktionen, från avvänjning, blandning, trängsel m.m. Kortvarig stress kan vara positivt då individen förbereds för att hantera far-liga situationer och därmed större sanno-likhet för överlevnad. Långvarig stress kan däremot ha en negativ inverkan och resultera i bland annat lägre välfärd och köttkvalitetsproblem. Några köttkvali-tetsproblem som kan uppstå är PSE som
gör köttet ljust, mjukt och vattning samt DFD som gör köttet mörkt, fast och torrt. Både PSE och DFD är oattraktivt för konsumenten och därmed kan vara nega-tivt för producenten och slaktaren då konsumenterna inte köper köttet.
Resultaten från den här studien visade att det inte fanns några signifikanta skillna-der mellan raserna för stressnivå eller köttkvalitet. Detta kan ses som positivt då det tyder på att bytet av ras inte har påverkat djuren eller produktionen nega-tivt. SY hade däremot en signifikant högre köttprocent än ZY, vilket kan indi-kera att ZY har en högre fettlagring. Om båda raserna hölls i kontrollboxen under di-perioden så fick ZY en signifikant högre tillväxthastighet samt lägre ålder vid slakt jämfört med SY. Grisarna i kon-trollboxen visade mer stressbeteenden vid ett mättillfälle, vilket kan innebära att grisarna från kontrollboxen var mer stressade. Det fanns däremot ingen signi-fikant skillnad i köttkvaliteten mellan de olika behandlingarna. Sammanfattnings-vist så påvisades ingen signifikant skill-nad i stressnivåerna och köttkvaliteten mellan raserna. Det kan vara en skillnad i stressnivåerna mellan behandlingarna, där grisarna i åtkomstboxen var mindre stressade, men ingen signifikant skillnad mellan behandlingarna visades för kött-kvaliteten.
Abbreviations 5
1 Introduction 7
1.1 Aim of the study and hypothesis 8
2 Literature survey 9 2.1 Behaviours in pigs 9 2.1.1 Behaviour tests 9 2.1.2 Fear-associated behaviours 10 2.2 Stress 11 2.3 Meat quality 12 2.4 Pig breeding 14
3 Materials and methods 15
3.1 Animals 15
3.2 Housing and management 17
3.2.1 The Swedish Livestock Research Centre 17
3.2.2 Lövsta Kött AB 17
3.3 Behaviour tests 18
3.3.1 Test Arena 18
3.3.2 Batches 20
3.3.3 Test groups and test days 21
3.3.4 Novel Arena test (NAT) – The Swedish Livestock Research Centre 22 3.3.5 Startle test (ST) – The Swedish Livestock Research Centre 23 3.3.6 Novel Arena test (NAT) – Lövsta Kött AB 27
3.4 Blood sample 28 3.4.1 Data recording 28 3.5 Temperature and pH 28 3.5.1 Data recording 29 3.6 Statistical analyses 29 3.6.1 Data editing 29 3.6.2 Descriptive analyses 30
3.6.3 Statistical analyses and models 31
4 Results 33
4.1 Descriptive results 33
4.1.1 Carcass information 33 4.1.2 Novel Arena test (NAT) – The Swedish Livestock Research Centre 34 4.1.3 Startle test (ST) – The Swedish Livestock Research Centre 35 4.1.4 Novel Arena test (NAT) – Lövsta Kött AB 36
4.1.5 Blood sample 37
4.1.6 Temperature and pH 37
4.2 Results from the statistical analyses 40
4.2.1 Carcass information 40
4.2.2 Novel Arena test (NAT) – The Swedish Livestock Research Centre 41 4.2.3 Startle test (ST) – The Swedish Livestock Research Centre 41 4.2.4 Novel Arena test (NAT) – Lövsta Kött AB 41
4.2.5 Blood sample 42
4.2.6 Temperature and pH 42
5 Discussion 43
5.1 Aim of the study 43
5.2 Data collection 43
5.2.1 Carcass information 43
5.2.2 Novel Arena test (NAT) – The Swedish Livestock Research Centre 44 5.2.3 Startle test (ST) – The Swedish Livestock Research Centre 44 5.2.4 Novel Arena test (NAT) – Lövsta Kött AB 45
5.2.5 Blood sample 45
5.2.6 Temperature and pH 46
5.3 Method discussion 46
5.3.1 Animals 46
5.3.2 Novel Arena test (NAT) – The Swedish Livestock Research Centre 47 5.3.3 Startle test (ST) – The Swedish Livestock Research Centre 47 5.3.4 Novel Arena test (NAT) – Lövsta Kött AB 48
5.3.5 Blood sample 48 5.3.6 Temperature and pH 48 6 Conclusion 49 References 50 Acknowledgements 53 Appendix 1 55 Appendix 2 56 Appendix 3 57
Appendix 4 58
Appendix 5 59
Abbreviation Complete concept SY ZY NAT ST AP CP PSE DFD pHu ATP P-value N.s. i.e. e.g. Swedish Yorkshire Dutch Yorkshire, Z-line Novel Area test
Startle test Access pen Control pen
Pale, soft and exudative Dark, firm and dry Ultimate pH, 24 hours Adenosine triphosphate Probability value Non-significant That is For example
Abbreviations
In modern pig production, pigs (Sus Scrofa) are exposed to several different envi-ronmental stressors, such as weaning (Campbell et al., 2013; Kelley, 1980), mixing (D’Eath et al., 2010; Kelley, 1980), crowding (Sutherland et al., 2006), cold (Hicks
et al., 1998; Kelley, 1980), heat (Sutherland et al., 2006; Kelley, 1980), noise
(Talling et al., 1996; Kelley, 1980), restraint (Geverink et al., 2002; Kelley, 1980) and limited-feeding (Kelley, 1980). Geverink (1998) observed that preslaughter stressors can cause meat quality problems, such as the formation of pale, soft and exudative meat (PSE), which makes the meat unattractive and watery (Geverink, 1998). Another meat quality problem is the formation of dark, firm and dry meat (DFD), which makes the meat unattractive with dark colour and sticky texture (Scheffler & Gerrard, 2007). If the meat has a poor quality, the consumers may not purchase it and therefore may result in a reduced profitability for the producers, the slaughter companies and for the butchers.
In Swedish commercial production, crossbreeding is common practice. The ter-minal slaughter pig is in most cases a three-breed cross and the dam of the slaughter pig is a cross between Yorkshire and Landrace and the sire is either of Duroc or Hampshire breed. The dam of the slaughter pigs is a hybrid between two breeds to take advantage of the heterosis effect, especially for the traits increased vitality, fer-tility and litter size. Heterosis means crossing vitality, that is, the offspring´s genes surpass their parents through breeding depending on the breeding goals. Improved reproduction and fertility are the main breeding goals of the dam breeds and for the sire breeds it is improved growth rate and feed conversion ratio (NordicGenetics, 2012). The offspring from the three-breed crossing are expected to have a lower mortality rate, less diarrhoea, higher feed conversion ratio and higher growth rate compared to purebreds (Ewing, 2011). In 2012, the Swedish Yorkshire (SY) was replaced with the Dutch Yorkshire of the Z-line (ZY) (Brink, 2013; Hansson & Lundeheim, 2013), due to financial decisions as well as the ZY having a more effi-cient breeding progress (Hansson & Lundeheim, 2013). However, the ZY line has been selected in systems where sows are housed individually during gestation and
crated during farrowing and nursing while SY has been selected in systems with group housed sows during gestation and loose housing sows during farrowing and lactation (Lundeheim, 2017). Therefore, the SY has been indirectly selected for so-cial behaviours in sow groups to a larger extent than ZY. Thus, it may be interesting to investigate if there is a difference in the stress level between these breed lines in the Swedish production system. If there is a difference in the stress level for the breeds, it may also be interesting to investigate if there are differences in the meat quality, as stress levels may affect meat quality.
1.1 Aim of the study and hypothesis
The aim of this study is to investigate if there are differences in stress related be-haviours and meat quality between the breeds SY and ZY and between pigs pro-vided with social training early in life with pigs not allowed social training.
Hypothesis
• SY will perform less stress behaviours compared to the ZY due to they are indirectly selected for social behaviours to a larger extent compared to the ZY.
• ZY will have a better meat quality since they have a more efficient breeding progress compared to the SY.
• The pigs provided with a social training early in life will perform less stress behaviours because they have had the opportunity to meet unknown pigs from an early life but there will not be a difference in the meat quality be-tween the treatments.
2.1 Behaviours in pigs
Pigs are social animals that live in social groups in the wild. Under feral conditions, these groups typically consist of maternal groups with several adult females of dif-ferent ages and their offspring’s. Younger boars live in groups with other young boars while adult boar’s live solitary. To get a well-functioning production system in commercial pig production it is of high importance to take the basic behavioural patterns and needs of the pig into consideration. It is for example important to house pigs in relevant groups considering group size and age and gender distribution. Moreover, pigs kept under feral conditions spend the majority of their awake time foraging and eating in social groups and therefore it may be beneficial to give them the opportunity to eat together in captivity. Under wild and feral conditions pigs will stay intact within their group and will not accept unfamiliar pigs, which may result in aggressive behaviours such as fighting (Ewing, 2011). These aggressive behav-iours occur normally with the aim to defend the group and territory from unknown animals (Koolhaas et al., 1999). In modern pig production, different types of ag-gressive behaviours such as chasing, attacking and fighting have been observed be-tween pigs at mixing in the pig facility, at the slaughter truck and at the slaughter facility (D’Eath et al., 2010). These types of aggressive behaviours may be a result of fear and stress in the performing pig and may result in fear and stress for the receiver pig (Tuchscherer et al., 1998).
2.1.1 Behaviour tests
There are several different behavioural tests that are developed to investigate fear-fulness and stress in animals (Forkman et al., 2007). However, different factors may influence stress responses such as age, sex, previous experiences, social rank and
genetics. These factors are important to consider when analysing stress related be-haviours (Dwyer, 2004). Older pigs have been observed to show lower levels of fear and stress compared to younger pigs, which may show that fearfulness decline with age (Forkman et al., 2007; Janczak et al., 2003). Female pigs have been observed to have lower salivary cortisol concentration compared with castrated boars, which may indicate lower levels of fear among gilts and sows compared with castrated boars. However, castration may also influence fear levels (Reimert et al., 2014), since Vandenheede and Bouissou (1993) observed that ewes displayed more fearful reactions compared to intact rams (Vandenheede & Bouissou, 1993). Fearful reac-tions have not been studied enough amongst intact boars since the majority are cas-trated at an early age to reduce boar taint and aggressive behaviours (Reimert et al., 2014). Higher fear and stress levels has been observed among animals that have previously been mistreated compared to animals that have experienced a positive management (Grandin, 1997). Mixing unfamiliar animals may result into a stressful situation that could result in more fear and stress from aggressive behaviours, which is expressed in the formation of hierarchy in a group of animals (Arey & Edwards, 1998). The genetic composition may also influence the fearfulness, since pigs from breeds and lines where traits related to social characteristics in their breeding pro-gram showed lower levels of fear compared to pigs from breeds and lines where these characteristics were not considered in the genetic selection (Reimert et al., 2014).
2.1.2 Fear-associated behaviours
Fear is defined as an emotion which result in a sense of insecurity that occur when the individual perceives a situation as an actual danger, i.e. a situation that may ad-versely affect the individual. Fearfulness is a personality trait (i.e. repeatable within individual) which causes the individual to react and perform different types of be-haviours depending on how dangerous the individual perceives the situation (Boissy, 1995). Fear prepares the individual to cope with dangerous situations through behavioural and physiological reactions (Dwyer, 2004). Freeze, flight, fight and fright reactions can occur in fearful situations, where the goals of these behav-iours are to increase the likelihood of survival against potential threats. Freeze is defined as being alert and watchful. The freeze reaction may occur when threatened by predators as a reaction of fear. This is done as predators are more likely to notice moving objects than stagnant objects and thus the animals are less likely to being found. Flight is defined where the individual flees from the situation and fight de-scribes the action of physically defending themselves. Fright is a tonic immobility where the individual is “playing dead” and it is a form of paralysis (Bracha, 2004; Boissy, 1995). Other fear-related behaviours can be vocalization, exploratory,
aggression, feeding and sexual (Boissy, 1995). Defensive reactions are advanta-geous from an evolutionary perspective, since the life expectancy increases by avoiding predators. The behavioural responses from fear are still expressed from production animals, even though predators are usually absent from them (Dwyer, 2004). However, predators may be a problem for animals reared outdoors (Asheim & Mysterud, 2005). Fear can also be elicited by previous experiences and from hu-man contact (Rushen et al., 1999). It may be possible to reduce fearfulness in pigs by genetic selection against fearfulness (Forkman et al., 2007), which can be bene-ficial for the meat quality as well as at handling of the pigs (D’Eath et al., 2010; Beattie et al., 2000; Geverink, 1998).
2.2 Stress
Stress is an important reaction of the body, which helps animals to survive against predators or other threats (Grandin, 1997). When an animal is confronted with ho-meostatic challenges, the stress response activates and start physiological and be-havioural changes to the body which increase the likelihood of survival (Charmandari et al., 2005). Homeostasis is the ongoing process to maintain the physiological processes in the body to an optimal level that is necessary for survival (Cannon, 1929). The definition of stress that will be used in this study will be cited from Terlouw (2005), “the physiological, behavioural and psychological state of the animal when confronted with, from the animal´s point of view, a potentially threat-ening situation” (Terlouw, 2005).
Two systems will be activated from the hypothalamus in a stressful situation; the adrenal-cortical system and the sympathetic nervous system. The adrenal-cortical system will be activated from the hypothalamus by releasing corticotropin-releasing hormones to the pituitary gland. This will result in the formation of adrenocortico-tropic hormone which is secreted from the pituitary gland who travels with the bloodstream to the adrenal cortex. Approximately 30 different hormones will be activated and released from this activity which prepare the body for the potential threat. At the same time, the sympathetic nervous system will command the adrenal medulla to release the hormones norepinephrine and epinephrine to the bloodstream, which result in an increase blood pressure and heart rate. The glands and smooth muscles will also be activated from impulses that is send out from the sympathetic nervous system, which also prepare the body for potential threats. The physiological changes that occur in the body during stress is an increased respiratory rate, inter-mediate metabolism and cardiovascular tone. It may also result in an inhibition of vegetative functions such as growth, immunity, feeding, digestion and reproduction (Sapolsky et al., 2000). The behavioural changes may also result in an inhibition of
vegetative functions such as feeding, reproduction and appetite when experiencing stress but it may also enhance analgesia, euphoria and awareness (Charmandari et
al., 2005). During a stressful situation, an immediate increase of blood lactate will
occur. The lactate concentration varies between 0 to 11 mmol/L in pigs and have a mean of 5.2 ± 2.9 mmol/L. Different parameters such as breed, weight and previous stressful experiences might affect the lactate levels in pigs (Hofmaier et al., 2013). Stress is supposed to be short-term, acute state. Long-termed stress, or chronic stress, were the stress reaction is not turned off after a short and acute phase may lead to long term inhibition of vegetative functions which adversely affect the body (Charmandari et al., 2005; Sapolsky et al., 2000). Chronic stress in animals in cap-tivity may therefore result in e.g. a decreases production from the inhibition of growth (Sapolsky et al., 2000), feeding and reproduction (Charmandari et al., 2005; Sapolsky et al., 2000).
Stress in animals can occur both from environmental (Sutherland et al., 2006; Geverink et al., 2002; Hicks et al., 1998; Talling et al., 1996; Kelley, 1980) and social factors (Campbell et al., 2013; D’Eath et al., 2010; Sutherland et al., 2006; Kelley, 1980). The stress levels of the animals and how they react to stressors de-pends on the situation and their evaluation of the situation. The genetic composition of the individual as well as previous experiences has resulted to each individual being unique and experience stress in different ways (Terlouw, 2005). A restricted environment that prevent piglets from performing highly motivated social behav-iours, such as play behavbehav-iours, may result in aggressive behaviours as well as more sensitive to stressful situations as adult (De Jonge et al., 1996). Human interaction can influence the stress levels of the pigs when handling (Hemsworth et al., 2002). Repeated negative handling of the pigs, such as slapping, can result in less willing-ness to approach humans (Gonyou et al., 1986; Hemsworth et al., 1986). Repeated positive handling, such as petting, can result in a more frequent approach by the pigs (Tanida et al., 1994; Hemsworth & Barnett, 1992; Gonyou et al., 1986).
2.3 Meat quality
Meat quality can be characteristics into three groups; i) eating quality attributes such as taste, flavour, juiciness and tenderness, ii) nutritional quality such as proportions of protein, carbohydrates, fat, fatty acid composition, energy, and vitamins as well as iii) technological attributes such as colour, pH, water-holding capacity and intra-muscular fat (Ewing, 2011; Andersen et al., 2005). Production methods in the pri-mary production where the animals were reared may also be considered as quality of the meat, such as ethical, animal welfare, environmental, slaughter method and storage of the meat (Andersen et al., 2005). The definition of quality is wide since
different consumers have different ethical values, taste, experiences and knowledge (Becker, 2000). Because of this, giving a definition of what quality implies is almost impossible. The definition of meat quality that will be used in this study is cited from Hoffmann (1990) as the “sum of all quality factors of meat in terms of the sensoric, nutritive, hygienic and toxicological and technological properties” (Hoffmann, 1990).
Glycolysis is an important metabolic pathway that, amongst others, generates energy as adenosine triphosphate (ATP) in the muscle tissue, thus this pathway is important in the process of conversion of muscle to meat. Post-mortem muscle tis-sue tries to produce ATP concentration to sustain homeostasis. However, there is not enough oxygen in the post-mortem muscles to sustain oxidative, or aerobic, me-tabolism due to lack of circulating blood due to exsanguination, or means bleeding the animal at slaughter. When the oxygen present in the muscle at slaughter has been consumed, the muscle glycogen will be metabolized through anaerobic glycolysis. The ATP generation is thereby less efficient which result in a decline of ATP and glycogen in the muscle over time. This will result in an increased production and accumulation of lactic acid (Bowker et al., 2000; Kastenschmidt et al., 1968) result-ing in an acidification in the muscle (Terlouw, 2005), and thus reduced pH (Bowker
et al., 2000; Kastenschmidt et al., 1968). The amount of lactic acid will continue to
increase until the enzymes involved in the glycolysis have stopped due to low pH and low temperature and thus the “ultimate pH” (pHu) is reached, which happens
when the pH in the muscle have fully declined (Geverink, 1998). The pH in the longissimus muscle will decline from approximately 7.4 in the living tissue to 5.6 within 24 hours after slaughter and the temperature will decline from approximately 39°C to 5°C (Briskey & Wismer‐Pedersen, 1961). This meat, which is of normal quality, will have a grey/pink colour, be moderate dry and firm and therefore it will be suitable as processed and/or fresh meat products (Briskey, 1964). The ATPase-activity affect the rate of the pH reduction (Terlouw, 2005), which affect the tech-nical and sensory meat quality. Pale, soft and exudative meat (PSE) has a fast pH reduction early after stunning (45 to 60 minutes) while the body temperature still is high that results in protein denaturation (Briskey, 1964). This meat has a low water-holding capacity and pale in colour and therefore minimal opportunities for further processing (Scheffler & Gerrard, 2007). Dark, firm and dry meat (DFD) occur when there is lack of muscle glycogen, due to long term stress and fasting. (Kastenschmidt
et al., 1964). DFD meat has a high water-binding capacity compared to “normal”
meat, which gives it a sticky texture. It is also unattractive to the consumers due to its texture and dark colour (Scheffler & Gerrard, 2007). DFD meat has a pHu of 6.0
2.4 Pig breeding
Concerted pig breeding in Sweden started in approximately 1920 with a little re-cording scheme, progeny testing stations and a national herdbook. All of the pigs were of purebred of either Swedish Yorkshire or Swedish Landrace, since it was not acceptable for crossbreeding. Approximately 50 nucleus herds existed in Sweden for Swedish Yorkshire as well as 110 for Swedish Landrace. In the middle of 20th century, crossbreeding started to be more acceptable and computerized breeding programs was introduced. The introduction of artificial insemination as well as Du-roc and Hampshire as sire breeds was introduced in Sweden in the late 20th century. The private slaughter plants and the farmers’ cooperative slaughter plants took over the pig breeding in Sweden since the subvention for the costs of the national pig breeding came to an end and the government could not afford to continue. The pri-vate group started to use Norwegian genes of Yorkshire, Landrace and Duroc from Norsvin while the cooperative group, now called Nordic Genetics, continued with Swedish breeds of Yorkshire, Landrace and Hampshire. In 2005, Norsvin and Nor-dic Genetics created a cooperation together on Yorkshire and Landrace, which re-sulted into the Swedish Landrace to disappear. In 2012, the cooperation of Sweden and Norway ceased and instead a cooperation between Norsvin and the Dutch Topigs started. Thereby, Swedish pig producers began to buy Yorkshire and Land-race genetic materials from this cooperation and thus only breeding of Hampshire exist in Sweden with the cooperation with JSR Genetics located in the United King-dom. Using Dutch Yorkshire of the Z-line instead of Swedish Yorkshire in the breeding resulted in a larger litter size with 14.0 liveborn piglets in 2016 compared to 13.2 in 2012. However, the number of functioning teats is still the same, which may become a problem since the litter size increase (Lundeheim, 2017). Yorkshire has a good litter performance and maternal qualities, which makes is usually used as a dam line in a two- or three breeding programs (Eskildsen & Vest-Weber, 2016). The breed is also durable and has a low backfat content and a high lean meat per-centage (Nationalswine, 2018). The objective Topigs Norsvin strive for in its breed-ing program are high producbreed-ing sows, high feed efficiency, robustness, efficient, easy to handle, healthy pigs, maternal qualities, piglet survival as well as finishing pigs with a high growth rate and a high meat yield. Another objective is for product qualities such as low slaughter losses and to meet the consumers demands for the meat colour, intramuscular fat and water-holding capacity (TopigsNorsvin, 2017).
3.1 Animals
The animals that were included in this study were of Swedish Yorkshire (SY) and Dutch Yorkshire of the Z-line (ZY). The SY pigs were purebred but the ZY pigs were 75% ZY and 25% SY. All pigs in this study were included in a larger study aiming to investigate of social behaviours in group housing of sows. In that study, the piglets were divided into two groups given different social treatments during the suckling period, access pen (AP) and control pen (CP). AP consisted of half of the litters of the SY and the ZY, where the piglets had the opportunity to walk between two pens, from their home pen to the litter in the neighbouring pen of the same breed through a small pop hole (height of 35cm and 30cm in width) in the piglet corner in the pen (Figure 1). The piglets in AP had the opportunity to walk between the pens from two to five weeks of age. The piglets in CP did not have the opportunity to walk between pens. In both treatments, piglets and sows were housed in conven-tional loose housed farrowing pens from birth to weaning (Figure 1). Their behav-iours were later recorded by different behaviour recordings and behaviour tests. Be-cause of this, all of the pigs had from an early age been handled more than what is common in commercial production.
Figure 1. An illustration of two conventional loose housed farrowing pens in the pig facility measured in millimetre. The piglets had the opportunity to walk between the pens through a pop hole, which was located in the piglet corners between the pens.
In total, 60 pigs were included in this study where 20 of them were of SY and 40 were of ZY breed and 8 of the SY piglets had been in AP as well as 26 of the ZY pigs. Both SY and ZY pigs came from four different litters each, with two litters per sire boar, from a total of two batches. The number of pigs per breed, treatment group and sexes were not even in this study as four gilts per litter were taken out for further studies in the larger study (Table 1). The pigs were in this study observed from two weeks prior to slaughter until one day after slaughter. The routine data from birth to slaughter of the pigs from the pig facility and the slaughter plant was collected.
Table 1. Number of pigs included in the study of the breeds Swedish Yorkshire (SY) and Dutch
York-shire (ZY) in the treatment groups, access pen (AP) and control pen (CP), as well as the sexes and the age at slaughter. Breeds in treatment Pigs in treatment (number) Castrated boars (number) Gilts (number) Age of castrated boars (days) Age of gilts (days) SY AP SY CP ZY AP ZY CP 8 12 26 14 8 9 15 6 0 3 11 8 155.0 ± 8.55 155.4 ± 5.81 157.1 ± 4.50 156.8 ± 5.53 *1 161.3 ± 2.31 161.9 ± 6.09 158.8 ± 7.21 Total 60 38 22 156.2 ± 5.81 160.7 ± 6.14
3.2 Housing and management
This study was performed at two different facilities, the pig facility at the Swedish Livestock Research Centre where the pigs were raised and at the slaughter plant at Lövsta Kött AB. The pig facility has a farrow-to-finish production with approxi-mately 110 sows in production. The slaughter plant slaughter pigs, cattle and sheep. Stunning is performed with carbon dioxide or with a bolt pistol and thereafter ex-sanguination and slaughter.
3.2.1 The Swedish Livestock Research Centre
The Swedish Livestock Research Centre has a batch-wise production system where approximately 10 gilts and/or sows farrow every second week. After farrowing, the piglets’ weight and sex was recorded and they got a tattoo in their right ear. At five days of age, the piglets got an iron injection in the upper neck as well as an ear tag in their left ear. At two weeks of age, they got their second iron injection and was manually given supplement feeding in a feed machine, adapted to the litter size. At five weeks of age, their weight was noted and thereafter they were weaned as the sow was moved out of the pen to the gestation stable. The piglets were remained in the same farrowing pen until approximately nine weeks of age, when they were moved to a growing finishing stable. In the growing finishing stable, the pigs got dry feed three times a day automatically. There are, in total, seven growing finishing stables in the pig facility and in each stable, there are 12 pens with a capacity to hold 10 pigs in each as well as two smaller treatment pens (Figure 2). The staff aims to keep the litters intact also after moving to the new stable, but there was not always possible due to it must not exceed ten pigs in each pen. This was done to reduce aggressive behaviours between unknown litters which can result in injuries. One and two months after moving to the fattening stable, the males were immunocas-trated with Improvac® to reduce aggressive behaviours as well as boar taint. At five to six months of age, the slaughter animals’ weight was noted to determine when they were ready for slaughter. When their live weight was approximately 115 kg, they were sent to slaughter. Every day, the staff monitors all pigs in the facility and examines their health and treats those who are injured or sick if necessary (SLU, 2017).
3.2.2 Lövsta Kött AB
When boarding of the vehicle to the slaughter plant, animals from different pens were mixed regardless of breed and sex. The distance between the pig facility and the slaughter plant is 2.2 kilometre and the transport take four minutes. At arrival to
the slaughter plant, the animals were kept in resting pens for approximately one hour. The animals were thereafter moved by the staff through a short walkway to the anesthesia. The animals were stunned in a Butina CO2 stunner two or three pigs
at the same time, which took approximately three minutes, and then they were ex-sanguinated. The pig order of the exsanguination and the pig number was noted to be able to follow each pig to and in the chilling room, where they were stored. After the exsanguination, the carcass went through scalding and singeing with a gas burner to sterilize and burn off hair. The carcass was hanged upside-down in rear legs on a railing after the scalding and singeing to be able to transport it easily in the facility. The organs and intestine were removed and then the carcass was cut into two halves from rear to head. Thereafter the carcass and the organs were examined by a veterinarian for possible flaws and diseases. The meat percentage and the slaughter weight of the carcass was recorded by the staff and then the carcass was brought to the chilling room for storage for approximately 17 to 20 hours. The tem-perature of the chilling room was between 8 to 10°C for the first two hours and then constantly decrease to a final temperature of between 2 to 3°C. The process time from exsanguination to storage in the chilling room took approximately 30 minutes.
3.3 Behaviour tests
Two behavioural tests were performed in this study, the Novel Arena test (NAT) and the Startle test (ST), to investigate their stress level and response to novelty. NAT and ST were performed in the pig facility and NAT was also performed at the slaughter plant. The tests were set up so that one technician could perform the tests alone. However, the tests in the pig facility were performed by two individuals, the technician, that did the actual recording, and assistant 1, that assisted moving the pigs as well as registered the time during the tests. NAT at the slaughter plant was performed by another assistant, assistant 2. The technician and assistant 2 had prac-ticed together to assess the behaviours of the pigs in the same way. Both examined the same pig at the same time in the pig facility and then compared the results with each other in order to learn to assess in the same way. This was done on multiple pigs to ensure that the behaviours were assessed in the same way. The pigs that were used in the training of the assessment were not included in the analyses in this study.
3.3.1 Test Arena
The testing arena of NAT in the pig facility was located in the walkway next to the home pen of the pigs in the stable (Figure 2). The walkway was relatively clean and there were no objects that could distract the animals. The testing arena was 80 cm
wide, 720 cm long and the walls were 103 cm high. The testing arena of ST in the pig facility was performed along the front of the stable (Figure 2). The testing arena was relatively clean but there were objects that could distract the animals, i.e. objects on the wall, damp floor, defecation and gaps in the corners. The testing arena was 150 cm wide, 450 cm long and the walls had a minimum height of 86 cm and a maximum height of 108 cm. The entrance, a red closed door, to the stable were inside of the testing arena of ST as well as the top of a silver metal culvert. A culvert is a tunnel in the ground where urine and manure are transported away automati-cally. The testing arena of NAT in the slaughter plant was performed in the walkway before the anesthesia. The testing arena was relatively clean and there were no ob-jects that could distract the animals. The testing arena was 80 cm wide, 300 cm long and the walls were 114 cm high (Figure 3).
Figure 2. An illustration of the growing finishing stable in the pig facility measured in millimetres. There are in total 12 normal sized pens as well as two treatment pens in the back of the stable. The Novel Arena test (NAT) was located in the walkway but changed position for each pen. The Startle test (ST) was located in the front of the stable. The blue dots represent where the technician stood and registered the behaviours for each test and the red dots represent where assistant 1 stood for each test.
Figure 3. An illustration of the walkway in the slaughter plant before anesthesia in millimetre. There are multiple pens to the left that lead to the walkway. The Novel Arena test (NAT) was located in a curve in the walkway before the waiting area, which was closed off with a barrier. The red dot repre-sents where assistant 2 stood and registered the behaviours of the pigs.
3.3.2 Batches
This study consisted of in total 60 pigs from two batches. The 60 pigs were slaugh-tered at four different times, two slaughter groups per batch, and each group con-sisted of a mixture of the breeds and treatment groups. The slaughter groups were not equally divided for the breeds and for the treatment groups due to they were taken from a larger study. There was no opportunity of choosing when the pigs were sent off to slaughter. Batch 1 consisted of 20 pigs from the beginning of the meas-urements but because of miscommunication it actually consisted of 31 pigs. This was discovered after the first group had been observed and thus a second group were made for the remaining 11 pigs. In Batch 1 Group 1, 20 pigs were tested but only 4 of those pigs went to slaughter in the slaughter group 1, the remaining 16 pigs went to slaughter in the slaughter group 2. In Batch 1 Group 2, 11 pigs were tested but only 3 of those pigs went to slaughter in the slaughter group 1, the remaining 8 pigs went to slaughter in the slaughter group 2. The day the pigs were sent to slaughter was due to their live weight and could not be changed for this study. In Batch 2 Group 1, 14 pigs were tested and all of them went to slaughter in the slaughter group 3. In Batch 2 Group 2, 15 pigs were tested and all of them went to slaughter in the slaughter group 4 (Table 2).
Table 2. Number of pigs from the breeds Swedish Yorkshire (SY) and Dutch Yorkshire (ZY) that were
observed at the pig facility that went to slaughter each week. Group 1 and 2 in batch 1 and 2 describes the pigs who were observed in the pig facility and the slaughter groups describes the pigs who were observed in the slaughter plant.
Pig facility
Slaughter plant
Batch 1 Batch 2
Total
Group 1 Group 2 Group 1 Group 2
SY ZY SY ZY SY ZY SY ZY Slaughter group 1 Slaughter group 2 Slaughter group 3 Slaughter group 4 2 5 2 11 0 0 3 8 7 7 6 9 7 24 14 15 Total 20 11 14 15 60
3.3.3 Test groups and test days
In the slaughter-pig stable in the pig facility, the pigs were randomly allotted into pairs of two from the same pen regardless of treatment group and sex. The test groups consisted of two pigs per test to resemble the NAT in the slaughter plant. The majority of the pigs in each pen were siblings and thus they were of the same breed, ZY or SY. In total, 33 test groups were created from the 60 pigs that were included in the study. Not all pigs in each pen were involved in the measurements, which resulted in an uneven number of pigs involved in the experiment in 6 pens. In these pens, one test group were created that consisted of one pig that were in-volved in the experiment and one that was not. The pigs that were not inin-volved in the experiment were not analysed but was used as a filler so that there were two pigs in each test group. At the slaughter plant, the pigs were randomly grouped in pairs of two or three pigs from different pens regardless of breed, treatment group, sex or whether they were involved in the experiment or not. In total, 42 test groups were created from the 60 pigs that were included in this study. In the end, only batch 2 were analysed due to incorrect values on batch 1 and thus 29 pigs were analysed in 19 test groups. The pigs that were not involved in the study were not analysed.
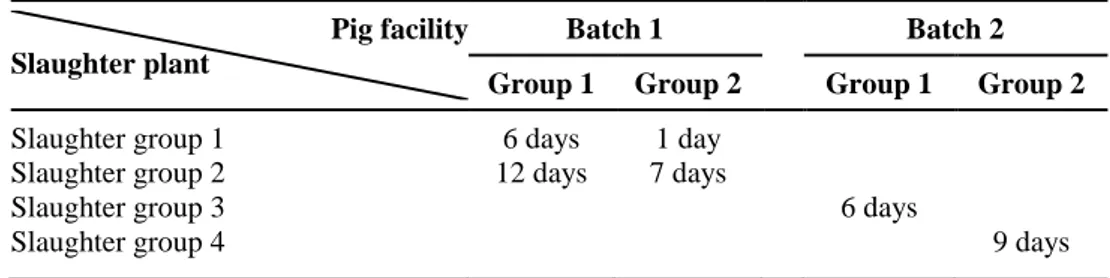
NAT and ST in the pig facility were performed on the same pig during the same day for each slaughter group. Each group was slaughtered during different weeks. A few days after each slaughter groups had been observed in the pig facility, the pigs were sent to the slaughter plant (Table 3).
Table 3. Numbers of days between the observations in the pig facility and the observations in the
slaughter plant.
Pig facility Slaughter plant
Batch 1 Batch 2
Group 1 Group 2 Group 1 Group 2
Slaughter group 1 Slaughter group 2 Slaughter group 3 Slaughter group 4 6 days 12 days 1 day 7 days 6 days 9 days
3.3.4 Novel Arena test (NAT) – The Swedish Livestock Research Centre NAT is designed to analyse animals’ reactions to an unfamiliar environment (Le Neindre, 1989) and at the same time gives them the opportunity to perform self-chosen behaviours by allowing the animals to move freely in a new environment such as a walkway (Taylor & Friend, 1986). This test is often performed on pigs to measure “reactivity”, which is defined as the amount of activities that are performed in the arena (Fraser, 1974). NAT is a test that indirect measure levels of stress and fear in animals. This test could be a good measurement for some behaviours but it should not be the main test to evaluate fearfulness. The behaviours could be influ-enced by social motivations in animals reared in a group system and therefore the test have a relatively low validity (Forkman et al., 2007).
NAT in the pig facility was the first test that where performed. The pigs in each test group were first isolated in a part of the home pen of the pigs next to the exit. The door to the walkway was opened manually within one minute after the test group had been separated from the other pigs by assistant 1, who stood inside of the pen (Figure 2). No specific behaviours of the pigs were required before NAT began, except they should be facing the exit. Assistant 1 registered the latency for the pigs to walk out of the pen to the walkway from that the door was opened until their four legs were outside of the pen. The pigs were left to walk out of the pen voluntarily without assistant 1 forcing them to walk out, and when one of the pigs had its four legs outside of the home pen, NAT started for that individual. Assistant 1 touched the pigs lightly inside of the pen if they were not facing the exit of the pen or if they were aggressive towards assistant 1. The technician, doing the recordings, stood in-side of another pen, at the finish line, with one pen in between (Figure 2) and regis-tered the behaviours (Table 4) of the pigs in the walkway with a recording sheet (Appendix 1). The distance where the experiment took place was 720 cm long, the distance of two pens, and when one of the animals had crossed the finish line, the experiment ended for that individual. All of the pigs were spray-painted with a sym-bol over their hindquarters to be able to distinguish them from each other during the
test. This was done the day before or one hours before the test to reduce stress factors which may occur during the marking. The placement of the marking area was de-termined based on the marking routine of the pig facility in order not to interfere with it.
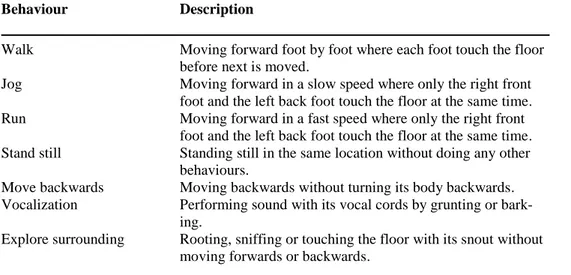
Table 4. Ethogram of the behaviours that were observed in the Novel Arena test (NAT) in the pig
facility. Behaviour Description Walk Jog Run Stand still Move backwards Vocalization Explore surrounding
Moving forward foot by foot where each foot touch the floor before next is moved.
Moving forward in a slow speed where only the right front foot and the left back foot touch the floor at the same time. Moving forward in a fast speed where only the right front foot and the left back foot touch the floor at the same time. Standing still in the same location without doing any other behaviours.
Moving backwards without turning its body backwards. Performing sound with its vocal cords by grunting or bark-ing.
Rooting, sniffing or touching the floor with its snout without moving forwards or backwards.
Data recording
The latency to walk out of the home pen, the test groups, the behaviours (Table 4) as well as the order of the behaviours for each pig were transferred to an Excel file by the technician. The behaviours were categorised in three groups and was counted of how many times, in total, they performed each of the behaviours individually to be able to calculate the mean and standard deviation in the future. NAT was not a compiling of the test group, it was individually registered for each pig. Activity was counted as walk, jog and run, inactive behaviours was counted as when the pig stood still, moved backwards and vocalize and explore was counted as when the pig ex-plored the surrounding. The latency of how long time it took for the pig to walk out of the pen and the number of activities, inactive behaviours and exploring they did was transferred to Minitab to analyse the mean and standard deviation for the breeds and the treatment groups (Minitab Statistical Software, version 18, 2018).
3.3.5 Startle test (ST) – The Swedish Livestock Research Centre
ST is normally performed in the home pen or in a novel arena and then a novel object will be introduced into the arena by dropping or throwing it into the arena (Forkman et al., 2007). Pigs have developed a defence mechanism to novelty and sound to protect themselves against potential threats (Talling et al., 1996; Boissy,
1995). This defence mechanism may change the activity of the pig and result in escape behaviours (Talling et al., 1996). This test is therefore a way to investigate their direct stress and fear responses towards a sudden change in the environment (Boissy, 1995). Novelty is a technique to provoke negative emotions, such as fear, of the animal. However, repeated exposure to a novelty may reduce these negative emotions, due to the recognition that the object is not associated with danger (Boissy, 1995). The latency to approach different objects may differ since Spoolder
et al. (1996) observed that it was a lower latency until the pigs approach a human
compared to a bucket (Spoolder et al., 1996). This may depend on how often they have come in contact with the object previously and due to general previous expe-riences (Rushen et al., 1999).
After NAT had been performed, both of the pigs were moved through the walk-way to the testing arena where ST was performed. The pigs in each test group was given a minimum time of three minutes to get accustomed to the testing arena. When the pigs had performed “normal behaviours”, i.e. rooting the interior, on two differ-ent occasions at the same area they were perceived to be accustomed to the testing arena. When they were accustomed to the arena and stood on the opposite side of the technician, the test began. Some pigs were perceived to be accustomed to the testing arena before three minutes had past but they had to wait until three minutes had passed before the test began. There were also a few pigs that were not perceived to be accustomed to the testing arena after three minutes and for these, the test started a little bit later when they were perceived to be accustomed. Assistant 1 stood inside of the pen next to the testing arena with a disk to prevent interaction between the pigs in the pen and the test animals and the technician stood outside of the testing arena at the short side in the corner of the stable (Figure 2). The test began by throw-ing a red plastic bucket on the metal floor on top of the culvert in the testthrow-ing arena. The test lasted for three minutes and then stopped by removing the bucket. The la-tency and the order the pigs touched the bucket with its snout was registered during the test with a recording sheet (Appendix 2). The behaviours (Table 5) during the test of the animals were video recorded to be able to analyse them in the future and was later registered in a recording sheet (Appendix 3). The camera was a Garmin Virb Ultra 30 and was placed elevated in an angle in the corner of the testing area in a way to include the total arena. The camera was started manually a few seconds before the bucket hit the ground for every test group and was turned off manually after the test ended.
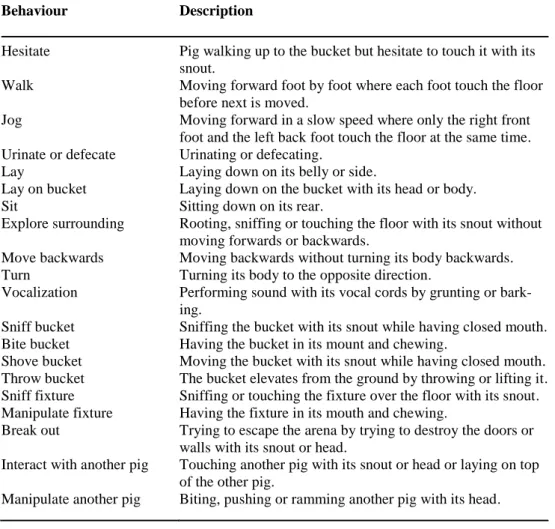
Table 5. Ethogram of the behaviours that were observed in the Startle test (ST) in the pig facility. Behaviour Description Hesitate Walk Jog Urinate or defecate Lay Lay on bucket Sit Explore surrounding Move backwards Turn Vocalization Sniff bucket Bite bucket Shove bucket Throw bucket Sniff fixture Manipulate fixture Break out
Interact with another pig
Manipulate another pig
Pig walking up to the bucket but hesitate to touch it with its snout.
Moving forward foot by foot where each foot touch the floor before next is moved.
Moving forward in a slow speed where only the right front foot and the left back foot touch the floor at the same time. Urinating or defecating.
Laying down on its belly or side.
Laying down on the bucket with its head or body. Sitting down on its rear.
Rooting, sniffing or touching the floor with its snout without moving forwards or backwards.
Moving backwards without turning its body backwards. Turning its body to the opposite direction.
Performing sound with its vocal cords by grunting or bark-ing.
Sniffing the bucket with its snout while having closed mouth. Having the bucket in its mount and chewing.
Moving the bucket with its snout while having closed mouth. The bucket elevates from the ground by throwing or lifting it. Sniffing or touching the fixture over the floor with its snout. Having the fixture in its mouth and chewing.
Trying to escape the arena by trying to destroy the doors or walls with its snout or head.
Touching another pig with its snout or head or laying on top of the other pig.
Biting, pushing or ramming another pig with its head.
Data recording
The technician went through the video recordings and registered how many of each behaviour (Table 5) each pig was performing each minute for three minutes with a recording sheet (Appendix 3). The pigs could perform one behaviour for a long pe-riod of time without changing behaviour and it was counted as one. The behaviours were registered every time they started a new behaviour. The behaviours were not a compiling of the test groups, it was individually registered for each pig. The activity of the pigs was registered with a square system, where the test arena was divided into six squares (Figure 4). The behaviours and the activity were then transferred to an Excel file. The behaviours were categorised and was counted of how many times they performed each of them during each minute for three minutes to be able to calculate the mean and standard deviation for the breeds and for the treatment groups in the future. Hesitation was counted how many times the pig hesitated to
approach the bucket. Activity was counted as how many times the pigs changed square by walking or jogging. Inactive behaviours were counted as when the pig was urinating or defecating, laying, laying on top of the bucket, sitting, exploring the surrounding, moving backwards, turning and vocalizing. Handle bucket was counted when the pig was sniffing, biting, shoving or throwing the bucket and han-dle fixture was counted when the pig was sniffing or manipulating the fixtures on the walls. Escape was counted when the pigs tried to break out. Interact with another pig was counted as when the pig was interacting or manipulating another pig. The proportion of reactivity of the pigs towards the bucket when it was introduced to the test arena was measured as yes or no, where “yes” was calculated as 1 and “no” was 0. Hesitation, escape and interact with another pig were later changed to yes or no, where “yes” was calculated as 1 and “no” was calculated as 0, to be able to measure the proportion of the pigs performing the behaviours. The latency to approach the bucket was measured in seconds and stopped when the pig touched the bucket with its snout. The latency, reaction, hesitation, escape and interact with another pig as well as the number of activities, inactive behaviours, handle bucket and handle fix-ture were transferred to Minitab to analyse the mean and standard deviation for the breeds and for the treatment groups (Minitab Statistical Software, version 18, 2018). The latency, reaction, hesitation, escape and interact with another pig was calculated for the first minute for the descriptive analyses due to they are associated with nov-elty and thus interesting during the first minute. The number of activities, inactive behaviours, handle bucket and handle fixture were calculated for the first and the third minute in the descriptive analyses due to they are interesting to observe how they change during the test. The latency, reaction, hesitation, escape and interact with another pig as well as the number of activities, inactive behaviours, handle bucket and handle fixture were calculated for the first minute in the statistical anal-yses. This was done since the stress levels is the most interesting to investigated and the pigs showed higher stress levels during the first minute, because of the novelty.
Figure 4. An illustration of the test arena of the Startle test (ST) in the pig facility on the square system to register the activity of the pigs.
3.3.6 Novel Arena test (NAT) – Lövsta Kött AB
NAT in the slaughter plant occurred a few days after NAT and ST in the pig facility had been made (Table 3). At arrival to the slaughter plant, the pigs were mixed in resting pens where they were for approximately one hour before the test began. The pigs were not given time to get accustomed to the new area and comrades and no specific behaviours were required before the test began. The reason for this was because the slaughter plant had a schedule to follow and thus did not have time for the pigs to perform specific behaviours. The pigs were moved from the resting pens through the walkway by the slaughter plant staff in a random group of two or three at the time regardless of breed, treatment group, sex or whether they were involved in the experiment or not. There were several pigs from the pig facility slaughtered at the same time together with the test animals who were not involved in this study and these pigs were not analysed. The behaviours (Table 6) of the pigs who were involved in the experiment were registered by assistant 2 with a recording sheet (Appendix 4). The assistant doing the behavioural registration stood outside of the walkway on the long side and registered their behaviours at a length of 300 cm (Figure 3). When the animals had crossed the end of the test arena, the experiment ended and the animals were taken to go through anesthesia. All of the pigs were spray-painted with a symbol over their back to be able to distinguish them from each other during the test. This was done the day before they were sent to the slaughter plant by the staff of the pig facility to reduce stress factors which may occur during the marking.
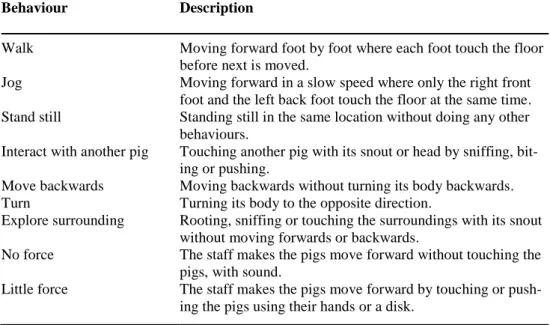
Table 6. Ethogram of the behaviours that were observed in the Novel Arena test (NAT) in the slaughter
plant.
Behaviour Description
Walk
Jog
Stand still
Interact with another pig
Move backwards Turn
Explore surrounding
No force
Little force
Moving forward foot by foot where each foot touch the floor before next is moved.
Moving forward in a slow speed where only the right front foot and the left back foot touch the floor at the same time. Standing still in the same location without doing any other behaviours.
Touching another pig with its snout or head by sniffing, bit-ing or pushbit-ing.
Moving backwards without turning its body backwards. Turning its body to the opposite direction.
Rooting, sniffing or touching the surroundings with its snout without moving forwards or backwards.
The staff makes the pigs move forward without touching the pigs, with sound.
The staff makes the pigs move forward by touching or push-ing the pigs uspush-ing their hands or a disk.
Data recording
The test groups and the behaviours (Table 6) of the pigs as well as the order of the behaviours were transferred to an Excel file by the technician. The behaviours were categorised and was counted of how many times they performed each of the behav-iours, in total, individually to be able to calculate the mean and standard deviation in the future. NAT was not a compiling of the test group, it was individually regis-tered for each pig. Activity was counted as walk and jog, inactive behaviours was counted as when the pig stood still, interacted with another pig, moved backwards and turned and explore was counted when the pig explored the surrounding. Hesitate was counted when the pigs hesitated to walk forward and the staff had to use differ-ent methods to make them walk forward by no force or little force. The number of activities, inactive behaviours, exploring and hesitation they did was transferred to Minitab to analyse the mean and standard deviation for the breeds and for the treat-ment groups (Minitab Statistical Software, version 18, 2018).
3.4 Blood sample
The lactate levels of the pigs were measured in the blood at exsanguination after NAT in the slaughter plant. The lactate levels were measured by a third assistant, assistant 3, by using the instrument Lactate Plus Meter. Blood samples was collected with a plastic spoon approximately 15 seconds after exsanguination and then one test strip was inserted to the instrument and thereafter the test strip was dipped into the blood. This was done within seconds after collecting the blood before it coagu-lated. After 13 seconds, the instrument had recorded a value which was written down on a recording sheet (Appendix 5). A new plastic spoon was used to collect the blood from every pig.
3.4.1 Data recording
The lactate value of the pigs was transferred to an Excel file by the technician and thereafter transferred to Minitab to analyse the mean and standard deviation for the breeds and for the treatment groups (Minitab Statistical Software, version 18, 2018).
3.5 Temperature and pH
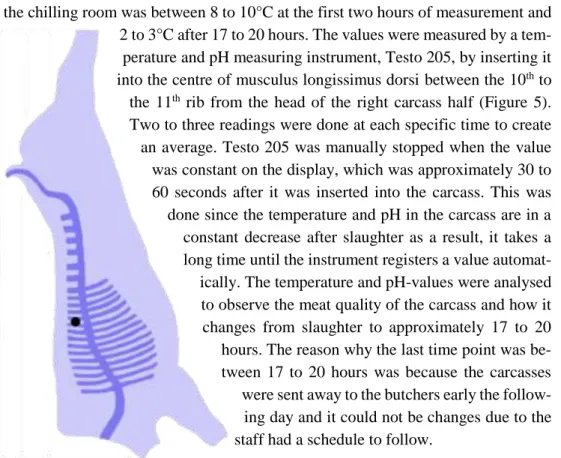
The temperature and pH-values were measured on the carcass inside the chilling room at the slaughter plant starting 45 minutes after exsanguination. Each pig was measured at five different times points; 45, 60, 90, 120 minutes and then approxi-mately 17 to 20 hours after exsanguination (Appendix 6). The temperature inside
the chilling room was between 8 to 10°C at the first two hours of measurement and 2 to 3°C after 17 to 20 hours. The values were measured by a
tem-perature and pH measuring instrument, Testo 205, by inserting it into the centre of musculus longissimus dorsi between the 10th to
the 11th rib from the head of the right carcass half (Figure 5).
Two to three readings were done at each specific time to create an average. Testo 205 was manually stopped when the value was constant on the display, which was approximately 30 to 60 seconds after it was inserted into the carcass. This was done since the temperature and pH in the carcass are in a constant decrease after slaughter as a result, it takes a long time until the instrument registers a value
automat-ically. The temperature and pH-values were analysed to observe the meat quality of the carcass and how it changes from slaughter to approximately 17 to 20 hours. The reason why the last time point was be-tween 17 to 20 hours was because the carcasses
were sent away to the butchers early the follow-ing day and it could not be changes due to the staff had a schedule to follow.
Figure 5. An illustration of the outline of the carcass and ribs upside-down. The black dot represents where Testo 205 was inserted to measure the temperature and pH-values.
3.5.1 Data recording
The temperature and pH-values of the pigs were transferred to an Excel file by the technician and thereafter transferred to Minitab to analyse the mean and standard deviation for the breeds and for the treatment groups (Minitab Statistical Software, version 18, 2018).
3.6 Statistical analyses
3.6.1 Data editing
NAT and ST were performed in the pig facility and NAT was also performed again at the slaughter plant. Moreover, slaughter records as well as carcass temperature and pH were collected at the slaughter plant. In addition to this, data from the routine
data collection in the pig facility from birth to slaughter (e.g. growth and health records) were included in the study. All of the data were transferred and stored in a merged Excel file. Data from all four slaughter groups were used in the analyses of NAT in the pig facility, but only data for slaughter group 3 and 4 were used in the calculation of the latency to walk out of the pen. This was done since the realisation that the latency to walk out of the pen would be good to analyse arose after batch 1 had been observed. All of the four slaughter groups were used in the analyses of ST in the pig facility. The slaughter groups 1, 2 and 4 were used in the analyses of NAT in the slaughter plant. Slaughter groups 3 was not measured due to limitations in assistants that specific day. Slaughter group 3 and 4 were used in the analyses of lactate levels at exsanguination. The lactate levels in batch 1 were not measured since the realisation that it would be good to measure it arose after batch 1 had been slaughtered. Slaughter group 3 and 4 were used in the analyses of the temperature and the pH-value. Slaughter group 1 was not used in the analyses due to instrument failure. The data on the temperature and pH-values from slaughter group 2 was not used in the analyses since the instrument was incorrectly calibrated and thus dis-played incorrectly values.
3.6.2 Descriptive analyses
The merging and storage of the data was made in Microsoft Office Excel 2016 and the data was transferred to Minitab Statistical Software version 18 (2018) where the statistical analyses were performed (Minitab Statistical Software, version 18, 2018). Histograms were made to analyse if the variables were normally distributed, which they were. Mean and standard deviations of each variable was calculated by using the descriptive statistics function in Minitab and then interval plots were constructed for the temperature and pH-values to assess the mean and standard deviations in a graph.
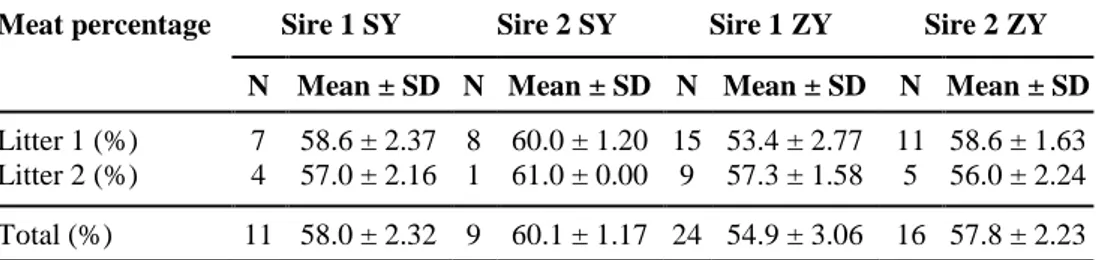
The mean and standard deviation of the meat percentage were also calculated for the litters from each sire boar (Table 7).
Table 7. The mean and standard deviation of the meat percentage from the pigs in the respective litter
from the sire boar.
Meat percentage Sire 1 SY Sire 2 SY Sire 1 ZY Sire 2 ZY
N Mean ± SD N Mean ± SD N Mean ± SD N Mean ± SD
Litter 1 (%) Litter 2 (%) 7 4 58.6 ± 2.37 57.0 ± 2.16 8 1 60.0 ± 1.20 61.0 ± 0.00 15 9 53.4 ± 2.77 57.3 ± 1.58 11 5 58.6 ± 1.63 56.0 ± 2.24 Total (%) 11 58.0 ± 2.32 9 60.1 ± 1.17 24 54.9 ± 3.06 16 57.8 ± 2.23
3.6.3 Statistical analyses and models
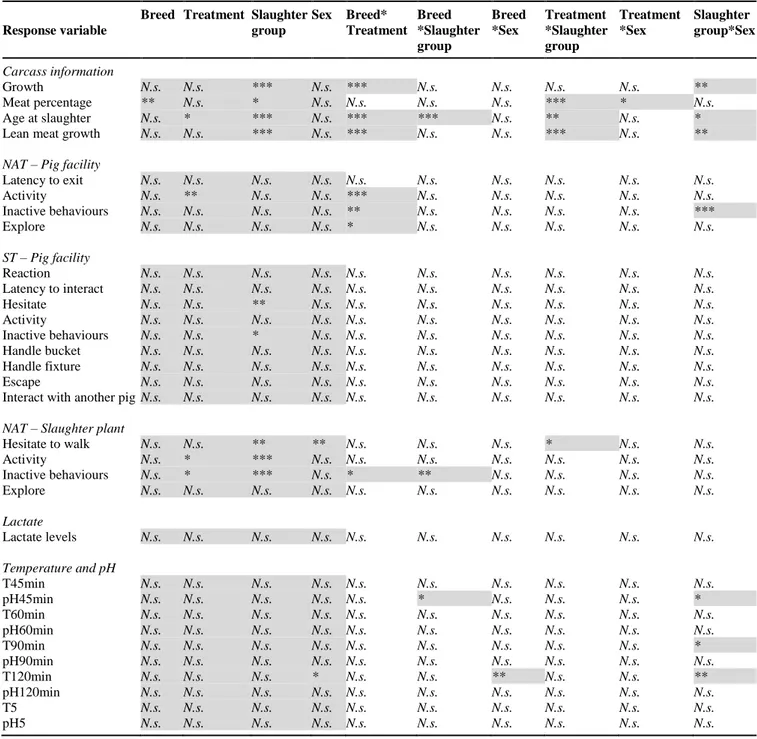
The development of statistical models for analyses was made in Minitab by calcu-lating the significance of each predicting factors, as well as the interactions between the predicting factors for each response variable by using the function general linear model in Minitab (Minitab Statistical Software, version 18, 2018). The main factors were breed (SY; ZY), treatment group (AP; CP), slaughter group (1; 2; 3; 4) and sex (gilt; immunocastrated boar) and were included in the final model regardless of sig-nificant levels, as they were theoretically considered to be of importance for the response variables. Thereafter, the interactions between the factors were investi-gated individually for each response variable and included in the final model if sig-nificant (P<0.05). The levels of significance are presented in table 8 as:
* = P<0.05 ** = P<0.01 *** = P<0.001
The final models were then used to analyse differences for the breeds and for the treatment groups for the response variables. Pairwise comparison was performed with Tukey adjustment for all factors, to correct for uneven numbers of observations in groups.