Stress Management for Pilots
Mälardalens University
The Academy of Innovation Design and Technology Emil Kangas Persson
Bachelor Thesis in Aeronautical Engineering Date: 15/5 2017
Examiner: Håkan Forsberg
Abstract
A human brain is capable to achieve great things, to endure heavy stress and to calculate complex problems. What happens when it fails to do so? Is there anything that could be done to prevent this from happening? Is it possible to help a pilot in command manage his or her stress during flight by measuring finger temperature, skin conductance, ECG and heart rate variations?
This thesis study processes that can help pilots manage high stress with simple tools such as closing their eyes and taking a few deep breaths. To determine when the calming measures are needed and to evaluate potential effects, all the signal data stated above are used combined with scoring of every participant performance. The statistical methods used involves an ANOVA-test and mean value calculations. The results were also analyzed using CBR to get a better understanding of the results and to not only rely on statistical methods. The thesis is limited to a minor study of 10 student pilots participating in two sessions with a heavy workload departure in a simulator.
The test did result in a small difference between the two sessions which pointed at the calming measures giving a slight improvement for the pilots. However, when ANOVA was applied it showed that the difference between the two sessions was not a significant one. This could be due to several reasons; the pilots were not used to the calming measures and because of this felt more stressed when trying to use the calming measures as well. There might have been a difference if calming measures were included into pilot training already from the beginning. Another reason might be because this is only a minor study and the difference was not apparent on so few participants. In future research, however, there might be a breakthrough on how to handle stress in a cockpit environment involving similar sensors.
Acknowledgments
I would like to thank…
Shaibal Barua for his patience and his time while guiding me through this thesis and helping me when I had bogged down.
Teemu Määttänen for his time with planning the scenarios for the simulation and for consulting about the thesis.
Niklas Algotsson for gathering all the participants and therefore making the experiment possible.
Mirko Senkovski for getting me of the ground with this idea. Everyone who volunteered for the experiment.
Göran Kecklund for helping me to understand a little part of the psychology behind stress and choosing the calming measures.
Abbreviations
ATC Air Traffic Control
Bpm Beats per minute
C Degrees Celsius
CBR Case Based Reasoning
ECG Electrocardiograph
df degrees of freedom
FT Finger Temperature
HR Heart Rate
HRV Heart Rate Variation
IBI Inter-Beat-Interval
LF Low Frequency
MeanNN Mean value of the RR interval
ms Millisecond
MS Mean Squares
RMSSD Root Mean Square of all Successive RR intervals
SAA Scandinavian Aviation Academy
SCL Skin Conductance Level
SD Standard Deviation
SDHR Standard Deviation Heart Rate
SDNN Standard Deviation of RR intervals
SDSD Standard Deviation on the Standard Deviation
Sim Simulation
SS Sum of Squares
Table of Contents
Acknowledgments ... iv Table of tables ... 1 Table of figures ... 1 1. Introduction ... 2 1.1 Problem formulation ... 2 1.2 Limitations ... 2 2. Background ... 3 3. Method ... 4 3.1 Simulation ... 5 3.2 Calming measures ... 6 3.3 Data analysis ... 6 3.4 Case-based reasoning ... 74. Ethical and Societal Considerations ... 7
5. Technical description ... 8
5.1 Simulation ... 8
5.2 Statistical data analysis ... 8
5.3 Case-based classification ... 9
6. Results ... 10
6.1 Statistical methods ... 10
6.2 Case-based reasoning classification ... 13
6.3 Survey results ... 13
6.4 Current aviation safety rules and standards ... 13
7. Discussion ... 14
7.1 Case-based reasoning ... 14
7.2 Aviation safety rules and standards ... 14
7.3 Related research ... 14 8. Conclusion ... 15 8.1 Future research ... 15 References ... 17 Appendixes ... 18 Appendix 1 ... 18 Appendix 2 ... 19 Appendix 3 ... 20 Appendix 4 ... 30 Appendix 5 ... 32 Appendix 6 ... 38
Table of tables
Table 1: Mean values from every participant ... 10
Table 2: The difference between mean values from session 1 and 2 ... 11
Table 3: ANOVA-test with IBI data ... 12
Table 4: ANOVA-test with SCL data ... 12
Table 5: ANOVA-test with FT data ... 12
Table 6: ANOVA-test with HRV data ... 12
Table 7: Results from CBR ... 13
Table of figures
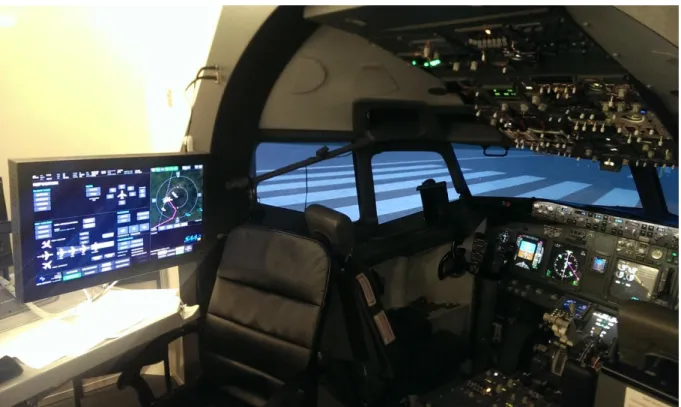
Figure 1: Picture of the simulator where the experiment took place ... 5Figure 2: CBR-cycle illustrated ... 7
1. Introduction
Human pilots could be excellent experts of aviation environments but have inherent limitations on their abilities to operate under conditions of heavy stress. Human error is a major cause of airplane accidents and can stem from conditions of e.g. stress and/or panic. One example of this is the Air France crash in June of 2009 where a panic-situation occurred due to icing of a pitot tube. In this case, one of the pilots stalled the plane because panic inhibited his ability to process all information and see the whole picture. The pilot was in a state of panic and as a result kept holding back on the stick which made it impossible for the other pilots to lower the nose and repel the stall [1]. The aircraft fell out of the sky like a rock and hit the water at several hundred kilometers per hour.
This is just one example out of many where a pilot has made an inadequate decision in operating the plane due to his/her state of panic or stress. In the pursuit of increasing aviation safety, the goal of this thesis will be to investigate the limitations of a pilot
operating in a panic-induced situation and to test a system for diagnosing the human effects of factors such as stress and heavy workload.
How stress affects a pilot and the dangers that follows is also something many researchers have studied. The stress induced by piloting the airplane is not the only stress related problem but also the normal day-to-day, family and life induced stress. This can also affect the pilot’s ability to perform at his best. A report on this subject, on decision making under panic and why it should be avoided, have been submitted by S. R. Murray [2].
1.1 Problem formulation
The problem at its core are the human failures to act in a rational and safe way during situations of high levels of stress and/or panic.
The thesis addresses the following research questions:
From a specific situation to evaluate the effects of a calming measure in a cockpit environment.
Determine such a system’s suitability under the current aviation safety rules and standards.
1.2 Limitations
The limitations of my thesis are to only show the importance of a system measuring pilot stress in a cockpit. My research is conducted with student pilots which may yield different results compared with those of experienced pilots under the same situation. It is also
important to remember that this study is based on a small test group of ten participants and may therefore not show the whole picture. This is not a statistical significant number. It is very hard to simulate real stress from a life and death situation but this will attempt to reconstruct the most accurate situation possible with the help of simulation experts. The study will also only include one scenario as the simulation, one case which also might alter the result.
My study of CS-251 will also only be a minor study to briefly map out what it says about
systems of similar type.
During pre-processing and noise removal of the signals, the heart rate values were found unreasonable and the equipment deemed beyond repair. Because of this these values were omitted from the study.
2. Background
For us to investigate stress in a cockpit environment we first need an understanding of what stress is, how it works and how our bodies react when put under heavy stress.
In modern life, stress is something most people experience on a daily basis. In this context, it is important to remember that stress can also have positive effects, such as making you perform better and handle heavier workloads than you normally would be able to. It might even be problematic to experience too low stress-levels as you would not be as sharp and quick in your mind. Complacency or laziness might then take the upper hand and maybe cause an accident or just not let you achieve what you set out to achieve. On the other hand, when the stress-levels are too high, it might overwhelm the subject and basic human instinct might take over, such as a ‘fight or fly’-effect. This makes us unable to see situations in their entirety and to take informed decisions. Butler and Hope [3] compares stress with a car tire, too much and you will only bounce around, too little and you will feel slow and feel every bump on the road not being able to perform on an optimal level. This thesis will only focus on the first case, when the stress-levels are above what a human brain can handle and still function take the right decision.
For this thesis, already existing techniques to measure and compare levels of stress have been used. Subjects were exposed to the stress pilots experience in the cockpit in a certain situation both with and without calming measures.
Stress affects our ability to make decisions but it also affects our body in other ways. A person put under stress may experience things like increased heart rate, loss in finger temperature, increase in blood pressure, sweating, increased respiratory rate etc. In this thesis ECG (electrocardiograph), FT (finger temperature), HRV (heart rate variability) and SCL (skin conductance) have been chosen to monitor subjects’ stress-levels. This data could then be used to show the importance of a system that uses an artificial intelligence approach to diagnose the human factors in panic situations. The system would then recognize potentially unsafe human conditions of the pilot that could result in dangerous operations. The system would then determine whether the pilot is suitable to control the airplane or not. However, to begin with, only helping the pilot to calm down which might be a more realistic scenario in the future.
A human heart constantly changes the way it pumps blood depending on what is required for different human functions. This can be recorded and later analyzed to receive
information about how this individual experienced a certain situation. One method to do this is ECG. ECG measures electrical impulses from different areas of the heart. By recording these you can infer how the heart functions and evaluate its performance with different workloads [4]. HRV, FT and SCL are the signals this thesis is based upon. With HRV you deduce when the heart and body experience stress under heavier workloads [5]. These results will then be the basis for comparing the two sessions and to evaluate the level of stress the pilots are experiencing.
A human body reacting to stress is prioritizing the most important of its tasks e.g. maintaining internal organs functional. This, in turn, means fingers and other peripheral limbs does not get prioritized with warm and oxygen rich blood. A decrease in finger temperature is imminent.
By measuring the change in finger temperature, evaluation of the stress-level an individual is experiencing is possible. A case based reasoning classification even suggests it can
determine the level of stress a person experiences with 81% accuracy [6].
The aviation industry is governed by a set of rigorous rules and standards to achieve and maintain the highest safety standard. These regulations are developed through a meticulous process of studies and tests of a system during a long period of time. The system in question is then determined by several different agencies whether it achieves the desirable safety standard or not. As such it is important to conduct this study with the specific requirements and potential future compliance of these in mind, while commenting on the outcomes effects on these standards.
A few years ago, at the Paris airshow a company named Rockwell Collins announced a panic button which pilots could press to let the airplanes computers try to save the plane instead [7]. The long-term goal of this thesis is very similar to this idea but instead measure the pilots stress levels at all time. This information about the pilots could then be used to help pilots by providing them with valuable information precisely when needed. Further it could aid pilots manage their stress and, through a future system, it would be able to interfere with pilot decisions if they are deemed unsuitable to be in control.
3. Method
In the beginning of the thesis a literature study was carried out to gain an understanding of the scope of the research already conducted in this area and other similar human-operated vehicles. Further prior research on human psychology in relation to stress and panic was studied and how these factors are measured and classified in today’s state of practice. As an extension of the literature study, a consultation with an expert2 was conducted to gain
an understanding of how stress in cockpit environments are handled and how to best simulate this. In this consultation, a stressful departure was chosen to be the scenario in the simulation experiment for this thesis. The scenario will then be tested twice, once with and once without the calming measure on the same pilots to determine the difference. If there is a difference, it might imply a significant effect on safety to install a system that helps the pilot to deal with and manage his or her stress.
The simulation was carefully planned and conducted with the supervision and consultation of experts in flight simulation training to give qualitative and systematic results. In order to detect the level of stress several algorithms have been analyzed using data collected by ECG sensors, finger temperature and completion of the given task. As previously stated the finger temperature has been chosen because recent studies show that stress leads to a loss in finger temperature and that the stress even can, as stated before, be diagnosed with 81% accuracy through this method [6].
Simulations of a stress-inducing situation in the cockpit will be conducted with current pilot students to measure the psychological and physiological reactions and its effects on a pilot’s decision making. Subsequently this data would be assessed with varying methods to
determine the importance of a system measuring stress in a cockpit environment. The expert in flight simulation training that has volunteered to aid with this thesis work comes from SAA3, a well-known and highly regarded aviation school in Västerås, Sweden.
The ten pilot students volunteering during the experiment, all attend SAA. The second question in the problem formulation will be determined by studying the current rules and standards outlined in in CS-25 and determine the potential system’s concurrence to these [8]. Also, see what student pilots think of the idea and evaluate the future of similar systems.
3.1 Simulation
The simulation was carried out with two equal scenarios, both designed by an expert. Both scenarios involve situations with heavy workload in a departure situation. It is very
important that there is no outside interference with the experiment to make it as independent and unbiased as possible. Every test was carried out as follows.
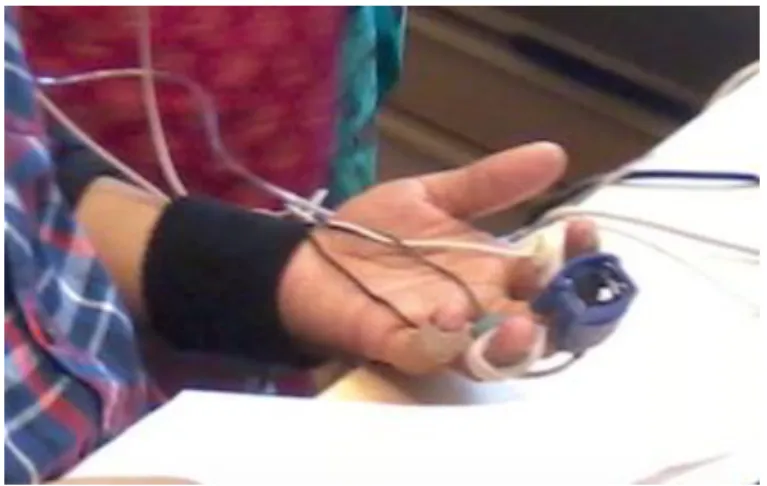
The participant entered the simulator, was instructed to read and sign a letter of consent (Appendix 1). When the participant had agreed to take part in the test he or she was rigged with all the sensors used. When all the sensors were checked, and working the participant took place in the left seat of the cockpit shown in figure 1 and was given ATC instructions of how to depart from the airport. The ATC4 then gave every participant a series of different
instructions to create as heavy of a workload as they could manage. After a few minutes the test was concluded and the next session was about to start. For this session, every
participant was informed to use a few calming measures, described under 3.2. A similar
3 Scandinavian Aviation Academy
4Teemu Määttänen also played the role of ATC
scenario was then carried out again but from a different runway and with different instructions. The workload was however, equivalent to that of the first session.
The student pilots participating in the experiment were all commercial pilot students at SAA in Västerås with between two and five semesters of experience. They are all between 21 and 25 years old, one female and nine males.
When both sessions had been carried out, Teemu evaluated the pilots and gave them a score of 1 to 10 to rate their performance, both with and without the calming measures. The participants themselves also answered a few questions about their experience (Appendix 2).
3.2 Calming measures
The calming measures have been chosen out of consultation with Göran Keckelund, a
professor in stress research from Stockholm University. The consultation took place over the phone on the 13th of March. Göran agreed to help me choose calming measures to use in
the experiment. A small list with several different suggestions was made to choose from. After a short discussion, we concluded the three measures that would be used: Apply cold temperature on their hand to “wake them up”, tell the pilot that they are stressed and that they should be more careful and the last one, closing their eyes while taking a few deep breaths. These were the techniques Göran suggested and thought would work and were subsequently used in the simulations. The participants were instructed to use these methods several times during the second session.
3.3 Data analysis
The data was collected using cStress5 software from PBM Stressmedicin. When the data was
analyzed, through cStress, a problem with the raw-data was discovered and because of this filtering and smoothening of the HRV and ECG data was required. The data was smoothened using median calculations. The maximum heart rate was still deemed to be a little high. Because of this the maximum heart rate is ruled out from the results.
When the data had been treated, it was extracted to MS Excel and a few calculations was carried out to conclude a result. All calculations are shown in their entirety in appendix 4. The surveys were analyzed using Google forms and are shown in their entirety in Appendix 6.
To compare the data and to determine if there is a significant difference between the first and the second session a two-way ANOVA test with replication was used. The alpha value was set to 0.05 since it is an accepted standard value and gives a good picture of the result and only lets as a 5% chance of determining that there is a significant difference when there is none. This means that the results can be determined with a 95% certainty.
This may not be enough to guarantee that the results are unanimous and correct. Statistical results could always be altered to show different things depending on from which point of view they are looked at. Another problem with statistical results in this study is that they may counter predict each other. Because of this another method was also used, case based reasoning.
3.4 Case-based reasoning
Case-based reasoning (CBR) is in its roots a problem-solving AI paradigm. It is, however, said to be very different from other similar AI approaches. CBR is a methodology similar to human cognitive reasoning for problem solving and learning that solves problems based on previous experiences. It can recognize and compare problems and situations to similar past problems. Then applying this to the new problem and solving it that way [9]. This also makes the CBR even smarter for every time since it now has another situation to compare new upcoming situations with. In figure 2 the CBR-cycle is explained in a more detailed way [10]. In this thesis CBR will be used to recognize trends and patterns in stress related signals such as FT, ECG, HR, HRV and SCL by comparing them to previous cases.
4. Ethical and Societal Considerations
From an ethical perspective, this report does have a few notes that needs to be addressed. Firstly, all the test subjects’ personal and medical information will be kept confidential. All subjects will also receive aliases for them to stay completely anonymous. Before any simulation commences all subjects will be informed of my thesis and its purpose. The experiment itself could be discomforting for the subjects but all subjects will be
informed of the methods and circumstances of the study beforehand and are also required to sign a letter of consent. All subjects are also free to abort the participation at any time.
To ensure the quality and independence of the thesis subjects involved in it are not allowed to drink coffee before or during this test to avoid altering the result. They should also arrive well rested and are not allowed out in the cold for some time before the experiment will commence.
5. Technical description
In this chapter a more detailed description of some of the more technical operations of the thesis will be explained in a more detailed manor. This to make the whole experiment and results as reproducible as possible for someone reading this.
5.1 Simulation
The experiment was carefully planned together with an expert and the scenario chosen was a heavy workload departure with the ATC constantly giving new directions and traffic to avoid. The pilot or participants were seated in the left-hand seat after being fitted with sensors on both wrists and on his or hers left hand fingers. The sensors involved were finger temperature, skin conductance and an ECG. The setup is displayed in figure 3. The data was recorded by cStress and later analyzed and smoothened by the same software together with MS Excel.
The pilots were not given any instructions out of the ordinary under similar flight situations to ensure all results would be authentic. Before the second session however, they received instructions about the calming measures that they were supposed to use, more about the calming measures in 3.2. When both sessions were complete every participant was required to fill out a survey about their experience and their thoughts about the test. Teemu
Määttänen, who also designed the scenarios scored every participant on both the first and the second flight.
5.2 Statistical data analysis
As stated above all signal data was collected using cStress. The data was then smoothed by running median. However, only the heart rate and IBI needed smoothing. During this process, it became obvious that the heart rate signal was faulty. The heart rate signal was decided to be beyond repair and since there was no time to redo the experiment it had to be ruled out from the thesis.
The signal data was then extracted to MS Excel, further calculations and analysis was then
performed here. Firstly, a mean difference value calculation between the first and the second session was carried out.
To be able to see if the results from this test is valid, and to see if there is an actual significant difference between the signal data from the first and the second session, an ANOVA-test was carried out.
The ANOVA-test was also carried out in MS Excel with the Analysis ToolPak add-in. The data needed a rearrangement and then the function was used. P-values were considered and F-value and F-critical were compared to each other to infer if there was a significant difference between the two sessions.
5.3 Case-based classification
Here a CBR tool is used to classify and evaluate every pilot stress-levels in order to observe any potential difference between the first and the second session. The CBR tool for
classification using physiological signals was developed during the IMod project6.
Subsequently every new case was compared with old, already solved cases. Every session by itself is a new case in this thesis. This means that there is a total of 20 cases, each pilot recorded 2 cases each. The comparison library that was used in this thesis is the case library, a library specifically built for FT, SC and HRV for CBR classification when using maximum, minimum, mean and standard deviation values.
To be able to compare one of our new cases with an old one in the library a similarity function is needed. 𝑆𝑖𝑚𝑖𝑙𝑎𝑟𝑖𝑡𝑦(𝐶, 𝑆) = ∑ 𝑤𝑓∗ 𝑠𝑖𝑚(𝐶𝑓, 𝑆𝑓) 𝑛 𝑓=1 𝑤𝑓= 𝑙𝑤𝑓 ∑𝑓=1𝑛 𝑙𝑤𝑓
This is the global similarity function where C represents a new case and S a stored one. Similarity is showing in a value between 0 and 1 where 1 is 100% similarity and vice versa. 𝑠𝑖𝑚(𝐶𝑓, 𝑆𝑓) is the local similarity function. Every feature has their own weight defined for them and here 𝑙𝑤𝑓 is the local weight for each feature. By calculating the modified Euclidean
distance function (𝑠𝑖𝑚(𝐶𝑓, 𝑆𝑓)) and fuzzy similarity algorithm we now have a system that
would work in this thesis to determine patterns and recognize similarities from older cases. 𝑠𝑖𝑚(𝐶𝑓, 𝑆𝑓) = 1 −
𝑎𝑏𝑠(𝐶𝑓− 𝑆𝑓)
𝑀𝑎𝑥(𝐶𝑓, 𝑆𝑓) − 𝑀𝑖𝑛(𝐶𝑓, 𝑆𝑓)
𝑎𝑏𝑠(𝐶𝑓− 𝑆𝑓) is the normalized absolute difference between both cases [11].
Leave-one-out validation was used during the evaluation of CBR classification.
6
http://www.es.mdh.se/projects/281-IMod___Intelligent_Concentration_Monitoring_and_Warning_System_for_Professional_Dri vers
6. Results
To aid the interpretation of the results in this thesis I have used a similar study to help understand and to help draw conclusions from my results. This study is done by S. Begum, M. Ahmed and R. Filla [11].
6.1 Statistical methods
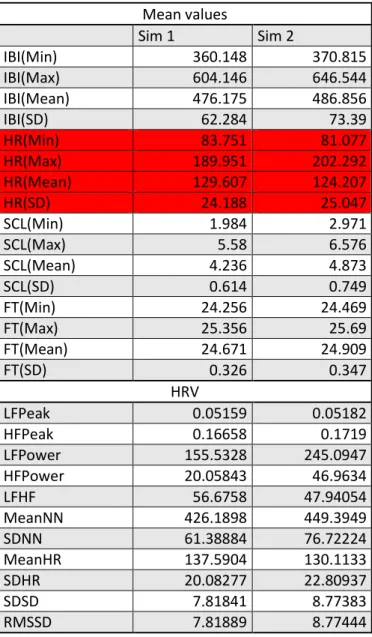
Below a few tables showing the results from the statistical methods. At first glance you can see that there is an actual difference between the first and the second session. The heart rate is indicated in red since it has been omitted from this thesis. A complete view of the numbers and calculations can be found in appendix 3, 4 and 5.
Table 1: Mean values from every participant
Mean values Sim 1 Sim 2 IBI(Min) 360.148 370.815 IBI(Max) 604.146 646.544 IBI(Mean) 476.175 486.856 IBI(SD) 62.284 73.39 HR(Min) 83.751 81.077 HR(Max) 189.951 202.292 HR(Mean) 129.607 124.207 HR(SD) 24.188 25.047 SCL(Min) 1.984 2.971 SCL(Max) 5.58 6.576 SCL(Mean) 4.236 4.873 SCL(SD) 0.614 0.749 FT(Min) 24.256 24.469 FT(Max) 25.356 25.69 FT(Mean) 24.671 24.909 FT(SD) 0.326 0.347 HRV LFPeak 0.05159 0.05182 HFPeak 0.16658 0.1719 LFPower 155.5328 245.0947 HFPower 20.05843 46.9634 LFHF 56.6758 47.94054 MeanNN 426.1898 449.3949 SDNN 61.38884 76.72224 MeanHR 137.5904 130.1133 SDHR 20.08277 22.80937 SDSD 7.81841 8.77383 RMSSD 7.81889 8.77444
Table 2: The difference between mean values from session 1 and 2 Mean Difference IBI(Min) -10.667 IBI(Max) -42.398 IBI(Mean) -10.681 IBI(SD) -11.106 HR(Min) 2.674 HR(Max) -12.341 HR(Mean) 5.4 HR(SD) -0.859 SCL(Min) -0.987 SCL(Max) -0.996 SCL(Mean) -0.637 SCL(SD) -0.135 FT(Min) -0.213 FT(Max) -0.334 FT(Mean) -0.238 FT(SD) -0.021 HRV LFPeak -0.00023 HFPeak -0.00532 LFPower -89.56187 HFPower -26.90497 LFHF 8.73526 MeanNN -23.20515 SDNN -15.3334 MeanHR 7.4771 SDHR -2.7266 SDSD -0.95542 RMSSD -0.95555
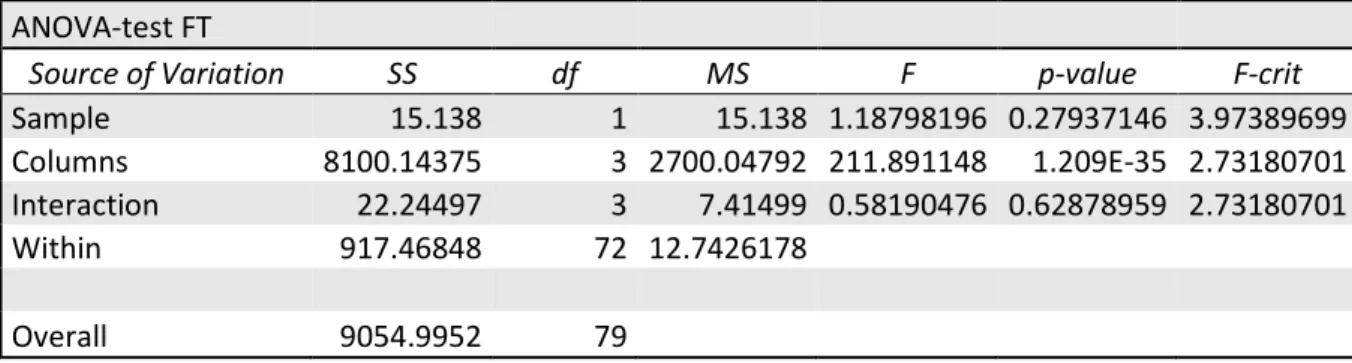
If we only look at this data, there is a difference between the first and the second test but to see if there is an actual significant difference an test needs to be done. The ANOVA-tests were done separately for every category.
SS, the sums of squares represents a measure of deviation or variation from the mean value. df is the number of independent parts that went into the calculation of the estimate. MS is the mean squares. The F-value is a ratio between the variances. P-value is the probability value and F-crit is the cutoff point for the alpha level of significance (for this test 0.05).
Table 3: ANOVA-test with IBI data
ANOVA-test IBI
Source of Variation SS df MS F p-value F-crit Sample 8082.41115 1 8082.41115 0.634064 0.42848625 3.97389699 Columns 3464696.62 3 1154898.87 90.6016522 2.1996E-24 2.73180701 Interaction 3433.49524 3 1144.49841 0.08978574 0.96543953 2.73180701 Within 917783.692 72 12746.9957 Overall 4393996.21 79
Table 4: ANOVA-test with SCL data
ANOVA-test SCL
Source of Variation SS df MS F p-value F-crit Sample 9.48753125 1 9.48753125 2.40015843 0.12570761 3.97389699 Columns 334.732694 3 111.577565 28.2269249 3.5464E-12 2.73180701 Interaction 2.46336375 3 0.82112125 0.20772749 0.89073635 2.73180701 Within 284.60715 72 3.95287708 Overall 631.290739 79
Table 5: ANOVA-test with FT data
ANOVA-test FT
Source of Variation SS df MS F p-value F-crit Sample 15.138 1 15.138 1.18798196 0.27937146 3.97389699 Columns 8100.14375 3 2700.04792 211.891148 1.209E-35 2.73180701 Interaction 22.24497 3 7.41499 0.58190476 0.62878959 2.73180701 Within 917.46848 72 12.7426178 Overall 9054.9952 79
Table 6: ANOVA-test with HRV data
ANOVA-test HRV
Source of Variation SS df MS F p-value F-crit Sample 9351.78597 1 9351.78597 0.93679227 0.33428491 3.88885293 Columns 3485129.27 10 348512.927 34.9114293 1.4967E-38 1.87876664 Interaction 38949.5649 10 3894.95649 0.39016773 0.94995729 1.87876664 Within 1976589.35 198 9982.77452 Overall 5510019.98 219
When comparing the p-values to the chosen alpha value it can be determined that there is no significant difference between the two sessions. This can be seen because the p-value compared to the alpha (alpha=0.05) is significantly larger. If it would instead have been
lower, the results would have been significantly different. With a 95% certainty, the difference you can see in table 1 and 2 are either by chance or not large enough to be significant.
6.2 Case-based reasoning classification
As stated earlier, the cases have been divided so that every session is a case by itself. This means that every pilot recorded two cases and that a total of 20 cases was recorded. First session shows as the positive (P) and the second, with the calming measures shows as the negative (N).
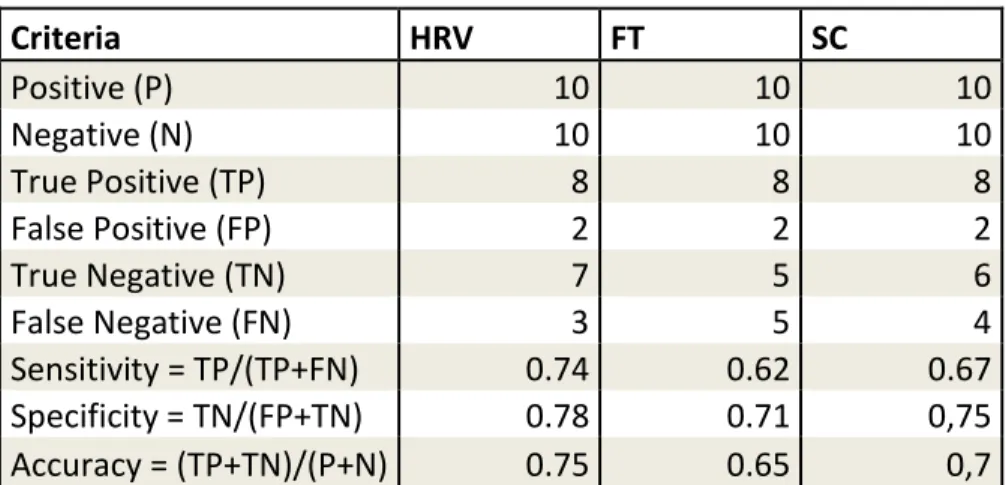
Table 7: Results from CBR
Criteria HRV FT SC Positive (P) 10 10 10 Negative (N) 10 10 10 True Positive (TP) 8 8 8 False Positive (FP) 2 2 2 True Negative (TN) 7 5 6 False Negative (FN) 3 5 4 Sensitivity = TP/(TP+FN) 0.74 0.62 0.67 Specificity = TN/(FP+TN) 0.78 0.71 0,75 Accuracy = (TP+TN)/(P+N) 0.75 0.65 0,7
From table 7 the results from the CBR classification can be concluded. A case is classified as stressed when it is set to true. This means that in the first session there were 8 cases out of 10 that were classified as stressed. The data is even unanimous from all three categories there. In the second session, there were an average of 6 cases classified as stressed. Average number is calculated from all three categories. The difference is small but of only marginal size.
The sensitivity of the classification implies to how sensitive the test was, while specificity denotes the precision of the classification. Both numbers need to be higher in order to draw precise conclusions from the classification since they, in a way, represent how many of the cases are correctly classified.
6.3 Survey results
The surveys answered by the pilots were not unanimous. They represented widely different opinions on whether these calming measures were effective or not. The possible factors leading to this disparity are discussed more in section 8.
50% of the pilots performed better when using calming measures while 50% performed worse. 80% believed it to be a good idea to measure pilot stress but nearly all felt that the calming measures were a distraction from their real assignment which made them feel even more stress. A Summary of all the answers can be found in appendix 6.
6.4 Current aviation safety rules and standards
Today, EASA rules does not say anything about a system like this or any system measuring vitals on pilots. It does however, say things about general avionic that would apply for this system as well. Since my study of CS-25 was only a minor one I will not state these rules here but they can be found in CS-25 on EASAs official website [8].
7. Discussion
The results from the signal data in this thesis are disproving my hypothesis about calming measures helping pilots to manage their stress. With modifications or in other applications the use of calming measures could potentially be effective and should be the topic of future studies in aviation.
By analyzing the results may have turned out as they did, the first thing that comes to mind is that this was a very small sample-size with inexperienced pilots. If experienced pilots had been used instead and with a larger sample-size the results may have been vastly different. Longer simulation tests could also be a difference maker since it does not leave as much to chance and the test would not be affected as much by surrounding circumstances.
If we analyze the data all together, we can see that many of the participants answered in the survey that they felt more stressed when they had to think about the calming measures as well (appendix 6). This might just be a result of the participants not being used to performing such tasks things while flying. However, this factor could be prevented by conducting
simulations with calming measures during a longer period of time with several sessions per participant. If similar calming measures are implemented in pilot training the results may also have differed. This hypothesis is supported by the survey where most participants believed it was a good idea to measure stress but using the data results in another way. Different calming measures may have given different results.
The fact that the results did not show any significant difference at all still stands though. But maybe it should have? Since many of the pilots felt more stressed from using the calming measures. Then maybe the two factors canceled each other out and a more significant result would be acquired if a larger population of participants was used.
7.1 Case-based reasoning
When considering table 7 it is easy to notice that the accuracy of the test was not very high. The HRV has the highest accuracy which may be due to there being more features in the HRV data than in FT or SCL. The overall low accuracy may also be affected by the short session time. A longer time frame could potentially have raised the accuracy and another result may have shown. It shows there is a small difference between the two sessions but it is not significant enough considering the sensitivity, specificity and accuracy were too low to have but an insignificant effect. These values may have been higher if more sessions for a longer period of time would have been conducted instead.
7.2 Aviation safety rules and standards
As stated in the result section, there are no current rules that specifically govern the application or classification of a system like this. Although it is to be considered under general avionics rules. However, if a system measuring stress would one day be a reality in commercial aviation it would probably be heavily regulated due to sensitive and personal information about pilots. Also, if it would ever be able to interfere with pilot decisions it would need to be extremely safe and reliable. A more realistic approach may be that the system just measure and diagnose pilot stress levels and then try to help him or her to manage their stress instead.
7.3 Related research
Other research on similar subjects have previously been conducted. For example, a company named Rockwell Collins have studied the possibility to develop and install a panic button in the cockpits of new airliners. The panic button, when pressed, would let the aircraft
computers take control of the airplane and let its computers do everything in its power to save the airplane and resume stable flight or maybe even land. [12]
A system that measures stress would need to be combined with something else to be able to evaluate every situation and the data from the stress-sensors. One way to do this is CBR. Collecting data that show how these signals look when people are stressed and teaching that to the system via CBR may just be the perfect way to solve this problem in a cockpit
environment. Letting artificial intelligence interpret and evaluate pilot stress have the potential to help save hundreds of lives. In fact, using CBR in vehicles to evaluate drivers mental state is already being done. At Mälardalen University S. Begum and M. Ahmed have been studying wheel loaders. Here they designed a system that collects data via finger temperature, HRV and ECG signals. These signals are then sent through a CBR-cycle to retrieve the information and then evaluate the drivers state of mind. Their conclusion show that CBR can perform almost as good as experts monitoring and evaluating stress for the drivers. It is also said that CBR has a lot more potential in this area and that in the future even more sensors and data could be extended to be included in the system [11][13].
8. Conclusion
In conclusion, the results of the experiment conducted clearly disproved the hypothesis of the study (that calming measures do influence pilot decision in stressful situations). The effects of the calming measures were nonsignificant in this study. This might however, only be because of the small sample size used.
This test and this thesis still might still be glancing into the future and what to come. The survey results of the participants can be useful in drawing the conclusion that further studies on this subject is needed. It also suggests that the results from the signal data may have been significantly different if the participants would have been comfortable with the calming measures already before the simulation test was conducted. This conclusion is drawn from what the participant have answered in the survey and from the signal data who did not show any significant difference even though they said they felt more stressed when using the calming measures.
Further the study suggests that a system like this may very well be a part of the future in aviation industry. A human brain has come to be the weak link in today’s machinery.
Especially in airplanes. An aircraft is such a complex piece of technology that a human brain has a hard time to comprehend and interpret all the information presented for him or her. At the same time, we as humans, have a hard time to completely trust computers. That is why I think this might be a good compromise. It will still be a human pilot in control but he or she will be aided or maybe even get their abilities enhanced by a computer.
8.1 Future research
A system measuring stress does have a very high potential in raising safety in the aviation industry and might very well be developed and implemented in the aviation industry in the future. Thus, further research concerning the application of such a system would work and be designed needs to be conducted. This would study the effect of the system on pilot performance. This could potentially prove the initial steps in developing a system measuring stress that can be applied in a cockpit environment and may be just one step on the way to a completely automated cockpit. An attempt to combine the best of both worlds in human pilots and computer automation. Future research should, in my opinion, be focused on
complementing the human pilots to make aviation even safer and to avoid unnecessary accidents caused by human failures.
If this thesis would ever be replicated or a similar one to this, it is recommended to use more time per session and more participants to be able to conclude a significant result. Another way to get a significant result might be to use more sensors. More signal data would probably result in a more precise result and significant differences would be easier to conclude.
Outside of this specific thesis and experiment the next step in measuring stress in cockpit environment might be to research the potential applications of a system like that. How could it be used? What should it be used for? Does it enhance safety or is it maybe a safety risk?
References
[1] Bea, “Final Report: Airfrance 447, 1st june 2009,” no. June 2009, pp. 1–224, 2012. [2] S. R. Murray, “Deliberate Decision Making by Aircraft Pilots: A Simple Reminder to
Avoid Decision Making Under Panic,” Int. J. Aviat. Psychol., vol. 7, no. 1, pp. 15–36, 1997.
[3] R. A. Butler, G. and Hope, Manage your mind: The mental fitness guide. Oxford: Oxford University Press, 1995.
[4] E. Ericson and T. Ericson, Medicinska sjukdomar, 4th ed. Studentlitteratur AB, 2012. [5] M. Malik, “Guidelines Heart rate variability,” Eur. Heart J., vol. 17, pp. 354–381, 1996. [6] S. Begum, “Sensor signal processing to extract features from finger temperature in a
case-based stress classification scheme,” WISP 2009 - 6th IEEE Int. Symp. Intell. Signal
Process. - Proc., pp. 193–198, 2009.
[7] A. Sebastian, “Report Information from ProQuest,” no. January, 2016.
[8] Easa, “Certification Specifications and Acceptable Means of Compliance for Large Aeroplanes CS25,” no. July, p. 885, 2012.
[9] J. L. Kolodner, “An Introduction to Case-Based Reasoning *,” 1992.
[10] A. Aamodt, “Case-Based Reasoning : Foundational Issues , Methodological Variations , and System Approaches,” vol. 7, no. 1, pp. 39–59, 1994.
[11] M. U. Ahmed, “Mental State Monitoring System for the Professional Drivers Based on Heart Rate Variability Analysis,” pp. 35–42, 2012.
[12] D. J. Balar, “Corporate News: Would Pilot ‘Panic Button’ Save the Day or Tie Hands?,” no. January, p. A.2, 2012.
[13] I. W. Ramon Lopez De Mantras, David McSherry, Derek Bridge, David Leake, Barry Smyth, Susan Craw, Boi Faltings, Mary Lou Maher, Michael T. Cox, Kenneth Forbus, Mark Keane, Agnar Aamodt, “Retrieval , reuse , revision and retention in case-based reasoning,” pp. 215–240, 2006.
Appendixes
Appendix 1Letter of consent
This research is all a part of Emil Kangas thesis work for his bachelor degree in aeronautical engineering. The thesis is focused on pilot stress and to show the importance of developing a system who helps the pilots coupe with their stress.
All data collected will be anonymous and will not show any names anywhere in the report. The report will however be submitted online for everyone to read. The simulation might be recorded on camera.
As a participant for this test you are expected to act normal and perform as good as you can in the simulator. There will be two different simulations and the details of which will be presented just before every simulation. The participant is also expected to answer a few questions about his/her experience when the test is done. The simulation itself does not include any risk for the participants.
I agree to participate in this test: ________________________________ Name:
________________________________ Simulation number:
Appendix 3
Sim 1 Sim 2
Name Measure Unit Value Name Measure Unit Value Difference
Pilot 1 Pilot 1
Biofeedback Biofeedback
2017-03-21 16:18 2017-03-21 16:48
IBI Minimum ms 485.03 IBI Minimum ms 528.37 -43.34 IBI Maximum ms 696.9 IBI Maximum ms 718.24 -21.34 IBI Mean ms 581.61 IBI Mean ms 640.55 -58.94
IBI SD ms 59.47 IBI SD ms 52.92 6.55
HR(ECG) Minimum bpm 81.56 HR(ECG) Minimum bpm 80.17 1.39 HR(ECG) Maximum bpm 182.03 HR(ECG) Maximum bpm 197.15 -15.12 HR(ECG) Mean bpm 102.12 HR(ECG) Mean bpm 94.17 7.95 HR(ECG) SD bpm 13.25 HR(ECG) SD bpm 14.08 -0.83 SCL Minimum uMho 1.12 SCL Minimum uMho 2.44 -1.32 SCL Maximum uMho 8.19 SCL Maximum uMho 7.95 0.24 SCL Mean uMho 6.56 SCL Mean uMho 6.27 0.29 SCL SD uMho 0.92 SCL SD uMho 1.16 -0.24 FT(C2) Minimum C 24.2 FT(C2) Minimum C 24.64 -0.44 FT(C2) Maximum C 25.81 FT(C2) Maximum C 25.86 -0.05 FT(C2) Mean C 24.7 FT(C2) Mean C 25.07 -0.37 FT(C2) SD C 0.45 FT(C2) SD C 0.34 0.11
Heart Rate Variability
LFPeak Hz 0.0494 LFPeak Hz 0.0455 0.0039 HFPeak Hz 0.1647 HFPeak Hz 0.1603 0.0044 LFPower ms^2 15.545 LFPower ms^2 62.2683 -46.7233 HFPower ms^2 4.7143 HFPower ms^2 13.4615 -8.7472 LFHF ratio 3.2974 LFHF ratio 4.6257 -1.3283 MeanNN ms 578.2813 MeanNN ms 639.7254 -61.4441 SDNN ms 57.4878 SDNN ms 53.9747 3.5131
MeanHR 1/min 103.7557 MeanHR 1/min 93.7902 9.9655 SDHR 1/min 10.0037 SDHR 1/min 8.323 1.6807 SDSD ms 2.0797 SDSD ms 4.2892 -2.2095 RMSSD ms 2.0804 RMSSD ms 4.29 -2.2096
Name Measure Unit Value Name Measure Unit Value Difference
Pilot 2 Pilot 2
Biofeedback Biofeedback
2017-03-21 17:04 2017-03-21 17:14
IBI Minimum ms 234.37 IBI Minimum ms 279.64 -45.27 IBI Maximum ms 400.63 IBI Maximum ms 557.41 -156.78 IBI Mean ms 274.85 IBI Mean ms 400.02 -125.17 IBI SD ms 27.66 IBI SD ms 76.98 -49.32 HR(ECG) Minimum bpm 120.24 HR(ECG) Minimum bpm 105.68 14.56 HR(ECG) Maximum bpm 204.8 HR(ECG) Maximum bpm 204.8 0 HR(ECG) Mean bpm 180.49 HR(ECG) Mean bpm 140.44 40.05 HR(ECG) SD bpm 22.89 HR(ECG) SD bpm 24.61 -1.72 SCL Minimum uMho 2.32 SCL Minimum uMho 0.5 1.82 SCL Maximum uMho 3.27 SCL Maximum uMho 3.69 -0.42 SCL Mean uMho 2.71 SCL Mean uMho 1.72 0.99 SCL SD uMho 0.17 SCL SD uMho 1.07 -0.9 FT(C2) Minimum C 25.76 FT(C2) Minimum C 26.5 -0.74 FT(C2) Maximum C 25.99 FT(C2) Maximum C 27.12 -1.13 FT(C2) Mean C 25.9 FT(C2) Mean C 26.66 -0.76 FT(C2) SD C 0.07 FT(C2) SD C 0.17 -0.1
Heart Rate Variability
LFPeak Hz 0.0552 LFPeak Hz 0.046 0.0092 HFPeak Hz 0.1558 HFPeak Hz 0.1727 -0.0169 LFPower ms^2 99.0226 LFPower ms^2 510.3945 -411.3719 HFPower ms^2 6.2342 HFPower ms^2 80.2872 -74.053 LFHF ratio 15.8837 LFHF ratio 6.3571 9.5266 MeanNN ms 272.8115 MeanNN ms 404.2056 -131.3941 SDNN ms 25.7859 SDNN ms 79.9465 -54.1606 MeanHR 1/min 219.9321 MeanHR 1/min 148.4393 71.4928 SDHR 1/min 19.3488 SDHR 1/min 31.0294 -11.6806 SDSD ms 5.9291 SDSD ms 12.0537 -6.1246 RMSSD ms 5.929 RMSSD ms 12.0537 -6.1247
Name Measure Unit Value Name Measure Unit Value Difference
Pilot 3 Pilot 3
Biofeedback Biofeedback
2017-03-21 17:27 2017-03-21 17:35
IBI Minimum ms 459.93 IBI Minimum ms 509.74 -49.81 IBI Maximum ms 618.76 IBI Maximum ms 718.29 -99.53 IBI Mean ms 565.66 IBI Mean ms 615.71 -50.05 IBI SD ms 35.28 IBI SD ms 49.59 -14.31 HR(ECG) Minimum bpm 84.31 HR(ECG) Minimum bpm 80.48 3.83 HR(ECG) Maximum bpm 197.5 HR(ECG) Maximum bpm 204.75 -7.25 HR(ECG) Mean bpm 108.97 HR(ECG) Mean bpm 98.93 10.04 HR(ECG) SD bpm 17.21 HR(ECG) SD bpm 13.25 3.96 SCL Minimum uMho 0.5 SCL Minimum uMho 0.5 0 SCL Maximum uMho 2.93 SCL Maximum uMho 2.26 0.67 SCL Mean uMho 2.38 SCL Mean uMho 1.91 0.47 SCL SD uMho 0.48 SCL SD uMho 0.21 0.27 FT(C2) Minimum C 25.6 FT(C2) Minimum C 25.37 0.23 FT(C2) Maximum C 26.25 FT(C2) Maximum C 25.84 0.41 FT(C2) Mean C 25.83 FT(C2) Mean C 25.46 0.37 FT(C2) SD C 0.17 FT(C2) SD C 0.11 0.06
Heart Rate Variability
LFPeak Hz 0.0455 LFPeak Hz 0.0592 -0.0137 HFPeak Hz 0.1711 HFPeak Hz 0.253 -0.0819 LFPower ms^2 102.6096 LFPower ms^2 42.251 60.3586 HFPower ms^2 12.9821 HFPower ms^2 11.1354 1.8467 LFHF ratio 7.9039 LFHF ratio 3.7943 4.1096 MeanNN ms 567.0184 MeanNN ms 614.6251 -47.6067 SDNN ms 35.282 SDNN ms 48.4026 -13.1206
MeanHR 1/min 105.8167 MeanHR 1/min 97.6205 8.1962 SDHR 1/min 6.7653 SDHR 1/min 7.2271 -0.4618 SDSD ms 3.9479 SDSD ms 5.2619 -1.314 RMSSD ms 3.9483 RMSSD ms 5.2648 -1.3165
Name Measure Unit Value Name Measure Unit Value Difference
Pilot 4 Pilot 4
Biofeedback Biofeedback
2017-03-21 17:50 2017-03-21 18:00
IBI Minimum ms 298.61 IBI Minimum ms 299.01 -0.4 IBI Maximum ms 810.91 IBI Maximum ms 827.42 -16.51 IBI Mean ms 497.94 IBI Mean ms 402.78 95.16 IBI SD ms 149.03 IBI SD ms 153.52 -4.49 HR(ECG) Minimum bpm 70.85 HR(ECG) Minimum bpm 59.78 11.07 HR(ECG) Maximum bpm 204.8 HR(ECG) Maximum bpm 200.44 4.36 HR(ECG) Mean bpm 125.12 HR(ECG) Mean bpm 135.83 -10.71 HR(ECG) SD bpm 40.35 HR(ECG) SD bpm 39.33 1.02 SCL Minimum uMho 0.5 SCL Minimum uMho 2.93 -2.43 SCL Maximum uMho 4.86 SCL Maximum uMho 8.68 -3.82 SCL Mean uMho 3.15 SCL Mean uMho 4.45 -1.3 SCL SD uMho 0.65 SCL SD uMho 1.03 -0.38 FT(C2) Minimum C 23.39 FT(C2) Minimum C 23.69 -0.3 FT(C2) Maximum C 23.82 FT(C2) Maximum C 25.58 -1.76 FT(C2) Mean C 23.66 FT(C2) Mean C 24.45 -0.79 FT(C2) SD C 0.1 FT(C2) SD C 0.56 -0.46
Heart Rate Variability
LFPeak Hz 0.051 LFPeak Hz 0.0469 0.0041 HFPeak Hz 0.1557 HFPeak Hz 0.1545 0.0012 LFPower ms^2 331.8715 LFPower ms^2 735.8621 -403.9906 HFPower ms^2 62.4083 HFPower ms^2 177.3624 -114.9541 MeanNN ms 493.7311 MeanNN ms 425.1987 68.5324 LFHF ratio 5.3177 LFHF ratio 4.1489 1.1688 SDNN ms 142.6448 SDNN ms 179.9639 -37.3191 MeanHR 1/min 121.5236 MeanHR 1/min 141.1105 -19.5869 SDHR 1/min 37.6871 SDHR 1/min 46.3968 -8.7097 SDSD ms 12.8425 SDSD ms 12.2595 0.583 RMSSD ms 12.8431 RMSSD ms 12.2601 0.583
Name Measure Unit Value Name Measure Unit Value Difference
Pilot 5 Pilot 5
Biofeedback Biofeedback
2017-03-21 18:16 2017-03-21 18:26
IBI Minimum ms 608.86 IBI Minimum ms 554.4 54.46 IBI Maximum ms 674.69 IBI Maximum ms 724.86 -50.17 IBI Mean ms 642.55 IBI Mean ms 643.9 -1.35 IBI SD ms 18.53 IBI SD ms 30.69 -12.16 HR(ECG) Minimum bpm 80.73 HR(ECG) Minimum bpm 76.86 3.87 HR(ECG) Maximum bpm 100.15 HR(ECG) Maximum bpm 204.8 -104.65 HR(ECG) Mean bpm 92.17 HR(ECG) Mean bpm 96.47 -4.3 HR(ECG) SD bpm 4.28 HR(ECG) SD bpm 21.86 -17.58 SCL Minimum uMho 0.58 SCL Minimum uMho 0.92 -0.34 SCL Maximum uMho 3.95 SCL Maximum uMho 4.14 -0.19 SCL Mean uMho 2.26 SCL Mean uMho 2.49 -0.23 SCL SD uMho 0.46 SCL SD uMho 0.8 -0.34 FT(C2) Minimum C 24.81 FT(C2) Minimum C 24.76 0.05 FT(C2) Maximum C 25.45 FT(C2) Maximum C 26.3 -0.85 FT(C2) Mean C 25.05 FT(C2) Mean C 25.31 -0.26 FT(C2) SD C 0.19 FT(C2) SD C 0.37 -0.18
Heart Rate Variability
LFPeak Hz 0.0726 LFPeak Hz 0.0629 0.0097 HFPeak Hz 0.1518 HFPeak Hz 0.156 -0.0042 LFPower ms^2 18.5164 LFPower ms^2 30.6721 -12.1557 HFPower ms^2 4.424 HFPower ms^2 5.0702 -0.6462 LFHF ratio 4.1855 LFHF ratio 6.0495 -1.864 MeanNN ms 641.242 MeanNN ms 640.1394 1.1026 SDNN ms 18.5362 SDNN ms 30.8546 -12.3184 MeanHR 1/min 93.5684 MeanHR 1/min 93.7296 -0.1612 SDHR 1/min 2.7016 SDHR 1/min 4.4454 -1.7438 SDSD ms 4.1962 SDSD ms 6.9655 -2.7693 RMSSD ms 4.1978 RMSSD ms 6.963 -2.7652
Name Measure Unit Value Name Measure Unit Value Difference
Pilot 6 Pilot 6
Biofeedback Biofeedback
2017-03-21 18:38 2017-03-21 18:45
IBI Minimum ms 321.66 IBI Minimum ms 271.45 50.21 IBI Maximum ms 655.67 IBI Maximum ms 632.21 23.46 IBI Mean ms 550.14 IBI Mean ms 484.22 65.92 IBI SD ms 74.01 IBI SD ms 118.27 -44.26 HR(ECG) Minimum bpm 73.35 HR(ECG) Minimum bpm 74.07 -0.72 HR(ECG) Maximum bpm 204.8 HR(ECG) Maximum bpm 204.8 0 HR(ECG) Mean bpm 114.89 HR(ECG) Mean bpm 119.93 -5.04 HR(ECG) SD bpm 30.24 HR(ECG) SD bpm 33.14 -2.9 SCL Minimum uMho 2.32 SCL Minimum uMho 6.25 -3.93 SCL Maximum uMho 9.12 SCL Maximum uMho 9.68 -0.56 SCL Mean uMho 6.75 SCL Mean uMho 8.34 -1.59 SCL SD uMho 0.94 SCL SD uMho 0.61 0.33 FT(C2) Minimum C 24.74 FT(C2) Minimum C 24.6 0.14 FT(C2) Maximum C 25.54 FT(C2) Maximum C 25.55 -0.01 FT(C2) Mean C 25.12 FT(C2) Mean C 25.05 0.07 FT(C2) SD C 0.25 FT(C2) SD C 0.28 -0.03
Heart Rate Variability
LFPeak Hz 0.0427 LFPeak Hz 0.0602 -0.0175 HFPeak Hz 0.1575 HFPeak Hz 0.1806 -0.0231 LFPower ms^2 182.0891 LFPower ms^2 116.8029 65.2862 HFPower ms^2 17.7974 HFPower ms^2 10.6225 7.1749 LFHF ratio 10.2312 LFHF ratio 10.9958 -0.7646 MeanNN ms 549.3004 MeanNN ms 494.6044 54.696 SDNN ms 73.7212 SDNN ms 117.3469 -43.6257 MeanHR 1/min 109.2299 MeanHR 1/min 121.3091 -12.0792 SDHR 1/min 19.5234 SDHR 1/min 40.1411 -20.6177 SDSD ms 9.0502 SDSD ms 7.744 1.3062 RMSSD ms 9.0504 RMSSD ms 7.7436 1.3068
Name Measure Unit Value Name Measure Unit Value Difference
Pilot 7 Pilot 7
Biofeedback Biofeedback
2017-03-21 18:59 2017-03-21 19:08
IBI Minimum ms 435.88 IBI Minimum ms 456.12 -20.24 IBI Maximum ms 669.71 IBI Maximum ms 642.03 27.68 IBI Mean ms 555.57 IBI Mean ms 557.71 -2.14
IBI SD ms 33.54 IBI SD ms 37.58 -4.04
HR(ECG) Minimum bpm 60.14 HR(ECG) Minimum bpm 76.62 -16.48 HR(ECG) Maximum bpm 191.03 HR(ECG) Maximum bpm 197.67 -6.64 HR(ECG) Mean bpm 108.52 HR(ECG) Mean bpm 107.04 1.48 HR(ECG) SD bpm 20.17 HR(ECG) SD bpm 17.4 2.77 SCL Minimum uMho 1.34 SCL Minimum uMho 1.1 0.24 SCL Maximum uMho 2.82 SCL Maximum uMho 3.87 -1.05 SCL Mean uMho 2.43 SCL Mean uMho 3.12 -0.69 SCL SD uMho 0.22 SCL SD uMho 0.25 -0.03 FT(C2) Minimum C 23.34 FT(C2) Minimum C 23.8 -0.46 FT(C2) Maximum C 23.61 FT(C2) Maximum C 24.41 -0.8 FT(C2) Mean C 23.5 FT(C2) Mean C 23.93 -0.43 FT(C2) SD C 0.06 FT(C2) SD C 0.12 -0.06
Heart Rate Variability
LFPeak Hz 0.0602 LFPeak Hz 0.0595 0.0007 HFPeak Hz 0.178 HFPeak Hz 0.1527 0.0253 LFPower ms^2 124.4834 LFPower ms^2 65.035 59.4484 HFPower ms^2 14.7327 HFPower ms^2 11.1305 3.6022 LFHF ratio 8.4495 LFHF ratio 5.843 2.6065 MeanNN ms 557.0691 MeanNN ms 560.6241 -3.555 SDNN ms 30.1172 SDNN ms 36.9167 -6.7995
MeanHR 1/min 107.7066 MeanHR 1/min 107.0236 0.683 SDHR 1/min 5.7716 SDHR 1/min 7.0827 -1.3111 SDSD ms 10.1275 SDSD ms 7.3881 2.7394 RMSSD ms 10.1276 RMSSD ms 7.3886 2.739
Name Measure Unit Value Name Measure Unit Value Difference
Pilot 8 Pilot 8
Biofeedback Biofeedback
2017-03-21 19:21 2017-03-21 19:32
IBI Minimum ms 244.09 IBI Minimum ms 244.65 -0.56 IBI Maximum ms 354.7 IBI Maximum ms 360.58 -5.88 IBI Mean ms 274.85 IBI Mean ms 285.46 -10.61
IBI SD ms 20.61 IBI SD ms 20.06 0.55
HR(ECG) Minimum bpm 97.15 HR(ECG) Minimum bpm 86.56 10.59 HR(ECG) Maximum bpm 204.8 HR(ECG) Maximum bpm 204.8 0 HR(ECG) Mean bpm 188.23 HR(ECG) Mean bpm 179.41 8.82 HR(ECG) SD bpm 21.01 HR(ECG) SD bpm 24.77 -3.76 SCL Minimum uMho 3.64 SCL Minimum uMho 5.94 -2.3 SCL Maximum uMho 8.08 SCL Maximum uMho 10.97 -2.89 SCL Mean uMho 6.12 SCL Mean uMho 8.59 -2.47 SCL SD uMho 1.05 SCL SD uMho 1.15 -0.1 FT(C2) Minimum C 21.8 FT(C2) Minimum C 21.64 0.16 FT(C2) Maximum C 22.14 FT(C2) Maximum C 21.97 0.17 FT(C2) Mean C 22.02 FT(C2) Mean C 21.8 0.22
FT(C2) SD C 0.1 FT(C2) SD C 0.1 0
Heart Rate Variability
LFPeak Hz 0.0524 LFPeak Hz 0.0519 0.0005 HFPeak Hz 0.2228 HFPeak Hz 0.1505 0.0723 LFPower ms^2 43.3906 LFPower ms^2 31.7573 11.6333 HFPower ms^2 10.8829 HFPower ms^2 5.5084 5.3745 LFHF ratio 3.987 LFHF ratio 5.7653 -1.7783 MeanNN ms 272.0955 MeanNN ms 284.0946 -11.9991 SDNN ms 18.0694 SDNN ms 19.7541 -1.6847
MeanHR 1/min 220.5108 MeanHR 1/min 211.1973 9.3135 SDHR 1/min 13.4623 SDHR 1/min 14.8635 -1.4012 SDSD ms 7.0148 SDSD ms 4.2332 2.7816 RMSSD ms 7.0148 RMSSD ms 4.2333 2.7815
Name Measure Unit Value Name Measure Unit Value Difference
Pilot 9 Pilot 9
Biofeedback Biofeedback
2017-03-21 19:45 2017-03-21 19:55
IBI Minimum ms 258.07 IBI Minimum ms 278.73 -20.66 IBI Maximum ms 549.33 IBI Maximum ms 628.49 -79.16 IBI Mean ms 428.76 IBI Mean ms 470.76 -42 IBI SD ms 111.6 IBI SD ms 121.19 -9.59 HR(ECG) Minimum bpm 103.15 HR(ECG) Minimum bpm 88.44 14.71 HR(ECG) Maximum bpm 204.8 HR(ECG) Maximum bpm 204.8 0 HR(ECG) Mean bpm 139.63 HR(ECG) Mean bpm 125.49 14.14 HR(ECG) SD bpm 36.22 HR(ECG) SD bpm 32.99 3.23 SCL Minimum uMho 3.46 SCL Minimum uMho 4.68 -1.22 SCL Maximum uMho 4.82 SCL Maximum uMho 6.63 -1.81 SCL Mean uMho 4.3 SCL Mean uMho 5.72 -1.42 SCL SD uMho 0.3 SCL SD uMho 0.38 -0.08 FT(C2) Minimum C 26.09 FT(C2) Minimum C 26.84 -0.75 FT(C2) Maximum C 31.68 FT(C2) Maximum C 30.96 0.72 FT(C2) Mean C 27.91 FT(C2) Mean C 28.25 -0.34 FT(C2) SD C 1.77 FT(C2) SD C 1.28 0.49
Heart Rate Variability
LFPeak Hz 0.043 LFPeak Hz 0.0458 -0.0028 HFPeak Hz 0.1505 HFPeak Hz 0.1884 -0.0379 LFPower ms^2 237.5572 LFPower ms^2 585.5364 -347.9792 HFPower ms^2 25.5892 HFPower ms^2 100.3159 -74.7267 LFHF ratio 9.2835 LFHF ratio 5.8369 3.4466 MeanNN ms 429.857 MeanNN ms 482.9564 -53.0994 SDNN ms 111.8987 SDNN ms 121.2697 -9.371 MeanHR 1/min 139.5813 MeanHR 1/min 124.2348 15.3465 SDHR 1/min 46.6823 SDHR 1/min 40.6317 6.0506 SDSD ms 11.6855 SDSD ms 15.7486 -4.0631 RMSSD ms 11.6861 RMSSD ms 15.7508 -4.0647
Name Measure Unit Value Name Measure Unit Value Difference
Pilot 10 Pilot 10
Biofeedback Biofeedback
2017-03-21 20:07 2017-03-21 20:16
IBI Minimum ms 254.98 IBI Minimum ms 286.04 -31.06 IBI Maximum ms 610.16 IBI Maximum ms 655.91 -45.75 IBI Mean ms 389.82 IBI Mean ms 367.45 22.37
IBI SD ms 93.11 IBI SD ms 73.1 20.01
HR(ECG) Minimum bpm 66.03 HR(ECG) Minimum bpm 82.11 -16.08 HR(ECG) Maximum bpm 204.8 HR(ECG) Maximum bpm 198.91 5.89 HR(ECG) Mean bpm 135.93 HR(ECG) Mean bpm 144.36 -8.43 HR(ECG) SD bpm 36.26 HR(ECG) SD bpm 29.04 7.22 SCL Minimum uMho 4.06 SCL Minimum uMho 4.45 -0.39 SCL Maximum uMho 7.76 SCL Maximum uMho 7.89 -0.13 SCL Mean uMho 5.7 SCL Mean uMho 6.12 -0.42 SCL SD uMho 0.95 SCL SD uMho 0.83 0.12 FT(C2) Minimum C 22.83 FT(C2) Minimum C 22.85 -0.02 FT(C2) Maximum C 23.27 FT(C2) Maximum C 23.31 -0.04 FT(C2) Mean C 23.02 FT(C2) Mean C 23.11 -0.09 FT(C2) SD C 0.1 FT(C2) SD C 0.14 -0.04
Heart Rate Variability
LFPeak Hz 0.0439 LFPeak Hz 0.0403 0.0036 HFPeak Hz 0.1579 HFPeak Hz 0.1503 0.0076 LFPower ms^2 400.2427 LFPower ms^2 270.3672 129.8755 HFPower ms^2 40.8192 HFPower ms^2 54.74 -13.9208 LFHF ratio 9.8052 LFHF ratio 4.9391 4.8661 MeanNN ms 388.905 MeanNN ms 368.8255 20.0795 SDNN ms 100.3452 SDNN ms 78.7927 21.5525 MeanHR 1/min 154.2793 MeanHR 1/min 162.6785 -8.3992 SDHR 1/min 38.8816 SDHR 1/min 27.953 10.9286 SDSD ms 11.3107 SDSD ms 11.7946 -0.4839 RMSSD ms 11.3114 RMSSD ms 11.7965 -0.4851
Appendix 4 Mean values Sim 1 Sim 2 IBI(Min) 360.148 370.815 IBI(Max) 604.146 646.544 IBI(Mean) 476.175 486.856 IBI(SD) 62.284 73.39 HR(Min) 83.751 81.077 HR(Max) 189.951 202.292 HR(Mean) 129.607 124.207 HR(SD) 24.188 25.047 SCL(Min) 1.984 2.971 SCL(Max) 5.58 6.576 SCL(Mean) 4.236 4.873 SCL(SD) 0.614 0.749 FT(Min) 24.256 24.469 FT(Max) 25.356 25.69 FT(Mean) 24.671 24.909 FT(SD) 0.326 0.347 0 100 200 300 400 500 600 700 IBI(Min) IBI(Max) IBI(Mean) IBI(SD) HR(Min) HR(Max) HR(Mean) HR(SD) SCL(Min) SCL(Max) SCL(Mean) SCL(SD) FT(Min) FT(Max) FT(Mean) FT(SD)
Difference in averages displayed
Mean Difference IBI(Min) -10.667 IBI(Max) -42.398 IBI(Mean) -10.681 IBI(SD) -11.106 HR(Min) 2.674 HR(Max) -12.341 HR(Mean) 5.4 HR(SD) -0.859 SCL(Min) -0.987 SCL(Max) -0.996 SCL(Mean) -0.637 SCL(SD) -0.135 FT(Min) -0.213 FT(Max) -0.334 FT(Mean) -0.238 FT(SD) -0.021 HRV LFPeak -0.00023 HFPeak -0.00532 LFPower -89.56187 HFPower -26.90497 LFHF 8.73526 MeanNN -23.20515 SDNN -15.3334 MeanHR 7.4771 SDHR -2.7266 SDSD -0.95542 RMSSD -0.95555
Appendix 5 ANOVA-test LF Pea k H FP ea k LF Po w er H FP o w er LF H F M ea nN N SD N N M ea nH R SD H R SD SD R M SS D 0, 04 94 0, 16 47 15 ,5 45 4, 71 43 3, 29 74 57 8, 28 13 57 ,4 87 8 10 3, 75 57 10 ,0 03 7 2, 07 97 2, 08 04 0, 05 52 0, 15 58 99 ,0 22 6 6, 23 42 15 ,8 83 7 27 2, 81 15 25 ,7 85 9 21 9, 93 21 19 ,3 48 8 5, 92 91 5, 92 9 0, 04 55 0, 17 11 10 2, 60 96 12 ,9 82 1 7, 90 39 56 7, 01 84 35 ,2 82 10 5, 81 67 6, 76 53 3, 94 79 3, 94 83 0, 05 1 0, 15 57 33 1, 87 15 62 ,4 08 3 49 3, 73 11 5, 31 77 14 2, 64 48 12 1, 52 36 37 ,6 87 1 12 ,8 42 5 12 ,8 43 1 0, 07 26 0, 15 18 18 ,5 16 4 4, 42 4 4, 18 55 64 1, 24 2 18 ,5 36 2 93 ,5 68 4 2, 70 16 4, 19 62 4, 19 78 0, 04 27 0, 15 75 18 2, 08 91 17 ,7 97 4 10 ,2 31 2 54 9, 30 04 73 ,7 21 2 10 9, 22 99 19 ,5 23 4 9, 05 02 9, 05 04 0, 06 02 0, 17 8 12 4, 48 34 14 ,7 32 7 8, 44 95 55 7, 06 91 30 ,1 17 2 10 7, 70 66 5, 77 16 10 ,1 27 5 10 ,1 27 6 0, 05 24 0, 22 28 43 ,3 90 6 10 ,8 82 9 3, 98 7 27 2, 09 55 18 ,0 69 4 22 0, 51 08 13 ,4 62 3 7, 01 48 7, 01 48 0, 04 3 0, 15 05 23 7, 55 72 25 ,5 89 2 9, 28 35 42 9, 85 7 11 1, 89 87 13 9, 58 13 46 ,6 82 3 11 ,6 85 5 11 ,6 86 1 0, 04 39 0, 15 79 40 0, 24 27 40 ,8 19 2 9, 80 52 38 8, 90 5 10 0, 34 52 15 4, 27 93 38 ,8 81 6 11 ,3 10 7 11 ,3 11 4 0, 04 55 0, 16 03 62 ,2 68 3 13 ,4 61 5 4, 62 57 63 9, 72 54 53 ,9 74 7 93 ,7 90 2 8, 32 3 4, 28 92 4, 29 0, 04 6 0, 17 27 51 0, 39 45 80 ,2 87 2 6, 35 71 40 4, 20 56 79 ,9 46 5 14 8, 43 93 31 ,0 29 4 12 ,0 53 7 12 ,0 53 7 0, 05 92 0, 25 3 42 ,2 51 11 ,1 35 4 3, 79 43 61 4, 62 51 48 ,4 02 6 97 ,6 20 5 7, 22 71 5, 26 19 5, 26 48 0, 04 69 0, 15 45 73 5, 86 21 17 7, 36 24 42 5, 19 87 4, 14 89 17 9, 96 39 14 1, 11 05 46 ,3 96 8 12 ,2 59 5 12 ,2 60 1 0, 06 29 0, 15 6 30 ,6 72 1 5, 07 02 6, 04 95 64 0, 13 94 30 ,8 54 6 93 ,7 29 6 4, 44 54 6, 96 55 6, 96 3 0, 06 02 0, 18 06 11 6, 80 29 10 ,6 22 5 10 ,9 95 8 49 4, 60 44 11 7, 34 69 12 1, 30 91 40 ,1 41 1 7, 74 4 7, 74 36 0, 05 95 0, 15 27 65 ,0 35 11 ,1 30 5 5, 84 3 56 0, 62 41 36 ,9 16 7 10 7, 02 36 7, 08 27 7, 38 81 7, 38 86 0, 05 19 0, 15 05 31 ,7 57 3 5, 50 84 5, 76 53 28 4, 09 46 19 ,7 54 1 21 1, 19 73 14 ,8 63 5 4, 23 32 4, 23 33 0, 04 58 0, 18 84 58 5, 53 64 10 0, 31 59 5, 83 69 48 2, 95 64 12 1, 26 97 12 4, 23 48 40 ,6 31 7 15 ,7 48 6 15 ,7 50 8 0, 04 03 0, 15 03 27 0, 36 72 54 ,7 4 4, 93 91 36 8, 82 55 78 ,7 92 7 16 2, 67 85 27 ,9 53 11 ,7 94 6 11 ,7 96 5
Si m IB I( M in ) IB I( M ax ) IB I( M ea n) IB I( SD ) SC L( M in ) SC L( M ax ) SC L( M ea n) SC L( SD ) FT (M in ) FT (M ax ) FT (M ea n) FT (S D ) Si m 1 48 5, 03 69 6, 9 58 1, 61 59 ,4 7 1, 12 8, 19 6, 56 0, 92 24 ,2 25 ,8 1 24 ,7 0, 45 23 4, 37 40 0, 63 27 4, 85 27 ,6 6 2, 32 3, 27 2, 71 0, 17 25 ,7 6 25 ,9 9 25 ,9 0, 07 45 9, 93 61 8, 76 56 5, 66 35 ,2 8 0, 5 2, 93 2, 38 0, 48 25 ,6 26 ,2 5 25 ,8 3 0, 17 29 8, 61 81 0, 91 49 7, 94 40 ,3 5 0, 5 4, 86 3, 15 0, 65 23 ,3 9 23 ,8 2 23 ,6 6 0, 1 60 8, 86 67 4, 69 64 2, 55 18 ,5 3 0, 58 3, 95 2, 26 0, 46 24 ,8 1 25 ,4 5 25 ,0 5 0, 19 32 1, 66 65 5, 67 55 0, 14 74 ,0 1 2, 32 9, 12 6, 75 0, 94 24 ,7 4 25 ,5 4 25 ,1 2 0, 25 43 5, 88 66 9, 71 55 5, 57 33 ,5 4 1, 34 2, 82 2, 43 0, 22 23 ,3 4 23 ,6 1 23 ,5 0, 06 24 4, 09 35 4, 7 27 4, 85 20 ,6 1 3, 64 8, 08 6, 12 1, 05 21 ,8 22 ,1 4 22 ,0 2 0, 1 25 8, 07 54 9, 33 42 8, 76 11 1, 6 3, 46 4, 82 4, 3 0, 3 26 ,0 9 31 ,6 8 27 ,9 1 1, 77 25 4, 98 61 0, 16 38 9, 82 93 ,1 1 4, 06 7, 76 5, 7 0, 95 22 ,8 3 23 ,2 7 23 ,0 2 0, 1 Si m 2 52 8, 37 71 8, 24 64 0, 55 52 ,9 2 2, 44 7, 95 6, 27 1, 16 24 ,6 4 25 ,8 6 25 ,0 7 0, 11 27 9, 64 55 7, 41 40 0, 02 76 ,9 8 0, 5 3, 69 1, 72 1, 07 26 ,5 27 ,1 2 26 ,6 6 0, 17 50 9, 74 71 8, 29 61 5, 71 49 ,5 9 0, 5 2, 26 1, 91 0, 21 25 ,3 7 25 ,8 4 25 ,4 6 0, 11 29 9, 01 82 7, 42 40 2, 78 15 3, 52 2, 93 8, 68 4, 45 1, 03 23 ,6 9 25 ,5 8 24 ,4 5 0, 56 55 4, 4 72 4, 86 64 3, 9 30 ,6 9 0, 92 4, 14 2, 49 0, 8 24 ,7 6 26 ,3 25 ,3 1 0, 37 27 1, 45 63 2, 21 48 4, 22 11 8, 27 6, 25 9, 68 8, 34 0, 61 24 ,6 25 ,5 5 25 ,0 5 0, 28 45 6, 12 64 2, 03 55 7, 71 37 ,5 8 1, 1 3, 87 3, 12 0, 25 23 ,8 24 ,4 1 23 ,9 3 0, 12 24 4, 65 36 0, 58 28 5, 46 20 ,0 6 5, 94 10 ,9 7 8, 59 1, 15 21 ,6 4 21 ,9 7 21 ,8 0, 1 27 8, 73 62 8, 49 47 0, 76 12 1, 19 4, 68 6, 63 5, 72 0, 38 26 ,8 4 30 ,9 6 28 ,2 5 28 ,2 5 28 6, 04 65 5, 91 36 7, 45 20 ,0 1 4, 45 7, 89 6, 12 0, 83 22 ,8 5 23 ,3 1 23 ,1 1 0, 14
Anova: Two-Factor with Replication
SUMRY IBI(Min) IBI(Max) IBI(Mean) IBI(SD) Overall
Sim 1 Count 10 10 10 10 40 Sum 3601.48 6041.46 4761.75 514.16 14918.85 Average 360.148 604.146 476.175 51.416 372.97125 Variance 16575.8888 18909.0081 16646.8586 1025.89818 55255.6107 Sim 2 Count 10 10 10 10 40 Sum 3708.15 6465.44 4868.56 680.81 15722.96 Average 370.815 646.544 486.856 68.081 393.074 Variance 15558.9362 15499.6796 15511.3047 2248.39165 57203.7176 Overall Count 20 20 20 20 Sum 7309.63 12506.9 9630.31 1194.97 Average 365.4815 625.345 481.5155 59.7485 Variance 15251.7026 16771.9022 15262.8362 1624.06419 ANOVA
Source of Variation SS df MS F p-value F-crit Sample 8082.41115 1 8082.41115 0.634064 0.42848625 3.97389699 Columns 3464696.62 3 1154898.87 90.6016522 2.1996E-24 2.73180701 Interaction 3433.49524 3 1144.49841 0.08978574 0.96543953 2.73180701 Within 917783.692 72 12746.9957 Overall 4393996.21 79
Anova: Two-Factor with Replication
SUMRY SCL(Min) SCL(Max) SCL(Mean) SCL(SD) Overall
Sim 1 Count 10 10 10 10 40 Sum 19.84 55.8 42.36 6.14 124.14 Average 1.984 5.58 4.236 0.614 3.1035 Variance 1.88816 6.00835556 3.50411556 0.11076 6.46839769 Sim 2 Count 10 10 10 10 40 Sum 29.71 65.76 48.73 7.49 151.69 Average 2.971 6.576 4.873 0.749 3.79225 Variance 4.98638778 8.57773778 6.41240111 0.13509889 9.47527429 Overall Count 20 20 20 20 Sum 49.55 121.56 91.09 13.63 Average 2.4775 6.078 4.5545 0.6815 Variance 3.512725 7.17025895 4.80407868 0.12125553 ANOVA
Source of Variation SS df MS F p-value F-crit Sample 9.48753125 1 9.48753125 2.40015843 0.12570761 3.97389699 Columns 334.732694 3 111.577565 28.2269249 3.5464E-12 2.73180701 Interaction 2.46336375 3 0.82112125 0.20772749 0.89073635 2.73180701 Within 284.60715 72 3.95287708 Overall 631.290739 79
Anova: Two-Factor with Replication
SUMRY FT(Min) FT(Max) FT(Mean) FT(SD) Overall
Sim 1 Count 10 10 10 10 40 Sum 242.56 253.56 246.71 3.26 746.09 Average 24.256 25.356 24.671 0.326 18.65225 Variance 1.95896 6.83831556 2.87087667 0.27096 117.734428 Sim 2 Count 10 10 10 10 40 Sum 244.69 256.9 249.09 30.21 780.89 Average 24.469 25.69 24.909 3.021 19.52225 Variance 2.48536556 5.71268889 3.20109889 78.6026767 114.056782 Overall Count 20 20 20 20 Sum 487.25 510.46 495.8 33.47 Average 24.3625 25.523 24.79 1.6735 Variance 2.11714605 5.97456947 2.89110526 39.2725187 ANOVA
Source of Variation SS df MS F p-value F-crit Sample 15.138 1 15.138 1.18798196 0.27937146 3.97389699 Columns 8100.14375 3 2700.04792 211.891148 1.209E-35 2.73180701 Interaction 22.24497 3 7.41499 0.58190476 0.62878959 2.73180701 Within 917.46848 72 12.7426178 Overall 9054.9952 79
![Figure 2: CBR-cycle illustrated [10]](https://thumb-eu.123doks.com/thumbv2/5dokorg/4778338.127676/13.892.143.734.345.860/figure-cbr-cycle-illustrated.webp)