ECONOMIC MODELLING OF FLOATING
OFFSHORE WIND POWER
Calculation of Levelized cost of energy
SHAYAN HEIDARI
School of Business, Society and Engineering
Course: Degree Project in Industrial Engineering and Management with Specialization in Energy Engineering
Course code: ERA402
Subject: Industrial Engineering and Management Credits: 30.0 credits
Program: Master of Science in Industrial
Economics
Supervisor: Jan Sandberg Examiner: Jinyue Yan
Customer: Urban Joelsson, Flowocean Date: 2017-06-09
E-mail:
ABSTRACT
Floating offshore wind power is a relatively new technology that enables wind turbines to float above the sea level, tied by anchors at the seabed. The purpose of this work is to develop an economic model for the technology in order to calculate the total cost of a planned wind farm. Cost data are retrieved from reports and academic journals available online. Based on these data, a model in Microsoft Excel is developed which calculates the Levelized cost of energy (LCOE) for floating wind power plants as a function of several input values. As an addition to this model, financing offshore projects are described using literature study and by doing interviews with three major companies, currently investing in offshore wind. As a result, the model allows the user to calculate Capital expenditures, Operating expenditures and LCOE for projects at any given size and at any given site. The current LCOE for a large floating offshore wind farm is indicated to be in the range of 138-147 £/MWh. The outline from interviews was that today there is no shortage of capital for funding wind projects. However, in order to attract capital, the governmental regulatory of that market has to be suitable since it has a crucial impact on price risks of a project.
Keywords: Floating offshore wind, Levelized cost of energy, Financing, Cost structure,
Funding structure, Weighted average capital cost, Capital expenditure, Economic model, Operating expenditure.
PREFACE
This work is written for the degree of Master of Science in industrial economics at Mälardalen University in Västerås, Sweden. The research conducted in this degree project has been under the supervision of Jan Sandberg in the department of Business, Society and Engineering from January to June 2017.
The degree project is at the request of Flowocean, a startup company in floating wind industry. It is of high importance for the company to estimate costs accurately at different stages in its offshore projects and thereby their request for this work. The purpose of the study and research question was formulated together with my supervisor Urban Joelsson, CEO of Flowocean.
I am grateful to employees at Flowocean that were involved in this project. I would like to especially thank my supervisor Urban Joelsson for his supervision and support throughout the work. A special gratitude goes to Jan Sandberg at Mälardalen University for his guidance. And also to Cristoffer Kos at Flowocean for valuable conversations and advice during the project. I would like to thank also all the participants in the interviews who shared valuable information regarding financing of wind projects: Jonas Ekman at Statkraft, Lars Andersen at DONG Energy and Linus Hägg at Arise.
Västerås, May 2017
SUMMARY
The installed capacity of wind power has increased steadily the last decade. Most of the development has been taken place in the onshore wind industry. However, the installed capacity of offshore wind has also increased the last couple of years. The offshore market has so far been dominated by countries with shallow water near coasts and established maritime industries. With increased inaccessibility to locations that are suitable for installation of fixed-bottom offshore, the interest for floating offshore wind has increased. Floating wind power is a relatively new technology that enables the wind turbines to float above the sea level while tied at the seabed with anchors. The main opportunities with floating offshore wind power compared to traditional offshore wind concepts is the eliminating of depth constraint in deep waters, enabling access to areas with strong wind resources, proximity to populated regions near coasts, easing turbine installation offshore and they also have less impact on the environment since only the anchors are installed at the seabed.
There are today only a few floating concepts that have been demonstrated at large scale. This degree project has been written in collaboration with Flowocean. Flowocean is a Swedish-based floating wind startup company with its own technology and is currently planning to launch its first full-scale demonstration plant and further to begin commercial operations globally. It is crucial for Flowocean to estimate costs accurately at various stages in an offshore wind project and thereby they requested this work.
The purpose of this project degree is to develop an improved economic model for the floating wind power industry in order to enable operators in the market to calculate the total cost of a planned floating wind power farm with greater certainty. Cost data are retrieved from reports and academic journals available online. Using these data, an economic model in Microsoft Excel is developed which calculates the Levelized cost of energy (LCOE) for floating wind power plants as a function of different input values regarding technical specifications and site conditions. Further, different parameters of the model are analyzed using sensitivity analyses. As an addition to the LCOE-model, a second part is added. In this part, the financial structures of offshore wind projects are described and studied in more detail by doing three interviews with major companies, currently investing in offshore wind.
The outcome of this work is mainly a LCOE calculator specific for floating wind projects, which is developed in Microsoft Excel and is attached to this degree project as a digital appendix. A series of simulations are performed using the developed model in Excel. Three benchmark farm are designed for comparing the results from the model with different floating concepts. The chosen floating concepts in these simulations are Spar-buoy with drag-embedded anchors,
The most important identified cost drivers in these analyses are turbine capacity, capacity factor, wind farm availability and cost of capital.
In the second part of the degree project, several interviews are done with active players in the industry to get a better understanding of the financing of wind projects. Three interviews are selected to be included in this work. The outline provided by these interviews was that today there is no shortage of capital for funding wind projects, capital can be found for the right price. However, in order to attract capital to a specific project, the governmental regulatory of that market has to be suitable since it has a crucial impact on risks of a project. Price mechanisms such as CfD or Feed-in tariffs are preferred since they provide revenue predictability and ease handling price risks.
It can be discussed whether the model is presenting accurate cost estimations or not. The output of the model contains high level of uncertainty since the underlying data is retrieved from available reports and not based on industry raw data. However, both LCOE values and the cost structure of the projects are acceptable compared with actual investment data and values indicated in other studies. It is also important to mention that the floating wind market is still immature and there are various concepts under development with totally different design. The costs of each design may vary greatly depending on the manufacturing, installation and maintenance procedure. Therefore, to divide all concepts in the market into three main substructures is a rough generalization and the costs should be adjusted accordingly by the user.
As conclusion, it can be claimed that offshore wind is considered to become a competitive renewable energy source in the future. Floating offshore wind is suitable in locations where there is deep water near coastlines, there are decent wind resources and suitable infrastructure. In these areas is floating offshore wind considered to grow and play a substantial role for a sustainable power production in the coming future.
TABLE OF CONTENT
1 INTRODUCTION ...1 1.1 Background ... 1 1.2 Purpose ... 3 1.3 Research questions ... 3 1.4 Delimitation ... 31.5 Contribution to current research ... 4
2 METHODOLOGY ...5
3 LITERATURE STUDY ...6
3.1 From near shore to deeper waters ... 6
3.2 The global market ... 8
3.2.1 Europe ... 8
3.2.2 United States ...10
3.2.3 Japan ...11
3.3 Deep water foundations ...12
3.3.1 Spar-buoy ...13
3.3.2 Tension Leg Platform (TLP) ...14
3.3.3 Semi-submersible ...14
3.3.4 Comparison of concepts ...15
3.4 Cost structure ...17
3.4.1 Wind farm development ...17
3.4.2 Turbines ...18
3.4.3 Substructures ...20
3.4.4 Mooring system ...20
3.4.5 Electrical interconnection ...21
3.4.6 Installation ...23
4 RESULTS ... 37 4.1 Current market ...37 4.2 Economic model ...37 4.2.1 Sensitivity analysis ...41 4.3 Market insight ...46 4.3.1 Funding structure ...46 4.3.2 Risk Profile ...47
4.3.3 Accelerate the funding & trends in the market ...49
4.3.4 Summary of interviews ...51 5 DISCUSSION... 52 5.1 Economic model ...52 5.2 Financing ...53 6 CONCLUSIONS ... 55 7 FURTHER WORK ... 56 REFERENCES ... 57
APPENDIX 1: COST ESTIMATIONS ... 60
APPENDIX 2: INTERVIEW TRANSCRIPTS ... 70
LIST OF FIGURES
Figure 1. Charles F. Brush's 60 foot, 80 000 pound turbine in 1888. ... 1Figure 2. Global annual installed capacity and operating capacity for offshore wind farms 2001-2015. ... 6
Figure 3. Sea depth around Europe. ... 9
Figure 4. Hywind Scotland. ... 10
Figure 5. New England Aqua Ventus ... 11
Figure 6. Fukushima FORWARD ...12
Figure 7. Turbine Spar illustration. ... 13
Figure 10. Development activities. ... 18
Figure 11. Illustration of wind turbine. ...19
Figure 12. Summary of export system parameter study results for floating technology. ... 22
Figure 13. Port-side vs. offshore assembly by typology. ... 23
Figure 14. Vessel requirement during installation for floating wind structures. ... 24
Figure 15. Installation time vs. cost. ... 25
Figure 16. Broad strategic approaches to offshore logistics. ... 26
Figure 17. Illustration of lowest cost O&M strategy as a function of distance from O&M port. ... 27
Figure 18. Market segmentation of major equity investors in 2016. ... 29
Figure 19. UK 20-Year Bond Yield Streaming Chart. ... 34
Figure 20. CAPEX per MW for three different floating concepts. ... 39
Figure 21. Total CAPEX for the 490 MW benchmark wind farms. ... 40
Figure 22. Total annual OPEX for the 490 MW benchmark wind farms. ... 40
Figure 23. LCOE for three different floating concepts. ...41
Figure 24. LCOE as a function of Turbine Capacity... 42
Figure 25. LCOE as a function of Transmission cost. ... 42
Figure 26. LCOE as a function of Distance to O&M port. ... 43
Figure 27. LCOE as a function of Capacity factor. ... 43
Figure 28. LCOE as a function of Wind farm availability. ... 44
Figure 29. LCOE as a function of Beta value. ... 44
Figure 30. LCOE as a function of Debt cost. ... 45
Figur 31. Groups of major international LCOE estimates for offshore wind (2014–2035). ... 53
LIST OF TABLES
Table 1. Offshore wind resource and potential floating wind capacity in Europe, USA, and Japan. Adapted from: "Floating offshore wind: Market and technology review", by: R. James, M. Costa Ros, 2015, Carbon trust. ... 8Table 2. Pros & cons with each substructure type. By: DNV (2012), IRENA (2016) and James & Costa Ros (2015). ...16
Table 3. Offshore Project Risk Categories and Mitigation Strategies. Adapted from: "2014 Cost of Wind Energy Review", by: Moné, Stehly, Maples & Settle, 2015, NREL. .... 31
ABBREVIATIONS
Abbreviation Description
AC Alternating current
AEP Annual energy production
CAPEX Capital Expenditure CfD Contract for difference
DC Direct current
EMRP Expected market risk premium FID Final investment decision
GW Gigawatt
HVAC High-voltage alternating current HVDC High-voltage direct current
JV Joint venture
kV Kilovolt
kW Kilowatt
LCOE Levelized cost of energy
MW Megawatt
MWh Megawatt-hour
O&M Operations and Maintenance
OPEX Operations and Maintenance expenditures
PPA Power purchase agreement
R&D Research and development
RFR Risk-free rate
UK United Kingdom of Great Britain and Northern Ireland USA United States of America
SPV Special Purpose Vehicle
TLP Tension Leg Platform
UJV Unincorporated Joint venture WACC Weighted Average Cost of Capital
1
INTRODUCTION
In this chapter a brief summary of wind power’s history, an outline of the market today and also, the aim of this work is presented and described.
1.1
Background
Ever since the industrial revolution fossil fuels have dominated the energy supply globally, which has resulted in a gradual increase of carbon dioxide emissions. It has been confirmed that the majority of global anthropogenic greenhouse gas emissions are due to the usage of fossil fuels. These emissions are continuing to grow as a result of this, the carbon dioxide concentrations have been estimated by the end of 2010 to have increased to 390 ppm above preindustrial levels. There are several measures available to lower these emissions while still satisfying the demand for energy. Such as energy conservation and efficiency, development of renewable energies, nuclear and carbon capture and storage (CCS) methods (Edenhofer, o.a., 2011).
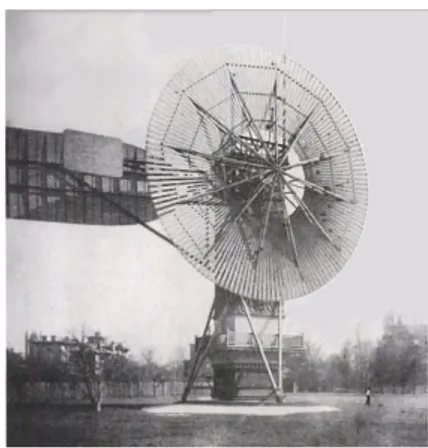
Although the concept of wind power has existed for thousands of years, it was not until 1888 in Ohio, that the first wind turbine to generate electricity was installed. This occurred during the 1880s. In this decade a series of technological inventions emerged, including the development of generator. Thus, wind power can be regarded as one of the early applications of these inventions.
Figure 1. Charles F. Brush's 60 foot, 80 000 pound turbine in 1888. Adapted from "Wind Energy in America: A History", by: Robert W. Righter, 1996, University of Oklahoma Press, page 44.
to the formation of a stable market in Europe and since 1990 the region has been the main scene for major developers in the industry worldwide (Kaldellis & Zafirakis, 2011).
The total cumulative installed wind capacity at the end of year 2015 is estimated to be over 432 GW worldwide (GWEC, 2016). Today, wind turbines are fabricated in several different sizes and styles and are mainly categorized as horizontal or vertical. The power production is affected by a number of factors, such as turbine capacity and height of the turbine, the diameter of the rotors and also the wind speed (IRENA, 2012).
Moving wind power offshore has the advantages of both reaching higher average mean wind speed and ability to build larger turbines with larger swept area and therefore obtain higher electricity outputs. Offshore wind farms are also less constrained by siting issues that are usually applied on land (IRENA, 2012).
The technology for offshore wind power has so far been dominated by fixed-bottom foundations. The growth of offshore wind capacity has been increasing steadily, at the end of 2015 the global cumulative installed offshore wind capacity was over 12 GW (GWEC, 2016). United Kingdom is currently the market leader within the offshore wind power sector with over 5 GW installed capacity (GWEC, 2016). The capacity is expected to reach the remarkable level of 20-55 GW by 2050. Most of the installed capacity for offshore wind power in the UK is currently fixed-bottom structures and are located in shallow water depths (<40m) and close to shore (<30km). Considering the decrease of access to shallow waters near the shores in the future, the fixed-bottom technology for offshore wind power has potential to limit over the long-term in some markets. This creates a need for a new technology that enables projects to move further from shore into deeper waters (James & Costa Ros, 2015).
As a solution to this challenge, several concepts for floating wind power plants have been developed with the potential to utilize deep water sites with fewer complications compared to the traditional fixed-bottom structures. Moving further from shore brings technical challenges regarding power transmission, installation and operation and maintenance activities. The cost for the fixed-bottom foundations assumes also to increase as moving into deeper waters (James & Costa Ros, 2015).
Although its potential, development of floating technology is still in its initial phase and hasn’t been demonstrated at large scale yet. The main challenge for the operators in the market today is to make cost reductions from existing prototypes to commercial models in order to prove the feasibility of the concepts. Subsequently, the technology will attract investment for commercial deployment and this will benefit the industry from the learning factors and economies of scale that will be developed in turn (James & Costa Ros, 2015).
The market today consists of 30+ developers with floating concepts under development. However, only a few concepts have been demonstrated at large scale offshore. (James & Costa Ros, 2015) Flowocean is a Swedish-based floating wind power startup company with its own proprietary technology that has been engaged in R&D activities for almost ten years and is now ready for commercial launch. This degree project has been written in collaboration with
Flowocean. The company has been assisting throughout the work, all necessary knowledge of the processes that the company executes has been shared and described systematically. Flowocean is currently planning to launch its first full-scale demonstration plant and further to commence commercial operations globally. One area of importance for the company’s success is the ability to estimate costs accurately at different stages in its offshore wind power projects and hence their support in this work.
1.2
Purpose
The main purpose of this study is to develop an improved economic model for the floating wind power industry in order to enable actors in the market to calculate the total cost of a planned floating wind power farm with greater certainty. It is of great importance that the developed model is general for all types of floating wind power plants and can easily be used by any company around the world. The model aims to enable suppliers to give better offers to customers, and for developers and investors to evaluate investment risks more accurately. As an addition to this model, financing of offshore wind projects has been studied in more detail. The reason for this is to gain a better understanding of financial structures that occur in offshore projects and also find out which impact cost of capital has on the total cost of a project.
1.3
Research questions
• Is it possible to develop an economic model for calculating LCOE from floating wind power plants at any given wind farm and any given site? How would such a model need to look like?
• What funding structures occur in the offshore market and what trends can be seen regarding financing of projects?
1.4
Delimitation
The created model is designed primarily for floating wind power plants. It will possibly be compared to some extent with fixed-bottom wind power concepts but is developed solely for floating wind power.
that subject requires further information about business strategy, political and other negotiating factors.
1.5
Contribution to current research
Due to the new technology of floating wind power structures, there are not many reports and studies in the field compared with several other energy sources. However, it is an exciting new field and there are many R&D activities going on in this area.
The main goal of this study is to develop a model to calculate total costs of a floating wind power plant. Regarding cost estimations and equations in the floating wind market, mainly two reports were used: Bjerkseter & Ågotnes (2013) and Beiter, et al. (2016). The first mentioned report is a thesis work written by Norwegian students where costs of floating wind farms is estimated based on literature study and market insight. The other report is written by NREL and analyzes cost structures of offshore wind projects in the US using various data sources and industry collaboration.
In the second part of the report, financial aspects of wind projects are analyzed. To understand this field, EWEA (2013) and PricewaterhouseCoopers (2012) were used as main references. The first report is written by EWEA and describes financing of offshore wind projects systematically. The other report is prepared by PricewaterhouseCoopers and describes more profound technical aspects of financing offshore wind projects.
This degree project is a combination of these two fields of study. The developed model is able to take various parameters, including financial parameters as input values and calculate LCOE of a power plant as output. The market is developing rapidly and therefore updated data for cost estimations are strived for during the work.
2
METHODOLOGY
This degree project is mainly based on literature study at the initial phases, the significant factors that affect the total cost of wind power plants according to other studies have been identified and described thoroughly. The literature study is based on available reports, reviews and academic journals published by several organizations and researchers.
Meetings and interviews have been held with Urban Joelsson, CEO of Flowocean in order to identify important cost driving factors and for gaining the necessary base of knowledge in the field of floating wind power.
Cost estimates and functions used in the model were retrieved from existing reports and academic journals. Using these cost estimates, an economic model in Microsoft Excel has been developed. In the model, it is possible to calculate the LCOE for floating wind power plants as a function of different input values regarding technical specifications and site conditions. The exchange used in this work is pound sterling since many of the cost estimations were from British sources and were given in pound. All cost estimations can be found in Appendix 1. The formula used for LCOE calculation is retrieved from PricewaterhouseCoopers (2012) and is the following:
𝐿𝐿𝐿𝐿𝐿𝐿𝐿𝐿 =𝑆𝑆𝑆𝑆𝑆𝑆 𝑜𝑜𝑜𝑜 𝑑𝑑𝑙𝑙𝑑𝑑𝑑𝑑𝑜𝑜𝑆𝑆𝑑𝑑𝑙𝑙𝑙𝑙𝑑𝑑 𝑙𝑙𝑙𝑙𝑜𝑜𝑙𝑙𝑙𝑙𝑙𝑙𝑆𝑆𝑙𝑙 𝑙𝑙𝑙𝑙𝑙𝑙𝑑𝑑𝑙𝑙𝑔𝑔𝑙𝑙𝑑𝑑𝑙𝑙𝑙𝑙𝑒𝑒 𝑜𝑜𝑆𝑆𝑙𝑙𝑜𝑜𝑆𝑆𝑙𝑙 (𝑀𝑀𝑀𝑀ℎ)𝑆𝑆𝑆𝑆𝑆𝑆 𝑜𝑜𝑜𝑜 𝑙𝑙𝑙𝑙𝑜𝑜𝑙𝑙𝑙𝑙𝑙𝑙𝑆𝑆𝑙𝑙 𝑑𝑑𝑙𝑙𝑑𝑑𝑑𝑑𝑜𝑜𝑆𝑆𝑑𝑑𝑙𝑙𝑙𝑙𝑑𝑑 𝑔𝑔𝑙𝑙𝑑𝑑𝑙𝑙𝑔𝑔𝑔𝑔𝑙𝑙𝑙𝑙𝑜𝑜𝑑𝑑 𝑑𝑑𝑜𝑜𝑑𝑑𝑙𝑙𝑑𝑑 (£) Equation 1 – Levelized cost of energy
Where generation cost includes all CAPEX and OPEX that occur over the lifecycle of the project which is 20 years in this case. CAPEX includes more specifically the cost for project development, turbine, substructure, mooring system, electrical infrastructure, installation, insurance and contingency. Revenue from salvage value and decommissioning costs are neglected in this work. Electricity output is the net metered output at the offshore substation after all losses. All components of the formula will be described throughout the work.
Further, different parameters of the model have been analyzed using sensitivity analyses. Based on these analyses, key cost drivers of a wind project are identified and described in more detail.
As an addition to the LCOE-model, a second part was added to the work. In this part, the financial structures of offshore wind projects are described and studied in more detail by doing
3
LITERATURE STUDY
A brief description of the floating wind power market is included in this part of the report, followed by a breakdown of cost structure of floating wind projects.
3.1
From near shore to deeper waters
Due to supportive energy policies, technology advancements and related cost reductions the annual installed capacity of wind power has increased steadily during the last decade. Wind energy is predicted to play a major role in global electricity supply as well as reduction of greenhouse gas emissions in the future. Most of this development in the industry has taken place in the onshore wind industry. However, the installed capacity of offshore wind power has also increased in recent years, mostly in Europe (Wiser, o.a., 2016).
At Horns Rev off the coast of Denmark, the first utility-scale offshore wind farm was grid-connected in year 2002. Since that year till the end of 2015, the global capacity of offshore wind energy has increased from 0,26 GW to 12,7 GW, which can be seen in the figure below (IRENA, 2016).
Figure 2. Global annual installed capacity and operating capacity for offshore wind farms, 2001-2015. Adapted from: "Innovation Outlook: Offshore Wind", International Renewable Energy
Agency, 2016, Abu Dhabi.
The increased interest in offshore wind energy is due to the advantages associated with this renewable energy source. Compared to onshore wind power, offshore installations can access greater and steadier wind resources. In populated areas, it has less social impact than onshore wind power, regarding operating noise and visual burden. Another advantage with offshore wind power is the possibility to utilize many of the technologies which already have been used by the onshore wind industry for decades (IRENA, 2016).
manufacturers have developed special turbines for the offshore market with higher rated power and more suitable for the harsh conditions out at sea. The supply chain has also undergone improvements, the installation methods have become more sophisticated and the offshore installation vessels are more efficient. Specialized wind turbine components that were costly in the early stages of the market are now replaced by more affordable standard components, which are produced in greater numbers thus utilizing economics of scale (IRENA, 2016).
So far, the market has been dominated by countries with shallow coasts, water depths of less than 50 meters, and with established maritime industries, such as oil and gas. With increasing inaccessibility to suitable places for installation of fixed-bottom foundations and growing pressure on countries to decarbonize their energy portfolios, the interest for floating offshore wind is increasing (James & Costa Ros, 2015).
3.2
The global market
Development of floating foundations opens up a whole new market with vast opportunities in deep waters offshore. The main opportunities with floating concepts are firstly the eliminating of the depth constraint of existing fixed-bottom foundations. They enable access to areas with strong wind resources and proximity to populated regions. Another opportunity is easing turbine installations in deep waters and offering a lower cost alternative compared to fixed-bottom foundations. Also, they offer environmental benefits since the installation has less impact on the seabed compared with fixed-bottom designs (IRENA, 2016).
Considering these advantages, the appetite for growth of floating wind power is high in several countries that have limited places with shallow waters for installing fixed-bottom foundations. The potential is especially high in Japan, several European countries and the United States.
3.2.1
Europe
Europe is the biggest global market for offshore wind energy. More than 91% of all offshore installations were located in European countries at the end of 2015 (GWEC, 2016).
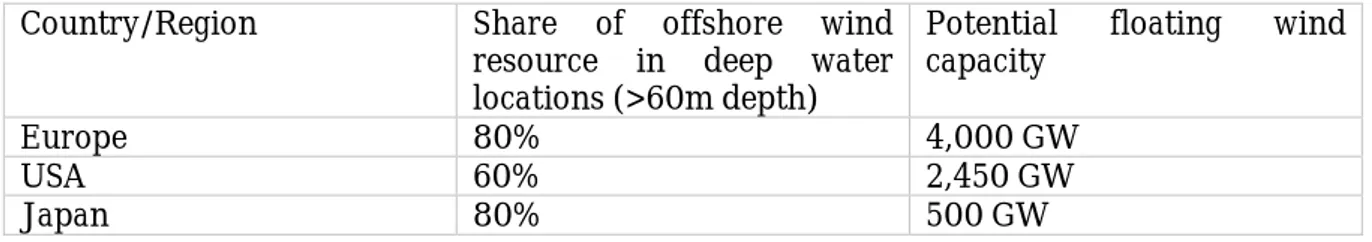
The potential for further development of floating wind power in Europe is vast. Based on the table and figure on the next page, the North Sea and the Atlantic coastline is suitable for floating wind installation since the waters are deep, while the wind resources are high and suitable for floating wind power concepts.
Table 1. Offshore wind resource and potential floating wind capacity in Europe, USA, and Japan. Adapted from: "Floating offshore wind: Market and technology review", by: R. James, M. Costa Ros,
2015, Carbon trust.
Country/Region Share of offshore wind
resource in deep water locations (>60m depth)
Potential floating wind capacity
Europe 80% 4,000 GW
USA 60% 2,450 GW
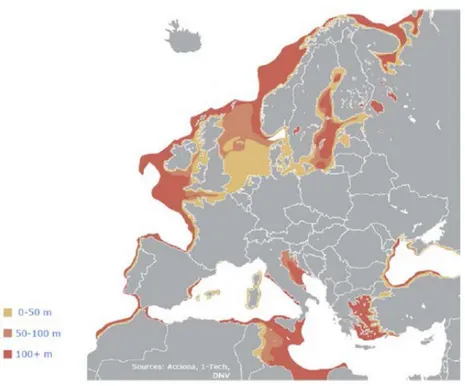
Figure 3. Sea depth around Europe. Adapted from: "Floating wind technology: future development", by: Johan Slätte, 2014, DNV GL.
Today is the UK the world leading country with over 5 GW installed offshore capacity (WindEurope, 2017). The country possesses great potential in the North Sea with huge wind resources in deep waters. The highest wind speeds are in Scottish waters and off the southwest coast of the UK where deep-water areas are plenty (James & Costa Ros, 2015).
The UK can position themselves as the market leader in the floating wind power technology as they are in the offshore industry today. The operators possess great experience earlier from the oil & gas, maritime and offshore industry, together with governmental incentives and support frameworks the potential for success is vast (DNV, 2012).
According to EWEA (2013), the depths of the North Sea varies between 50 m and 220 m. For instance, deploying 6 MW wind turbines in this area could generate today’s EU electricity demand four times over. In the Atlantic and the Mediterranean, the potential is even greater. Portugal with a vast maritime area, together with France and Spain, have deep waters close to shore in Atlantic Seas. Therefore, a big potential for offshore wind power exists in these areas. By far, the UK has the greatest experience of offshore wind industry in the world, but the technology is still immature and the race is ongoing with numerous European countries trying to take the lead in the European market.
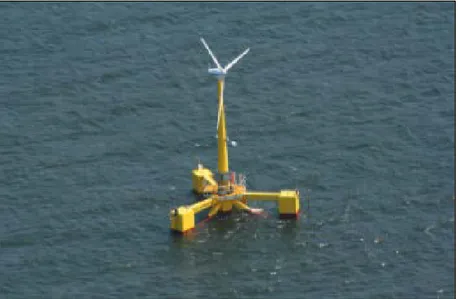
coast of Norway. A few years later in 2015, the company made the decision to build the world’s first floating wind farm in Aberdeenshire in Scotland. The park will cover 4 square kilometers at water depths of 95-120 meters. The distance to shore is 25 km and the wind speed estimates to be around 10 meters per second. The 30 MW wind farm planned to be in production from late 2017, this will mark a step forward for offshore wind technology (Statoil, 2015).
Figure 4. Hywind Scotland. Adapted from: " Statoil to build the world’s first floating wind farm: Hywind Scotland", by: Statoil, 2015.
WindFloat by Principle Power is also one of the more mature floating concepts being developed in the industry. The company installed a 2 MW prototype, 5 km off the coast of Aguçadoura in Portugal in 2011. The system has produced 16 GWh of electricity and was decommissioned in 2016 after completing all of its project objectives. Principle Power has now multiple follow-up projects that are under development for pre-commercializing WindFloat units. Including, a 25 MW wind farm located in Viana do Castelo in Portugal, a 24 MW project in Leucate in France and a smaller 6 MW project in Japan (Principle Power, 2017).
Another challenger worth mentioning is the French company Ideol. They have a concept under construction called Floatgen that will be commissioned in late 2017 off the coast of Le Coisic in France. The capacity of the turbine will be 2 MW and the depth of the unit 33 meters. The project will evaluate the performance of the solution under real conditions and offer a start point for serial production. The company is planning further to develop a 24 MW wind farm off the coast of Gruissan in France in the next coming years (Ideol, 2017).
3.2.2
United States
Even though the offshore wind market is not as mature in the US at it is in Europe, the potential is big for further development of floating technology in this market. It is estimated that the technical wind resource potential along the coastline and the Great Lake waters exceed 4000 GW. There are huge opportunities in these areas since 60 % of the offshore sites available in this area are in deep waters (>60m). Floating wind power is the only realistic solution at many locations in the US (DNV, 2012).
More than 80 % of the US electricity demand exist in coastal states, therefore offshore wind can make a big impact on the clean energy mix goal of the country. The National Offshore Wind Strategy has set a target goal of 54 GW of offshore capacity in the US to be developed by 2030 with a cost of £0,05/kWh (Mast, Rawlinson, & Sixtensson, 2015).
Current projects in US
At this point, most research & development activities in the US are occurring at the University of Maine. So far, DeepCwind Consortium Research Program have developed VolturnUS floating concrete structure which can support wind turbines in depth of 45 meters or more. A 6 MW prototype of this concept was built in 2013 in a 1/8 scale and became the first grid-connected floating wind turbine in the US. Maine Aqua Ventus is now leading a project called New England Aqua Ventus which plans to develop two 6 MW VolturnUS units on Monhegan Island. The project has been selected by the US Department of Energy to receive £25.9 million in construction funding. The deployment of the project is planned for 2019 and will probably be the first full-scale floating wind project in the US (The University of Maine, 2017).
Figure 5. New England Aqua Ventus, Adapted from: "Maine Aqua Ventus", the image is fully credited to the University of Maine. Retrieved from: http://maineaquaventus.com/
Another exciting project in the US is the planning of an 816 MW wind farm in Hawaiian waters. Alpha Wind Energy, a Danish company plans to install 102 units of Principle Power’s Windfloat foundations in water depths of nearly 1000 meters. The project is currently going through lease acquisition process (Tsanova, 2015).
Another advantage for the Japanese is their great experience in offshore floating structures from other markets such as shipbuilding industry. Together with consistent emphasis on R&D and a long-lived culture of mass production, it is one of the most suitable markets for commercialization of this technology (DNV, 2012).
Since the Fukushima nuclear disaster in 2011, Japan has closed most of its nuclear reactors. This has led to a lot of spending on imported liquid natural gas to replace the lost power generation from nuclear. Therefore, the focus on alternative solutions in energy generation, such as floating wind power, has increased in recent years (Nilsson & Westin, 2014).
The increased price of electricity has created a political agenda towards renewable energy sources in Japan. Since March 2014 an offshore wind feed-in-tariff of approximately 252 pound/MWh has been introduced in Japan. The purpose of the tariff is to support the development of offshore wind in Japan and support easier project financing (Mast, Rawlinson, & Sixtensson, 2015).
Current projects in Japan
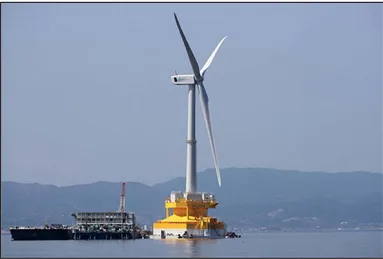
The Japanese Government has a long-term goal to install up to 1 GW of offshore floating wind capacity. To reach this goal a R&D approach is under process called Fukushima FORWARD. The project is divided into two phases. The first phase is headed by Marubeni Corporation and resulted 2013 in installing one 2 MW turbine on a four-column foundation together with the world’s first floating substation. The second phase of the project consists of installing two floating platforms, carrying a Mitsubishi 7 MW turbine and a 5 MW Hitachi turbine. The project has become a hub for research in floating wind power technology and places Japan at the forefront in this field (James & Costa Ros, 2015).
Figure 6. Fukushima FORWARD, Adapted from: http://www.fukushima-forward.jp/english/photo/index.html
3.3
Deep water foundations
proven in tough operating environments earlier. However, they tend to require adaptation to wind power to accommodate different dynamic characteristics and a different loading pattern (IRENA, 2016).
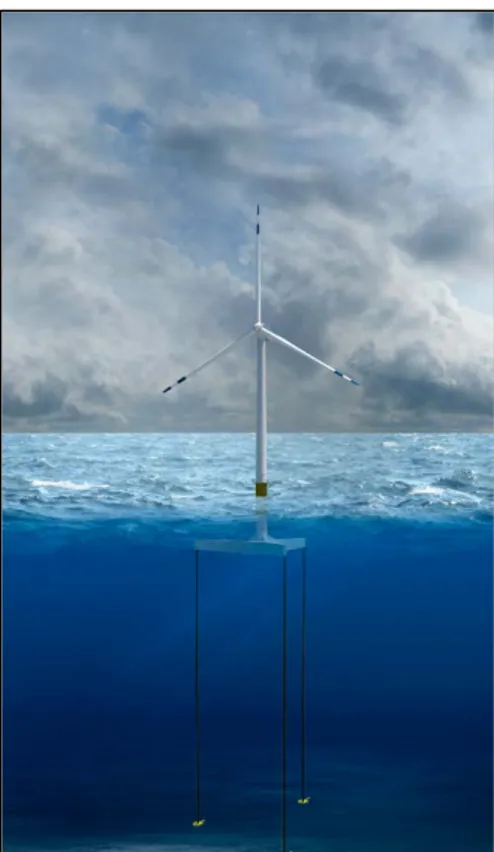
According to Mast, Rawlinson, & Sixtensson (2015), there are basically three stability philosophies in the market which floating structures can be classified within: ballast (Spar-buoy), mooring (TLP) and buoyancy (Semi-submersible).
3.3.1
Spar-buoy
In these structures, an enormous cylindrical buoy is used which stabilizes the turbine by using ballast. The lower parts of the foundation are heavy while the upper parts are usually empty, near the surface. In this way, the center of gravity is lower in the water than the center of buoyancy (EWEA, 2013).
Spar-buoys are created based on this principle. Due to simple structure design, the spar-buoys are easy to construct and provides good stability in the water. However, the large structure creates logistical challenges during the process of assembly, transport and installation. The design can also have the constraint to be deployed in waters of at least with 100 m depth. The most mature concept in the spar-buoy category is Statoil’s Hywind foundation. The development of the concept started in 2001 and has so far commissioned a 2 MW prototype and planning to soon deploy the world’s first floating wind farm (Mast, Rawlinson, & Sixtensson, 2015).
3.3.2
Tension Leg Platform (TLP)
In these concepts, by using tensioned mooring lines stability is achieved. TLP concepts are submerged structures that pulls the foundation up above water surface, while the mooring lines pull the structure down toward the sea bed. The tension of mooring lines is of great importance in these concepts since a failure will eventually lead to tipping of the whole structure (Nilsson & Westin, 2014).
GICON SOF with origins from Germany, is the only operator in the market with a full scale TLP demonstration so far. It demonstrated a 2.3 MW turbine in Germany in 2016 (IRENA, 2016).
Figure 8. Turbine TLP illustration, by: Josh Bauer, 2013, NREL.
3.3.3
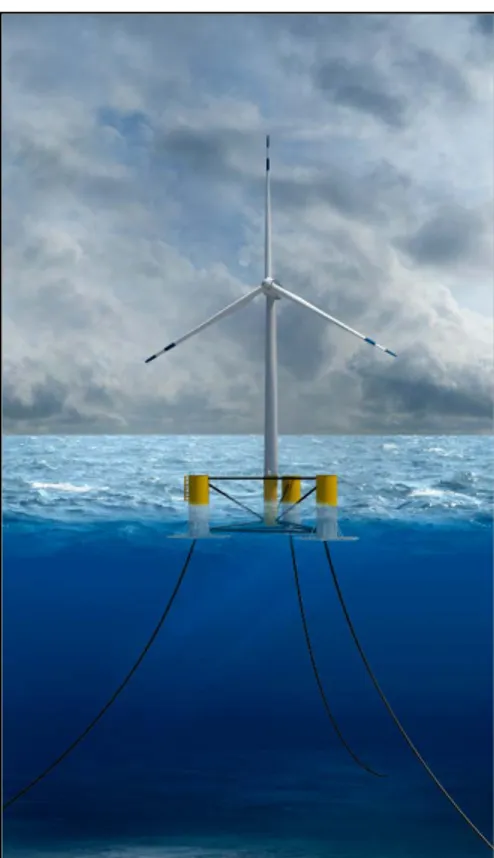
Semi-submersible
Stability in these structures is achieved by distributed buoyancy. It is a combination of the two previous designs. These foundations consist typically by several columns linked to each other that provides ballast and flotation stability. The structure is tied with mooring lines to keep the structure in position. These foundations are suitable in different site conditions since the draft is low and constraints regarding soil conditions are few (DNV, 2012).
WindFloat developed by Principle Power is the most mature semi-submersible concept in the market. The structure is built of three columns with a single turbine mounted on one of these. It has an active ballast system meaning that water is pumped between columns in order to keep the platform upright when the wind direction changes (Mast, Rawlinson, & Sixtensson, 2015).
The company has so far commissioned a 2 MW prototype in Aguçadoura, Portugal. Larger projects are currently under development, including in Portugal, France and Japan (Principle Power, 2017).
Figure 9. Turbine Semi illustration, by: Josh Bauer, 2013, NREL.
3.3.4
Comparison of concepts
Currently, there is no clear winning concept in the floating wind industry. Each concept has its own strengths and weaknesses due to different conditions at a specific site.
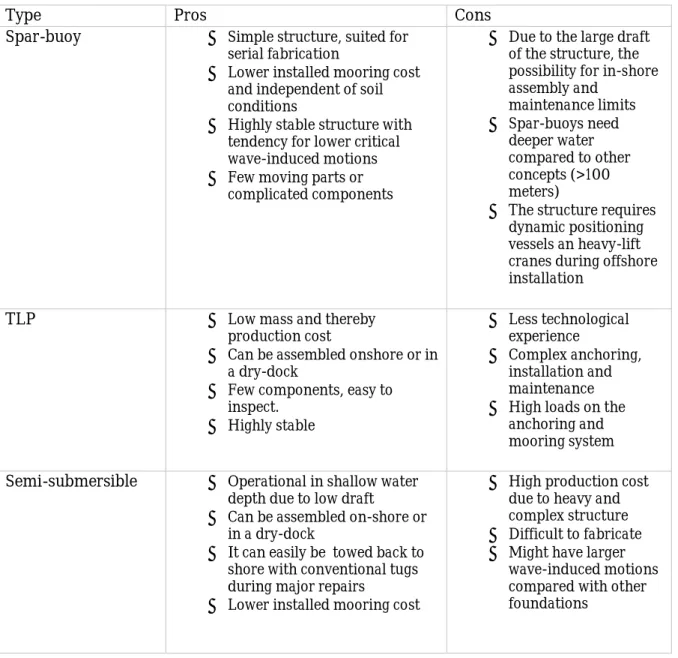
The table on the next page summarizes strengths and weaknesses of each structure type. The statements are according to DNV (2012), IRENA (2016) and James & Costa Ros (2015).
Table 2. Pros & cons with each substructure type. By: DNV (2012), IRENA (2016) and James & Costa Ros (2015).
Type Pros Cons
Spar-buoy • Simple structure, suited for serial fabrication
• Lower installed mooring cost and independent of soil conditions
• Highly stable structure with tendency for lower critical wave-induced motions • Few moving parts or
complicated components
• Due to the large draft of the structure, the possibility for in-shore assembly and maintenance limits • Spar-buoys need deeper water compared to other concepts (>100 meters)
• The structure requires dynamic positioning vessels an heavy-lift cranes during offshore installation
TLP • Low mass and thereby
production cost
• Can be assembled onshore or in a dry-dock
• Few components, easy to inspect. • Highly stable • Less technological experience • Complex anchoring, installation and maintenance • High loads on the
anchoring and mooring system Semi-submersible • Operational in shallow water
depth due to low draft
• Can be assembled on-shore or in a dry-dock
• It can easily be towed back to shore with conventional tugs during major repairs
• Lower installed mooring cost
• High production cost due to heavy and complex structure • Difficult to fabricate • Might have larger
wave-induced motions compared with other foundations
3.4
Cost structure
In this chapter, the cost structure for an offshore floating wind farm is broken down into different cost categories. Each category is in turn described regarding the development in the market today, and which cost reduction possibilities may be considered in the future.
3.4.1
Wind farm development
The costs included in this category considers the development costs of a project, which are activities prior to construction and acquisition of components to be included in the wind farm. They cover the processes from the start of a project until the final investment decision (FID). The development of a project can take years before the commissioning of the wind farm. It usually starts 7 to 10 years before the year of first turbine installation (IRENA, 2016).
During these years, many tasks should be conducted to prove the feasibility of the project. The development cost is not the biggest cost item in a wind farm project. However, greater investment in this field will be beneficial and enable cost savings later in the project. According to FOWIND (2016), the development costs can be derived into four main categories: Site surveys, consent and planning, design and engineering and commercial and legal work. Site surveys are required to understand the conditions of both offshore and onshore sites nearby the wind farm. Hence, contractors need operating experience from both areas. In this stage, trained personnel such as engineers, surveyors and geophysicists are essential. Also, capital equipment such as vessels are crucial during the operation of surveys (FOWIND, 2016). Next category in the development process is the approval of the project. To acquire consent, an environmental impact assessment is required, which covers both human and natural receptors. However, the planning process is special for each country and depends on where the wind farm is planning to be developed (FOWIND, 2016).
Design and engineering tasks are required in order to develop a floating wind farm project. Typically, developers perform these tasks in-house since they’re unique for each wind turbine concept and cannot be implemented from other projects. The number of tasks in this category are vast (see figure 10), and it can be helpful to contract an Owner’s engineer for assistance of engineering and commercial tasks (FOWIND, 2016).
Large-scale wind farm projects often require a substantial amount of legal and commercial work since the final decision involves large size capital investments and many stakeholders are involved. The developer manages typically these processes in-house, while legal firms support all steps of the process (FOWIND, 2016).
3.4.2
Turbines
During the recent years, specific designs of offshore wind turbines have emerged. These turbines are bigger than the one used for onshore. They are also improved regarding to reliability and durability in maritime harsh environments. In 2016, the five major turbine manufacturer globally were Siemens, followed by MHI Vestas, Senvion, ALSTOM and Areva Gamesa (FOWIND, 2016).
Figure 10. Development activities. Adapted from "Supply Chain, Port infrastructure and Logistics Study", by: FOWIND, 2016.
Some components of a turbine are shown in the figure below. The total cost of a wind turbine includes three major parts; Rotor, Nacelle and Tower.
Figure 11. Illustration of wind turbine, by: Josh Bauer, 2013, NREL. Rotor
The rotor includes the blades, a cast iron hub, auxiliary systems, blade bearings and a weatherproof hub cover. The blades are usually manufactured by using glass fiber in full-length molds. By the end of 2015, all commercial deployed wind turbines were of three-blade upwind configurations. The largest rotors had 75 meters long blades (IRENA, 2016).
Nacelle
The components included in the nacelle are the drivetrain, the power take-off system, the auxiliary systems as well as control and monitoring systems. They are located inside the weatherproof cover. Three different concepts of drivetrains exist in commercial offshore turbines:
Tower
Wind turbine towers are steel tubes made in two or three parts which are bolted together. Internal ladders, personnel lift and sometimes power electronics and step-up AC transformer are included in towers. Offshore towers are very similar to those used in onshore turbines regarding both design and manufacturing (IRENA, 2016).
3.4.3
Substructures
So far, only a handful of prototype projects in the floating wind market have been deployed and hence there is a lack of data and information about production time and total costs of these substructures. If the floating wind market progresses from prototype stage to further commercial stages, it is obvious that the large scale production costs will decrease due to economics of scale and automation.
The substructure is the innovative solution of each company and distinguishes them from competitors. Currently, Statoil and Principle Power are the companies that have developed their concepts furthest and are leading the market. However, the race is still ongoing and any company with the best substructure as solution regarding costs and simplicity is able to take the lead in the future.
In chapter 3.3, the three dominant floating wind structures are described in detail. These are semi-submersible platform, spar-buoy and tension leg platform.
3.4.4
Mooring system
With floating wind structures, a mooring system is attached to keep the structure in a fixed position at a specific location. It consists of moorings and a set of anchors.
Moorings
There exist several different mooring configurations but the most used configuration are catenary and taut-leg mooring systems. Catenary configurations are usually used with semi-submersible and spar-buoy concepts and taut-leg configurations with TLP concepts.
The main difference between these configurations is the loading at anchoring point, as it can be seen in the figures. The catenary system has horizontal loading with the lower part of the chain rests on the seabed and taut-leg with a vertical loading. This leads to limited horizontal movement and creates excellent stability for the taut-leg system but some degree of horizontal movement for the catenary (James & Costa Ros, 2015).
The restoring forces for the taut-leg system are generated by elasticity of the mooring lines that are attached to the substructure and can withstand both horizontal and vertical loads. The catenary system however, generates most of the restoring forces horizontally through the
weight of the mooring lines. Therefore, a large mass or a buoyancy element should be attached to the system to create vertical forces (Bjerkseter & Ågotnes, 2013).
An advantage with the catenary system is the simple installation procedure compared with the challenging installation of taut-leg systems. The disadvantage however, is the disruption of seafloor compared with taut-leg systems since the lower part of the catenary chains rests on the seabed and results in a large footprint (James & Costa Ros, 2015).
Anchors
There exist several different anchor solutions in the market for floating wind turbines. The choice of anchors is dependent on seabed conditions, the mooring configuration and the holding capacity that is required for the substructure. The four most common anchor types are drag-embedded, driven pile, suction pile and gravity anchor. These are all proven concepts and been used in the marine and oil & gas markets previously.
Drag-embedded anchors are used often with the catenary mooring configurations to handle the horizontal loadings on the mooring chains. The taut-leg mooring configurations however, often use the three other anchor types to cope with the vertical loadings. (James & Costa Ros, 2015)
The most widely used anchors are the drag-embedded, together with catenary mooring configurations. These are mostly used in soft soils, in harder soil conditions they are harder to penetrate. Therefore, gravity and driven pile anchors are being used more in soft soil conditions. In general, the installation process for drag-embedded and suctions piles anchors is less complicated than the other two and are also easier to remove after decommissioning.
3.4.5
Electrical interconnection
This chapter describes the electrical infrastructure in floating wind farms that connect the farm to the onshore electrical grid. The offshore electrical interconnection usually consists of: array cables, offshore substation and subsea export cables (IRENA, 2016).
Array cables
Array cables in a wind farm collect the power from strings of wind turbines and connect them further to an offshore substation. These cables usually consist of three-phase power conductors of either copper or aluminum. They are designed to function in hostile environments and therefore need to meet strength and temperature requirements necessary (IRENA, 2016).
hand, the capital expenditure as well as operational expenditure will increase (Bjerkseter & Ågotnes, 2013).
Offshore substation
Offshore substations are used to reduce electrical losses by increasing the voltage before the power is exported to shore from the wind farm. The voltage of array cable strings steps up to 220 kV for AC and to between 320 and 800 kV for DC export cables from substation to the shore. Typically, two or more AC offshore substations are installed at larger wind farms to decrease the impact of a single point of failure. It is also possible to use a single substation with two or more transformers (IRENA, 2016).
In smaller projects, there is no need for an offshore substation due to high costs. If the capacity of the wind farm is 100 MW or less or the distance is less than 15 km to shore or if the voltage at the collection point is the same as the grid voltage, then offshore substation can be avoided (Douglas-Westwood, 2010).
Export cables
The export cables connect the wind farm to the onshore electrical grid. These cables can either be AC or DC depending on voltage type and level. AC export cables consists of three phase conductors and are rated up to 220 kV. DC export cables on the other hand are usually two single-core conductors and are rated up to 400 kV (IRENA, 2016).
HVAC cables are usually limited to 150 km offshore due to reactive power flow. For that reason, HVDC is used for longer distance transmissions with less losses but with the disadvantage of higher price tag (The Crown Estate, 2010).
The figure below presents an analysis by (Beiter, et al., 2016). The graph demonstrates the total cost of the electric export system as function of site to cable landfall. It is apparent the HVDC transmission is preferred for longer transmission distances, over 100 km.
Figure 12. Summary of export system parameter study results for floating technology. Adapted from: "A Spatial-Economic CostReduction Pathway Analysis for U.S. Offshore Wind Energy
Onshore substation
To increase the power from the export cables to the transmission voltage and connect the wind farm to the onshore transmission network an onshore substation is needed. Onshore substation will likewise convert the power from the export cables to three phase AC if it is delivered by HVDC cables. The onshore substations are almost identical to substations that are being used for power generation with other technologies and the costs are estimated to be approximately half of costs for the offshore bottom-fixed substations (The Crown Estate, 2010).
3.4.6
Installation
The installation process of floating wind structures is rather different compared with conventional bottom-fixed concepts. Therefore, existing literature study regarding installation processes are not useful in the floating market.
The biggest advantage of floating wind turbines over fixed-bottom concepts is that the need for operational handling at sea is dramatically reduced, which eases the process regarding weather window and requirements for expensive installation vessels. Therefore, it is desirable for every concept to maximize the number of operations onshore or at the portside. As it is apparent from the figure below, many concepts today are possible to be assembled onshore and later towed to the installation point. However, moorings, anchors and electric cables are usually still assembled offshore (James & Costa Ros, 2015).
Figure 13. Port-side vs. offshore assembly by typology. Adapted from: "Floating offshore wind: Market and technology review", by: R. James, M. Costa Ros, 2015, Carbon trust
Another major benefit with floating wind concepts is that there is no need for large jack-up and dynamic positioning installation vessels. These can cost approximately 150 000 £ per day, compared with the tug boats that are used by floating concepts which are ca 80 % cheaper at
requires also barges for transportation of the foundation to the installation site (James & Costa Ros, 2015).
Figure 14. Vessel requirement during installation for floating wind structures. Adapted from: "Floating offshore wind: Market and technology review", by: R. James, M. Costa Ros, 2015, Carbon
trust.
Installation time of a wind turbine is dependent on the number of offshore operations, level of met-ocean limitation that is constrained by the significant wave and the complexity of the installation process. Installation time is a key cost driver in wind projects and it will have a crucial role in future from prototype of concepts to commercial stages of concepts. Based on analysis from James & Costa Ros (2015), the installation time will be halved from prototype to commercial production as the processes are optimized.
According to James & Costa Ros (2015), the most important cost drivers for installation is time consumed and vessels types to be used. As it is apparent from the figure 15, the installation costs for spar-buoy concepts are higher relative to other concepts because of hiring expensive heavy life crane vessels for assembly of turbines. On the other hand, the installation time of TLP concepts are rather higher than the other two due to complex installation process.
Figure 15. Installation time vs. cost. Adapted from: "Floating offshore wind: Market and technology review", by: R. James & M. Costa Ros, 2015, Carbon trust.
3.4.7
Operation and Maintenance
Operation and maintenance expenditures cover all the costs that occurs throughout the life of the turbine, nominally 20 years. These costs account for approximately one quarter of the total cost of a wind project during its lifetime. Activities that contribute to management of the asset are included in the operations category. Activities included in this category are for instance remote monitoring of the plant, marketing, sales, administration and other back office tasks. These activities stand for a small share of the total O&M expenditure. The largest proportion of the costs are included in the maintenance activities. These are the up-keep and repair activities of the plant. In turn, these activities are divided into preventive maintenance and corrective maintenance. Proactive repair or replacement of various components of the wind turbine based on routine inspections or as a response from condition monitoring systems are expressed as preventative maintenance. Corrective maintenance on the other hand, includes reactive repair of failed or damaged components in the plant (GL Garrad Hassan, 2013). The costs associated with proactive activities can be determined with small uncertainties, since these efforts can be planned. However, costs related to reactive activities are much more difficult to predict and therefore the uncertainties are much larger. Considering this, it is wise to perform proactive maintenance activities on other components of the plant every time a bigger maintenance operation is executed on a wind turbine (Bjerkseter & Ågotnes, 2013). There exist three kind of different contracts for wind farm owners to choose from in order to manage operation and maintenance activities. These are hand-off, light-touch and hands-on.
vessel operators. In this way, the owner of the farm attempt to take on more risk but has opportunity to minimize the costs and maximize the energy production (IRENA, 2016). There are many strategies to transport technicians from land to the offshore wind turbine. Every wind turbine project has different site characteristics and thereby the optimal strategy differs for every project. According to GL Garrad Hassan (2013), the main factors that determine the optimal logistics solution are:
• Distance from onshore facilities • Average sea state
• Number, size and reliability of turbines • Offshore substation design
The distance from shore is the primary factor in determining the most cost-effective approach for O&M activities. As sites are being developed further from shore, especially with the floating wind concepts, new strategies are shaping that are suitable for offshore wind sites far away. They are presented in figure 16. The typical logistic solution in the offshore wind market is currently with conventional workboats and less well-established helicopter services. Workboats are cheaper and can carry many technicians from shore to the turbine. However, the response time and accessibility of these services are limited by the sea condition and response times. Helicopters on the other hand, are more expensive and do not have the possibility to carry many passengers. But these can respond quickly and are less dependent on the sea condition (GL Garrad Hassan, 2013).
Figure 16. Broad strategic approaches to offshore logistics. Adapted from: "A Guide to UK Offshore Wind Operations and Maintenance. by: GL Garrad Hassan, 2013, Scottish Enterprise and The
Crown Estate.
In the case of floating wind turbines, they are usually placed much further from shore compared to fixed-bottom turbines. If the transit distances become so great to access the turbines the operations will require to be based offshore. The base can be either fixed accommodation modules or boats such as motherships, offshore support vessels or jack-ups. As it is apparent from figure 17, the transition point from the support of only workboats and helicopter to offshore bases appears at approximately 74 km (GL Garrad Hassan, 2013).
Figure 17. Illustration of lowest cost O&M strategy as a function of distance from O&M port. Adapted from: "A Guide to UK Offshore Wind Operations and Maintenance. by: GL Garrad Hassan, 2013,
Scottish Enterprise and The Crown Estate.
An advantage with most of floating wind structures is that in the case of major repairs, the structure can be towed back to shore for portside repairs using only inexpensive tug boats and barges. This is a huge benefit, compared with fixed-bottom offshore wind turbines that require large and expensive heavy lift vessels. However, this benefit differs for each floating concept due to sea conditions and limitation that exists. Spar buoys still require heavy lift vessels due to its large structure. Semi-submersible concepts can be towed back to shore and usually have bigger tolerance in harsh sea condition. While TLP concepts are more sensitive to this and require costly bespoke barges (James & Costa Ros, 2015).
3.4.8
Financial factors
Due to complexity and immaturity of offshore wind projects, many of these have earlier resulted in running over the budget. To prevent this from happening, some financial factors are introduced.
Contingency
Many risks involved in offshore wind projects are difficult to identify and manage appropriately, such as seabed condition risks, design risks and delays. It is acceptable to ensure that all risks in a project are not covered by the developer. However, to prevent cost overruns in projects, developers have to include a contingency in financial evaluations. Contingency is
Insurance
Although insurance has a small share of total costs of a wind power project, it has a crucial role in supporting the investment by providing protection against unwanted events such as delays and physical damage during assembly, transport, construction and running stages of a project (PricewaterhouseCoopers, 2012).
In this degree project, insurance costs are divided into two groups, insurance during construction and operating phase insurance. There are several different types of insurances existing in the market with diverse risk premium based on the scope of the insurance. For construction phase, there are Construction All Risks (CAR), Delays in startup (DSU) and Third party liability. Moreover, for operating phase, there are Operating all Risks, Machinery Breakdown, Business Interruption and Third party liability (PricewaterhouseCoopers, 2012). In the model developed for this work, a general insurance type has been chosen rather than a specific one. The cost calculations can be found in Appendix 1.
3.4.9
Decommissioning
Various activities that are related to decommissioning and removal of wind farm components are included in this category. Usually all components except cables are transported back to shore and are delivered as scrap metal (Bjerkseter & Ågotnes, 2013).
Floating wind concepts entail benefits regarding decommissioning of wind turbines and are simpler compared with fixed-bottom concepts that require specialized vessels and equipment. For floating structures, the full structure can be towed back to shore as soon as moorings are cut from the anchors (James & Costa Ros, 2015).
This offers cost savings to developers and in some cases it can even generate revenue at the end of a project. According to Bjerkseter (2013), the return value from scrap metal of the components will in most cases with floating wind concepts exceed the costs for removing and disassembly.
This is of course dependent on the distance from shore, the complexity of decommissioning and the scrap metal prices, but as a rough estimate it can be stated that decommissioning is cost-neutral and therefore is not included in the calculations of this work.
3.5
Financing wind projects
The costs of offshore wind projects depend significantly on the technology used and the site chosen, which has been described in the previous chapters. However, the sources of capital for floating and fixed-bottom projects are estimated to be similar. In this chapter, financing of wind projects is described based on current fixed-bottom offshore wind projects that have been developed recent years.
The offshore industry is continuing to grow strongly. The total investment value of offshore projects in Europe year 2016 was € 22.6 billion, which is an increase of 39 % compared with the year before (WindEurope, 2017).
Historically in the offshore industry, power producers have been the main investors by using their balance sheets. Regarding to figure 18, power producers in 2016 represented approximately 67 % of the total equity investor share of the market. However, as the market matures, new investors are entering the market and becoming active in different stages of financing the offshore wind projects. These entrants are for instance financial, corporate and institutional investors (WindEurope, 2017).
Figure 18. Market segmentation of major equity investors in 2016. Adapted from: "The European offshore wind industry”, by: WindEurope, 2017.
Funding structure 67% 10% 13% 4% 6% Power Producers
Diversified Financial Services Institutional Investors Policy Driven Lenders Corporates
Sponsor equity
These funding structures are often called as “on balance sheet” and funded by a single company. A project sponsor in these cases has full ownership of a wind project, which has the benefit of simplicity and full control of the project. This funding structure is typical for large power producers that have the balance sheet strength to afford the required investment. This model was characteristic in the early stages of offshore wind development (EWEA, 2013).
SPV
Special Purpose Vehicle or Incorporated joint ventures are traditionally held on the balance sheet as an investment under the relevant accounting rules or are joined as a subsidiary into the accounts of the shareholder’s group. Tax losses cannot be transferred to the shareholder’s group, unlike unincorporated joint ventures. One example of this kind of funding structure is Scara, a JV company by Statoil and Statkraft that operates Sheringham Shoal in the UK (EWEA, 2013).
SPV with debt finance
This funding structure counts on future cash flows generated by the project for repayment. Project’s assets, rights and interest are held as secondary security or collateral. When the lenders are repaid just from the cash flow or in the case of project failure, from the value of sold assets, this funding structure is usually called “off balance sheet” and non-recourse (EWEA, 2013).
Unincorporated Joint venture
This funding structure allows each investor to transfer all the profits and losses in its SPV in its group accounts independent of the size of the interest in the project. Interests of each investor are set in operating agreements which outline the investor’s percentage interest in the project and its governance. Commonly, an operating company is required for practical or legal reasons to hold assets or licenses that cannot be held by the investors mutually (EWEA, 2013) This kind of funding structure has some tax-driven benefits. It has also benefit in that regard that it allows each investor to pursue different ownership and financing options independent of their partners. No partner has overall control in UJV and there is a need for unanimity in decision-making (PricewaterhouseCoopers, 2012).
Incorporated joint venture with debt
This funding structure is similar to traditional unincorporated JV but is typically created for tax purposes to allocate different risks or to distribute PPA liability (EWEA, 2013).
Risk profile
To convince stakeholders to invest in offshore wind power, the market must compete for capital with other markets and the attractiveness should be bigger than other available
high, especially in comparison with other infrastructure projects. The table below retrieved from Moné, Stehly, Maples, & Settle (2015), summarizes the risks that are associated with offshore projects and mitigation strategy for each.
Table 3. Offshore Project Risk Categories and Mitigation Strategies. Adapted from: "2014 Cost of Wind Energy Review", by: Moné, Stehly, Maples & Settle, 2015, NREL.
Risk category Examples Mitigation strategies
Development risk • Project viability
• Debt vs equity ratios
• Community engagement • Robust project
management
• Sponsor commitments • Due diligence to ensure
that all permits, licenses and authorizations are in force
Financing risk • Attract sufficient
debt/equity
• Once operational, debt must cover payment obligations
• Planning, engaging likely financiers early
• Diligent
permitting/contract structuring
• Fixed price for generated power
• Conservative, validated estimates
Construction risk • Delays and cost overruns • Responsibility for problems (liability) • Analysis of downside scenarios • Preparation of contingency fund • Insurance • Strong contracts • Due diligence to validate
design, engineering
Operations risk • Lower availability
• Cost overruns • Smart warranty design with emphasis on revenue protection • Long-term service agreement • OEM commitment • Insurance • Conservative planning and budgeting
• Due diligence to validate assumptions
Volume risk • Energy production lower
than expected • Conservative wind resource estimates • Insurance
• Priority dispatch agreement
• Due diligence to validate assumptions