Secondary Task Workload
Test Bench – 2TB
Final Report
ViP publication 2014-1
Authors
Katja Kircher, VTI Christer Ahlström, VTI Annie Rydström, Volvo Cars Mikael Ljung Aust, Volvo CarsDaniel Ricknäs, Scania
Susanne Almgren, Saab Automobile Arne Nåbo, Saab Automobile
Preface
This report is the result of a fruitful cooperation between Saab Automobile, Volvo Cars Corporation (VCC), Scania and the Swedish National Road and Transport Research Institute (VTI). The reported work has been undertaken in the project Secondary Task
Workload Test Bench – 2TB within the competence centre Virtual Prototyping and Assessment by Simulation (ViP).
The scope of the project was to develop a simulator-based test method for assessing the load imposed on the driver from secondary tasks (in-vehicle equipment), i.e. to investigate commonly used performance indicators for their sensitivity to different levels of
difficulty of secondary tasks loading on different modalities, and to evaluate their robustness across platforms.
The project was financed by the competence centre ViP, i.e. by ViP partners and the Swedish Governmental Agency for Innovation Systems (Vinnova).
We are grateful to all who contributed to the project, and special thanks go to ViP for financing the study.
Linköping, September 2012
Quality review
External peer review was performed in May 2012 by Håkan Alm, Luleå University and Paul Green, University of Michigan Transportation Research Institute (UMTRI). Katja Kircher has made the final alterations to the manuscript. The ViP Director Lena Nilsson examined and approved the report for publication on 26 March 2014.
Table of contents
Executive summary ... 9
1 Preamble ... 11
2 Introduction ... 12
2.1 Problem statement ... 12
2.2 Driver performance metrics in interface design ... 12
2.3 Project objectives and goals ... 13
3 Background ... 15
3.1 Reference task requirements ... 15
3.2 Reference tasks ... 16 4 Method ... 20 4.1 Apparatus ... 20 4.2 Road ... 23 4.3 Traffic ... 24 4.4 Participants ... 24 4.5 Design ... 25 4.6 Procedure ... 26
4.7 Research questions and analysis ... 27
5 Results and interpretation ... 34
5.1 Baseline comparisons ... 34
5.2 Secondary task performance ... 37
5.3 Performance ratings... 42
5.4 Driving behaviour ... 45
5.5 Driver behaviour ... 48
5.6 Interpretation of driver and driving behaviour results ... 49
5.7 Inter-individual differences ... 50
6 Discussion ... 53
7 Conclusions ... 56
Abbreviations
DLP Digital Light Processing projector
ESoP European Statement of Principles
GLM General Linear Model
HASTE Human Machine Interface and the Safety of Traffic in Europe project
HMI Human Machine Interface (interaction)
ISO International Organization for Standardization
IVIS In-Vehicle Information System
LCD Liquid Crystal Display
LCT Lane Change Test
PI Performance Indicator
SAE Society of Automotive Engineers
S-IVIS Surrogate In-Vehicle Information System
TFT Thin Film Transistor
US DOT United States Department of Transport
VCC Volvo Car Corporation
List of figures
Figure 1: Visualisation of the numbers read from tape (t) and the expected answers (a) to be given. ... 18 Figure 2: Visualisation of the haptic task of inserting wooden bricks into a children’s play box without looking. ... 19 Figure 3: Graphical representation of the road curviness. VTI study to the left and VCC study to the right. ... 23 Figure 4: The roads used for the experiment in the VTI (left) and VCC (right)
simulators. ... 24 Figure 5: Visualisation of one reference task block and one baseline block. The order of the sections within each block is balanced across and within participants, the levels of task difficulty always appeared in the same order. ... 26 Figure 6: Graphical representation of the analyses. Light grey boxes represent baseline drives without lead car. Dark grey boxes represent baseline drives with lead car. Red, green and blue boxes represent the three different secondary tasks on three levels of difficulty (from unsaturated to saturated colours). The different shadings represent the driving condition under which the secondary task was executed (no black component: secondary task only; slight black component: driving without lead car; heavy black component: driving with lead car). ... 29 Figure 7: Percentage answers to stimuli for the visual task across all participants, for both locations, all driving conditions and all task difficulty levels. ... 38 Figure 8: Percentage correct answers of all answered stimuli for the visual task across all participants, for both locations, all driving conditions and all task difficulty levels. 39 Figure 9: Mean task completion times (s) for the correct answers on the visual task across all participants, for both locations, all driving conditions and all task difficulty levels. ... 39 Figure 10: Number of correct answers on the cognitive task across all participants, for both locations, all driving conditions and all task difficulty levels. ... 40 Figure 11: Number of correctly placed bricks minus the number of incorrectly placed bricks across all participants, for both locations, all driving conditions and all task difficulty levels. ... 41 Figure 12: Self-rated performance on the driving task, depending on the concurrently executed secondary task (most difficult level) and lead car presence. ... 43 Figure 13: Self-rated secondary task performance on the most difficult level, depending on secondary task type and driving condition. ... 43 Figure 14: Percentage of mental effort invested in the secondary task as opposed to the driving task, depending on secondary task type and lead car presence. ... 44 Figure 15: Lane departure distance (m) for individual VTI (red) and VCC (blue)
participants. Mean (fat solid line) and median (fat dashed line) values for all secondary task conditions, with and without lead car, and for all task difficulty levels (1, 2, and 3). ... 51
Figure 16: Percent road centre (PRC) with a radius of 8° for individual VTI (red) and VCC (blue) participants. Mean (fat solid line) and median (fat dashed line) values for all secondary task conditions, with and without lead car, and for all task difficulty levels (1, 2, and 3). ... 52
List of tables
Table 1: The arrow matrices for the three levels of difficulty in the visual reference
task. ... 17
Table 2: The numbers read from tape for the three levels of difficulty in the cognitive reference task. ... 18
Table 3: Performance specifications of the VTI Simulator III. ... 20
Table 4: Generalised research questions for the study at hand, with motivations... 28
Table 5: Classification of the PIs into different categories. ... 30
Table 6: PI (performance indicator) definitions. ... 31
Table 7: F-values and levels of significance for the driving behaviour PIs for baseline comparisons. Within each row the upper values indicate the VTI results and the lower values indicate the VCC results. When a box is filled with grey, there is a significant difference (p < .05) between VTI and VCC for the factor combination in question. Rows marked with red indicate PIs that relate to traffic code violations. (*): p < .10; *: p < .05; **: p < .01. ... 35
Table 8: F-values and levels of significance for the driver behaviour PIs for baseline comparisons. Within each row the upper values indicate the VTI results and the lower values indicate the VCC results. When a box is filled with grey, there is a significant difference (p < .05) between VTI and VCC for the factor combination in question. (*): p < .10; *: p < .05; **: p < .01. ... 36
Table 9: F-values and significances for all tested driving behaviour PIs for main effects and 2-way interactions. Within each row the upper values indicate the VTI results and the lower values indicate the VCC results. When a box is filled with grey, there is a significant difference (p < .05) between VTI and VCC for the factor combination in question. Red bars indicate PIs related to a traffic rule violation. (*): p < .10; *: p < .05; **: p < .01. ... 46
Table 10: F-values and significances for all tested driver behaviour PIs for main effects and 2-way interactions. Within each row the upper values indicate the VTI results and the lower values indicate the VCC results. When a box is filled with grey, there is a significant difference (p < .05) between VTI and VCC for the factor combination in question. (*): p < .10; *: p < .05; **: p < .01. ... 48
Secondary Task Workload Test Bench - 2TB
Final Report
by Katja Kircher1, Christer Ahlström1, Annie Rydström2, Mikael Ljung Aust2, Daniel Ricknäs3, Susanne Almgren4, and Arne Nåbo4
1 Swedish National Road and Transport Research Institute (VTI) 2 Volvo Cars
3 Scania
4 Saab Automobile
Executive summary
The main aim of this study was to investigate a selection of commonly used performance indicators (PIs) that have been reported to be sensitive to distraction and workload. More specifically, the PIs were tested for their ability to differentiate between task modalities (visual, cognitive and haptic) and task difficulty (easy, medium and hard). It was investigated whether possible differences were constant across two traffic situations (with/without lead vehicle) and two driving simulators.
The experiment was conducted in the VTI Driving Simulator III, an advanced moving-base simulator, and in the Volvo Car Corporation (VCC) driving simulator, an advanced fixed-base simulator. Both simulators were equipped with Smart Eye Pro eye tracking systems. The simulated road was a rural road made up of alternating left and right curves. The posted speed limit was 90 km/h. In the moving-base simulator 24 drivers participated, and in the fixed-base simulator 12 drivers participated. The design was within-subjects for the factors task
modality, task difficulty and traffic situation.
A visual, a cognitive and a haptic secondary task were chosen to test the ability of the PIs to distinguish between the tasks’ loading on different modalities. The visual task was a
modification of the arrows task developed in the HASTE project, the cognitive task was a combined computation and memory task based on the paced serial addition task, and the haptic task was developed within the project. For the haptic task the participants had to insert wooden bricks of different shapes into matching holes without visual aid.
The longitudinal PIs tested were mean speed, standard deviation of speed, speeding index and minimum time headway (THW). Lateral PIs were mean lane position, modified standard deviation of lane position (SDLP), number of lane crossings, steering wheel reversal rate (SWRR), lane departure distance and lane departure area. Eye movement PIs were percent road centre (PRC), longest glance away from the road, total eyes-off-road time, and two PIs describing the actual attention level based on the AttenD algorithm.
The main results from the study were:
There were only minor differences between the two simulator types for driving behaviour as described by longitudinal PIs. There was no overall offset, and the main difference was that the visual task led to stronger speed reductions in the moving-base simulator, which influenced both the mean speed and the speeding index.
that it increased with increasing task difficulty level for the visual and the haptic tasks in the moving-base simulator. However, this increase was due to one outlier who reduced the speed massively and therefore increased the THW so much that the mean of all drivers got affected.
Regarding lateral PIs, major differences between the two simulator types were found, both as a general offset and for those factor combinations that include modality and task difficulty level.
With the visual or the haptic task active, the drivers positioned themselves further to the left and the SDLP was higher in the fixed-base simulator.
The number of lane crossings did not differ considerably between the simulators, but the lane departure area was larger on average in the fixed-base simulator, again
influenced by modality, with the largest lane departure areas for the visual task, and in the case of the fixed-base simulator for the haptic task as well.
For all lateral PIs except the SWRR, for both simulators, and especially for the visual and the haptic tasks, the differences were only evident for the medium task difficulty level.
Most of the eye movement related PIs had a general offset between the simulators. The drivers in the fixed-base simulator accumulated more time with their eyes off the road, especially during the visual and the cognitive tasks, while the drivers in the moving-base simulator cast longer single glances at the display.
Generally speaking, the longitudinal PIs behaved more similarly across simulator platforms, while the lateral control was much more impaired in the fixed-base simulator. Caution should be exerted in the interpretation of outcomes based on lateral PIs in fixed-base simulators. It is unexpected that the lateral PIs should show the most extreme values for the medium level of task difficulty, especially as this could also be observed for the baseline condition, in which no task at all was conducted.
There were large intra-individual differences found across most of the investigated PIs. In some cases the behaviour is quantitatively different, with some drivers having much higher values than others but with the general trend being equal, while for other PIs the differences appear to be of a qualitative nature.
To conclude, assessing the effects of secondary tasks on traffic safety via PIs that are based on the control level of driving behaviour is difficult. Results vary widely between drivers, and the implications of changes in some PIs on safety are not always clear. It is therefore
suggested to investigate the possibility of using PIs on the tactical level of driving behaviour, and instead of reporting mean values, that potentially are not very expressive, it may be worth exploring the notion that a certain safety envelope may not be breached by any or x % of the drivers. This may make the interpretation of results more straightforward.
1
Preamble
In the original proposal it was planned that simulator studies would be conducted at three facilities; at VTI, Saab Automobile and Volvo Cars (VCC). Due to economic circumstances, Saab was not able to fulfil this mission during the course of the project.
2
Introduction
Windscreen wipers, climate controls and radios are omnipresent in our vehicles, and there are not many people out there who question this. As vehicles develop, there will be more and more new features and applications just waiting to find their way into the cockpits of modern cars. These features and applications can come either as embedded devices, integrated into the vehicle system, or as nomadic devices, portable and not necessarily built for in-vehicle use. Depending on the system, its usage can have more or less impact on the driver’s workload. Here, all load on the driver coming from tasks not directly related to driving is called “secondary task workload”.
Within the eSafety initiative a group of experts developed the “European Statement of Principles” (ESoP) based on Recommendation 2000/53/CE from 1999, giving guidance for the development of safe human machine interfaces (HMI) for in-vehicle information and communication systems (ESoP Expert Group, 2005). An update was published in 2007 (ESoP Expert Group, 2007), taking into account the development in technology. ESoP
recommendations include highly relevant recommendations, such as “The system does not distract or visually entertain the driver”. While this is immediately comprehensible, it is not easily operationalized in a consistent manner.
Just after the study presented here had been carried out the US DOT suggested a testing procedure for embedded devices and their potential to distract drivers visually and manually (US DOT, 2012). At the time of writing this report, it was still possible to leave comments on these suggestions.
2.1
Problem statement
The testing of secondary task workload for a vehicle meant for production can be quite substantial due to the amount of systems that need to be tested. It is therefore necessary to have a test method that is efficient but still relevant to a real driving situation. Also, the method would benefit from being standardized, meaning that results can be compared and communicated in a consistent manner. The outcome of such a test would preferably be whether driving and system operation can be done safely together in a given situation or not.
2.2
Driver performance metrics in interface design
In an attempt to operationalize distraction and standardize a test method for the suitability of navigation system usage while driving the Society of Automotive Engineers suggested the so-called 15-second rule (SAE, 2000), based on the original suggestion by Green (1999). The idea was that a task, which can be completed within 15 seconds while the vehicle is standing still, should be acceptable to execute while driving. This rule has been debated vigorously, and an expansion to accommodate adaptation for the type of load – visual, cognitive or haptic – has been suggested (Green, 2000; Reed-Jones, Trick, & Matthews, 2008; Tijerina, 2000; Tijerina, Johnston, Parmer, Pham, & Winterbottom, 2000; Tijerina, Johnston, Parmer,
Winterbottom, & Goodman, 2000). Related to that, the SAE Standard 2365-2002 (SAE, 2002) provides guidelines on how to calculate task duration for navigation system usage, based on a task analysis.
ISO 16673:2007 (ISO, 2007) provides a procedure for measuring visual demand due to the use of visual or visual-manual interfaces. With this technique, the driver’s vision is occluded with a special pair of glasses that opens and shuts at various time intervals (Weir, Chiang &
Brooks, 2003). The phase with the driver’s vision occluded simulates the time they are looking at the road, while the open phase represents the time that they are looking at the in-vehicle device. By using this method it is possible to evaluate whether a secondary task can be carried out using only short, periodic glances. Otherwise, the task is considered unsafe.
Advantages with the visual occlusion technique is that it can be carried out while the car is standing still and also that it applies to both embedded and nomadic devices.
Another standardised task to assess the influence of secondary tasks on driver performance is the lane change test (LCT), which is subject of a proposed ISO standard. The LCT tries to reach the reliability of a laboratory experiment while increasing the validity by mimicking a real driving scenario (Mattes, 2003). Compared to a laboratory experiment, the artificial stimulus is replaced by road signs and artificial key presses are replaced by actual lane changes. Lane changing performance (primary task) is then used as a measure of how distracting the secondary task is.
Detection response tasks, such as the peripheral response task (van Winsum, Martens, & Herland, 1999) or the tactile response task (Engström, Aberg, Johansson, & Hammmarbäck, 2005), have also been introduced as measures of driver distraction. Detection response tasks measure the drivers’ ability to detect different stimuli. For example, in the peripheral response task, a visual stimulus is presented in the peripheral field of view. Depending on detection performance, it is possible to assess the impact of different secondary tasks.
Distraction assessment based on visual behaviour has also been suggested. ISO 15007:2002 describes definitions, techniques and procedures for assessing visual behaviour in terms of glances towards some display or other target in the vehicle (ISO, 2002; ISO under
development). The underlying idea is similar to the occlusion technique, namely that during the execution of some rather complex visual task, several glances to the peripheral object take place. Glance durations are typically between 0.6 and 1.6 seconds, and drivers are generally unwilling to look away from the road for more than 2 seconds (Green, 2002). If thresholds for total glance duration, glance frequency, single glance duration and total task time are
exceeded, the secondary task is considered unsafe. An evaluation of the occlusion technique and its usefulness for the assessment of distraction imposed by driver support systems was provided by Pettitt et al. (2006).
A drawback with visual behaviour analysis according to the ISO standard is that it is based on manual video transcription. Different solutions based on eye tracking have therefore been suggested. These include the percent road centre measure (Victor, Harbluk, & Engström, 2005), i.e. the percentage of time that the driver looks at the forward roadway, and the visual demand metric (Engström & Mårdh, 2007), which also accounts for eccentricity and duration of individual glances.
Further performance indicators for the assessment of driver distraction are presented and discussed in a book compiled by Rupp (2010), based on a workshop held in 2008.
2.3
Project objectives and goals
There are a number of driver performance metrics available for guidance in interface design. Most of them come with both advantages and disadvantages. The validity of approaches that are performed in a laboratory setting, such as the 15-second rule, may be questioned.
Assessing secondary task load by adding another (third) task, as in the detection response tasks, may also be questioned in many cases. More general concerns that are not addressed by any of the methods are factors such as familiarity, expectancy and the complexity of the
surrounding traffic environment. In this project, high validity and safety will be achieved by performing the test in high-fidelity driving simulators (with and without moving-base). Further, distraction assessment will not rely on any imposed third task.
The reported project should be seen as a first phase, where the main goal is to identify performance indicators for driving behaviour, driver behaviour and subjective ratings that reliably indicate changes in workload induced by a secondary task of visual, cognitive or haptic/tactile character. It should preferably be possible to differentiate between different levels of secondary task difficulty based on the output of the identified performance indicators.
In a future second phase, the surrounding traffic environment will be of increasing
complexity. The idea is to evaluate in which situations a certain task will be safe to perform. A secondary goal of the second phase will be to fully automatize the result generation process.
The concrete objectives of the project are to:
1. Develop a testing procedure for secondary task workload measurement. 2. Perform a pilot study.
3. Develop a proposal for a full-scale project starting 2011 and apply for FFI funding. In this first phase of the project, the method will:
Use driving simulators of varying fidelity. They could range from a desktop solution to a high-fidelity solution.
Use state-of-the-art measurement equipment and data treatment methods. Have a reference secondary task to provide a solid anchor task.
In the second phase of the project, the method will:
Have a range of driving scenarios with different levels of “driving workload”. Describe the selection of participants to get a representative group.
Describe the number of participants needed to get reliable statistics. Use automated result generation in order to be efficient.
As mentioned, the approach is to tackle the issue in two steps. During the first, the
participants’ driving experience as well as the complexity of the secondary task are varied, while the complexity of the driving situation will be kept constant. During the second phase, variations in situational complexity will be incorporated and the analysis will be automated as much as possible.
3
Background
Theories on attention generally accept the notion that there are limits to how much humans can process at one time. Whether there is a central bottleneck or a modality dependent bottleneck as suggested in the multiple resource theory (Wickens, 1984), and in which way automation, experience and individual capacity differences play a role has been discussed widely in the literature (for a relatively recent overview see Wickens & McCarley, 2008). Driving is a dynamic task in a complex system (Hollnagel & Woods, 1983), which requires sustained attention from the driver. Exactly how much attention is required, and whether secondary tasks that include visual, manual or solely cognitive components have detrimental effects on driving performance or not, and how they differ depending on the load and the current situation has been debated at length (Regan, Lee, & Young, 2008).
The EU project HASTE has made a substantial contribution in investigating the suitability of different performance indicators for driver state assessment (Östlund et al., 2004). Tests were conducted both in the field and in different simulators. In HASTE focus was put on the visual and the cognitive channels, and so-called surrogate in-vehicle information systems (S-IVIS) were developed, which should represent the load put on drivers by real IVIS, but which could be manipulated for varying difficulty.
No S-IVIS for purely haptic load were developed, and in many studies visual and haptic activities are lumped together. It is, however, totally feasible to assume completely haptic interfaces that do not require any visual control. However, some cognitive resources are probably always needed for secondary task execution, regardless of whether the task is classified as visual, haptic, auditory or cognitive.
Load on different modalities have previously been shown to affect driver behaviour differently (Recarte & Nunes, 2000; Victor, Harbluk, & Engström, 2005; Östlund et al., 2004). Therefore, the same function can possibly affect the driver differently, depending on the interaction modality used. These differences in behavioural changes might have different effects on traffic safety in different traffic situations.
The current project was conceived as a preparation project for a larger scale investigation on what secondary tasks are acceptable to execute in different types of traffic situations. The present project focuses mainly on the identification of performance indicators (PIs) that can reliably assess a cognitive vs. visual vs. haptic load. For this purpose, secondary tasks with a known type of load should be used. As soon as those PIs are established, they can be used to assess functions whose type of load is not as clearly known.
In the present project the difficulty of the driving task is kept constant to enable assessing the effect of the different levels of load on different modalities. However, for the final assessment method it is planned to gradually increase the complexity of the traffic situation, in order to find possible cut-off points, and to watch for non-linear behavioural decrements.
3.1
Reference task requirements
For the reference tasks to work as such, they need to fulfil a number of requirements, which are described here.
1. Load on correct channel: The tasks must load highly on the modality they are intended to load on, which is either visual, cognitive (including speech) or haptic (including motoric load), and as little as possible on the other modalities. This is necessary to ensure that changes in the performance indicators really are due to a
capacity reduction in the modality in question, or, for that matter, in some central region, and not because another modality was drawn upon as well. Here, no
physiological measurements of brain activity in different areas were conducted, but a simpler approach was chosen, which was based on expert evaluations of the load profile of the different tasks.
2. Simplicity: The task must be simple enough so that all participants have a very good chance of understanding it easily, and that the learning curve is very steep. It is important that the participants will reach their performance asymptote, so they do not improve their performance significantly during the course of the experiment.
3. Levels of difficulty: It must be possible to vary the difficulty of the task reliably, as it should be investigated whether an increased level of difficulty in the reference task will lead to a decreased performance in driving and driver behaviour. The task difficulty was determined via a set of pre-tests with the reference tasks in question. 4. Readily resumed: The participants must be able to resume the task quickly in case they lost track of the task at some point in time. Therefore, the consecutive actions should be stand-alone and not be dependent on the previous one.
5. System-paced: The task should be system-paced and not user-paced, so that all participants can be exposed to the same conditions.
6. Task performance: The task performance should be possible to quantify, if necessary on more than one dimension. This could include the time to answer, the correctness of the answer, precision, etc. This is necessary to be able to observe performance
degradations in the reference task, which can then be related to performance in the driving task, and in baseline trials.
3.2
Reference tasks
The task prototypes were chosen based on the requirements listed above. The visual task was based on a widely used and published task, the cognitive task had been used successfully at VTI before, and the haptic task was developed specifically for the current project. It is
acknowledged that all tasks incorporate a cognitive component, and the visual task includes a haptic component, but it is assumed that the channel after which the task has been named takes the biggest load for each respective task.
3.2.1 Visual task
The visual task is a modification of the arrows task developed in the EU project HASTE (Östlund et al., 2004). It is a visual search task with the goal to determine whether an arrow pointing upward is present or not in a matrix of arrows pointing to the left, to the right or downward. In order to obtain suitable levels of difficulty desktop pre-tests were made with matrix sizes of 4 x 4, 5 x 5, and 6 x 6 arrows. A target arrow was present in half of the cases in a random position in the matrix. The distracting arrows could per matrix either point only to the left, only to the right, only down, or in all three directions, which yielded eight different test cases.
When executing this task as primary task in a desktop situation the error rate was minimal, therefore reaction time for correct answers was used as the indicator of task difficulty. Visual inspection of the reaction times for the different test cases and matrix sizes led to a selection of a 4 x 4 matrix with arrows either pointing to the left or to the right, with and without a target arrow, as the easiest level, Level 1. The mean reaction time to produce a correct answer
for these cases lay at 1.10 s. Level 2, the medium difficulty level, was a 6 x 6 matrix with arrows pointing downward, with and without a target arrow. The mean reaction time for these cases was 1.45 s. Level 3, the most difficult level, was represented by a 6 x 6 matrix with arrows pointing in all three directions, with and without a target arrow. The mean reaction time for this level was 2.6 s. The arrow matrices for the different difficulty levels are listed in Table 1.
Table 1: The arrow matrices for the three levels of difficulty in the visual reference task. Cases selected per level
no target arrow present target arrow present
Le vel 1 Le vel 2 Le vel 3 3.2.2 Cognitive task
The cognitive task is a slightly modified version of the Paced Serial Addition Task (Gronwall, 1977; Sampson, 1956). The cognitive task loaded both on memory and the capacity to handle additions. Single digit numbers were read from tape, with a new number being read every third second. The participant had the task to respond with the sum of the last two numbers read, that is, he or she had to remember the last number from tape while responding to the current addition, and then wait for the next number to add to the one remembered (Figure 1).
t 2 3 6 1 4 2 7 8 5
a 5 9 7 5 6 9 15 13
Figure 1: Visualisation of the numbers read from tape (t) and the expected answers (a) to be given.
Pilot trials with varying levels of difficulty of the additions as well as varying speed of the presented numbers were run to determine three distinct levels of difficulty. The correctness of the answers given, in combination with subjective ratings of the nine pilot participants, led to the selection of the three levels of difficulty (presented in Table 2), and the speed of a new number being read every third second. The number sequences could be read both from the first to the last number and from the last to the first number, which resulted in the same answers.
Table 2: The numbers read from tape for the three levels of difficulty in the cognitive reference task.
Level 1 Level 2 Level 3
1 4 4 2 2 7 2 7 5 1 1 9 1 5 3 2 3 4 1 5 9 1 2 8 2 4 5 3.2.3 Haptic task
To the knowledge of the authors, no readily available haptic task existed that fulfilled the requirement of not having a visual component. Several alternatives, like the usage of a knob or dial, were considered before the final arrangement was selected. Its advantages are that no vision is involved, that performance could be logged automatically via micro switches, and that the setup was easily transportable between the test sites.
The goal of the haptic task was to insert wooden bricks of three different shapes into matching holes in a wooden box. The box was placed between the front seats, within easy reach of the driver. To prevent the driver from looking down at the bricks the box was covered with a black cloth (Figure 2).
There were three cylindrical, three triangular and three cubic wooden bricks to choose from. Whenever a brick was inserted into the fitting hole it pressed a micro switch which registered the inserted brick in the log data.
Three levels of difficulty for the haptic task were created in pilot trials by using bricks of different shapes, and by varying the order in which the bricks should be inserted. On the easiest level the drivers were asked to only insert the cylindrical bricks, on the medium level they were asked to insert cubic and/or triangular bricks in any order, and on the hardest level the drivers should insert alternate between cubic and triangular bricks.
Picture Explanation
A children’s play box was modified such that the bricks inserted in the box exit the box automatically and reach the open part, where they can be picked up again. Three bricks of each shape were available.
The play box is installed in the vehicle between the front seats. Here it can be seen how a round brick is inserted, but during the study a black cloth covered the box and the hand, such that no visual information could be obtained.
Here the black cloth is in place, but in the combined picture the hand holding the brick underneath the cloth shows through.
Figure 2: Visualisation of the haptic task of inserting wooden bricks into a children’s play box without looking.
4
Method
It was a goal of the project to keep the experimental design as similar as possible across the different test sites, to be able to compare the results for the different simulators.
4.1
Apparatus
The study was run in two different locations, in two different simulators, but with the same secondary tasks. It had been planned to conduct the experiment in three simulators, but due to economic issues this could unfortunately not be realised.
4.1.1 Simulators
Two passenger car simulators were included in the study, one with moving-base and one with fixed-base.
VTI
The experiment was conducted in the VTI Driving Simulator III, an advanced moving-base simulator. A Saab 9-3 cabin was mounted on the motion platform. The moving-base is used to generate forces felt by the driver while driving. It can be divided into three separate parts: a large linear motion, tilt motion and a vibration table. The linear drive has world leading performance, it can achieve the highest acceleration of all simulators in the world. Linear motion was used in the lateral direction in the present study. The tilt motion is used in the roll and pitch directions to simulate long term accelerations such as driving in a curve or
longitudinal acceleration and deceleration. The vibration table provides additional capabilities to generate road roughness for higher frequencies. While the tilt motion tilts both the cabin and the graphics projection screen, the vibration table moves the cabin relative to the projection screen. Detailed performance specifications for the motion platform of the VTI simulator III are provided in Table 3.
Table 3: Performance specifications of the VTI Simulator III.
System Type of movement Max values
Cabin Pitch angle - 9 degrees to + 14 degrees Roll angle ± 24 degrees
External linear motion Maximum amplitude ± 3.75 m Maximum speed ± 4.0 m/s Maximum acceleration ± 0.8 g Vibration table Vertical movement ± 6.0 cm
Longitudinal movement ±6.0 cm Roll angle ± 6 degrees Pitch angle ± 3 degrees
The visual system in the VTI simulator III consists of 3 DLP projectors providing a 120 degrees forward field of view and 3 LCD displays for the rear view mirrors. The projectors have a resolution of 1280 x 1024 pixels.
The sound system consists of five speakers, two speakers in the dashboard close to the windshield, one speaker in each of the front doors, and one rear speaker. These speakers are controlled by a separate computer which can play sound in any of the five speakers. This computer dedicated to the control of the sound interacts with its environment through the network.
VCC
At VCC the experiment was conducted in a fixed-base driving simulator located in the HMI Usability Lab. The simulator is based on a Volvo S80 cockpit and has an automatic
transmission and force feedback steering wheel and pedals. The front vision consists of a 180 degrees forward field of view and the image is provided by 5 projectors with a resolution of 1900x1080 pixels. Three 12'' TFT screens serve as rear view mirrors. A sound system provides sound from the road, wind and engine noise. A low frequency speaker is installed under the driver’s seat for road vibration. The simulator software used is provided by AutoSim AS (Norway).
4.1.2 Eye tracker
At both test sites eye trackers from Smart Eye AB (Sweden) were used for gaze direction determination.
VTI
At VTI Smart Eye Pro 5.7 was used with four installed cameras. Data were logged with 120 Hz. In the preparation phase of the project it turned out that it was not possible to calibrate the Smart Eye cameras when the simulator was parked, and then track the eye movements
successfully with the simulator in driving mode with the motion system switched on. The reason was that the cameras shifted position slightly in relation to each other when the motion system was switched on, which transports the cabin a few metres into the middle of the linear motion platform and adjusts the pitch angle.
This necessitated a camera calibration in place, when the motion system was on and the cabin position settled. Due to mechanical and safety restrictions it is not possible, however, to enter or exit the cabin with the system in motion without provoking an emergency stop. Therefore the participants had to be taught how to calibrate the cameras, which they then did when the cabin had reached the driving position.
Auto-calibration, which checks the calibration over time and corrects deviations based on the head model, was switched off in the present study.
VCC
The procedure at VCC was similar, except that Smart Eye Pro 5.6 with three cameras was used, data were logged with a frequency of 60 Hz, and calibration was made by the experimenter.
4.1.3 Reference tasks
Each reference task was presented on three levels of difficulty, with each level lasting for 30 s, and with a 30 s break between levels as well as before the first and after the last level. Level 1 was always presented first, followed by Level 2 and finally Level 3.
Visual task
In the study each participant was presented with matrices of arrows from Level 1, Level 2 and Level 3 (see Chapter 3.2.1). Every 5th second a new matrix appeared. A sound announced the appearance of a new arrow matrix. The arrows were displayed on a touch screen, which was mounted to the right of the middle console in the simulator.
The participant had to determine whether one of the arrows pointed upwards or not. If one such target arrow was present the participant was required to press a “yes” button on the touch screen. If no upwards pointing arrow was present a “no” button should be pressed. As soon as a button was pressed the arrows disappeared. No feedback for the correctness of the answer was given.
The task was presented and logged via a dedicated computer, and the log was time synched to the log from the simulator. The current target case, the correctness of the answer and the reaction time were logged.
Cognitive task
The cognitive task was presented such that a new number was played every third second (see Chapter 3.2.2). As each sequence was made up of 9 numbers, and the participant needed a few seconds to answer the last number, each block took about 30 s. The experimental design required each participant to do each level three times. For half of the participants the
sequences were read in the order first-to-last, last-to-first, first-to-last, and for the other half of the participants the order was read the other way round. The start of each cognitive task sequence was announced auditorily by the first number being read.
Haptic task
The beginning of each 30-second episode of the haptic task was announced by a sound. Then the participant started inserting the wooden bricks into the holes with the goal to manage with as many bricks as possible before another sound announced the end of the 30-second segment (see Chapter 3.2.3).
4.1.4 Performance rating scale
Always when Level 3 of a secondary task was completed, and in the end of the baseline drives, the participants were asked to rate their driving performance and their performance on the secondary task for Level 3, or for the last portion of the baseline drive. Ratings were made by giving a number between 1, which indicated the worst performance possible, and 10, which indicated the best performance possible. The participants gave a verbal rating upon request by the experimenter.
4.1.5 Effort distribution rating
When about half of the participants had been run at VTI it was decided that an additional rating estimating the participants’ experienced distribution of effort should be included. Therefore, no such data are available from the first 14 participants in the study. Participants were asked to indicate how much attention they had allocated to the driving task and to the secondary task, respectively, provided that they had 100 % attention to distribute. The participants answered verbally upon a question by the experimenter, after having given the performance rating.
4.2
Road
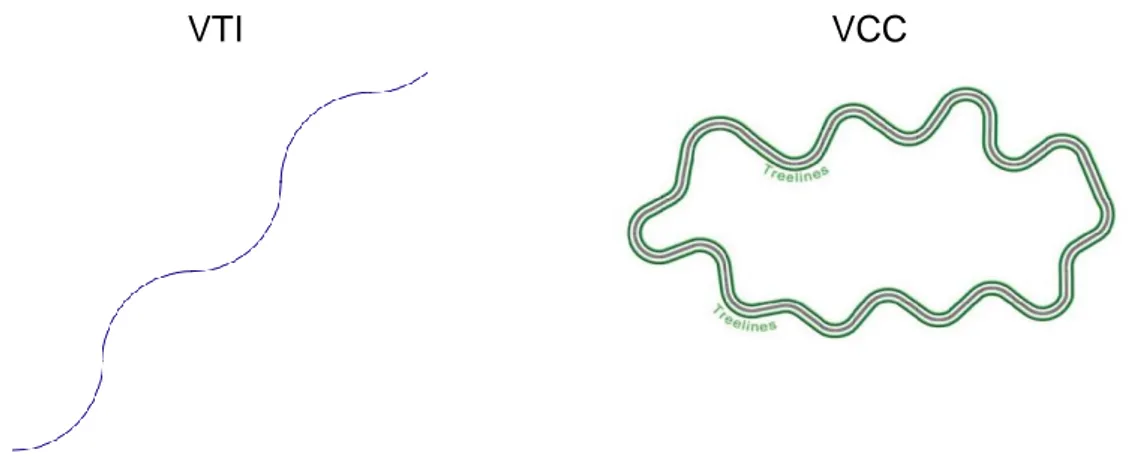
The road was a rural road with a width of 3.2 m per lane. It was made up of curves with a radius of 1000 m. At VTI the curve direction changed when a circle segment of 90° was completed, that is when ca. 1571 m were driven (Figure 3 left). At VCC, a similar curve design was used but here the road was on a closed curve (Figure 3 right).
VTI VCC
Figure 3: Graphical representation of the road curviness. VTI study to the left and VCC study to the right.
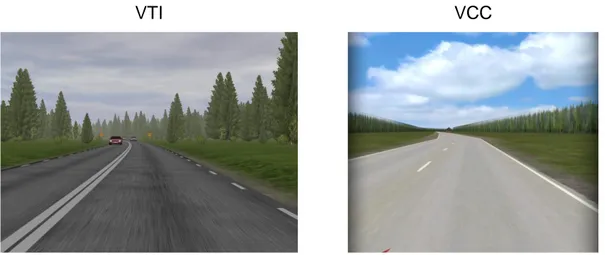
The road led through a forest with trees on either side of the road. The road markings differed at the two test sites: At VTI the central road marking was made up of a double solid line, indicating that passing was banned, and the road markings on the sides were interrupted lines (Figure 4 left). At VCC the central marking was an interrupted line with solid lines as outer borders (Figure 4 right).
The posted speed limit was 90 km/h. One speed limit sign was placed in the beginning of each driving section.
VTI VCC
Figure 4: The roads used for the experiment in the VTI (left) and VCC (right) simulators.
4.3
Traffic
All surrounding traffic consisted of passenger cars of varying make and colour, which were drawn randomly from the available cars.
In half of the driving sections the participants had two lead cars in front of them. These cars drove 50 m apart from each other and held a mean speed of 87 km/h, around which they varied their speed according to Equation 1. Thus, the speed of the lead car was not coupled to the participants’ speed. This allowed the participant to vary the distance according to his or her wishes, thereby influencing the own workload.
Equation 1. Computation of the lead vehicle speed. The iteration is based on the iteration speed of the simulator programme, which is 200 Hz.
𝑣 = 87 + 2 ∗ sin (𝑖𝑡𝑒𝑟𝑎𝑡𝑖𝑜𝑛 3000 ) + max(3 ∗ sin ( 𝑖𝑡𝑒𝑟𝑎𝑡𝑖𝑜𝑛 10000 − 4) , 0) [𝑘𝑚/ℎ] In all driving sections there was oncoming traffic. The traffic appeared randomly, with the restrictions that no cars could follow each other closer than with a distance of 30 m, and the time interval between oncoming cars should not be larger than 35 s. The oncoming traffic kept to its own lane and did not overtake.
4.4
Participants
In the VTI simulator 24 participants took part, and in the VCC study 12 participants took part.
VTI
The participants were recruited via an external company. The company was provided with the following inclusion criteria: Participants were required to be between 30 and 45 years of age, which was meant to narrow the variance in driving experience and age related effects.
Further, participants were required not to use glasses while driving, as glasses can interfere with the eye tracker and degrade gaze tracking performance. Additionally, the participants
should have some experience with modern technology like mobile phones/smartphones, navigation systems, and the like, and have used them while driving. This should increase the likelihood of participants engaging in the reference tasks.
Altogether 24 participants took part, nine women and 15 men. The mean age was 42 ± 5 years. The participants had held their licences for 23 ± 6 years on average. One of the participants drove below 5000 km a year, seven reported to drive between 5000 and 10 000 km yearly, twelve reported to drive 10 001 to 20 000 km yearly, and the remaining four reported to drive more than 20 001 km yearly.
VCC
VCC employees were invited to participate in the study. The test group comprised 12 participants in total, 4 women and 8 men, with a mean age of 34 ± 7 years. The participants had held their licences for 17 ± 7 years on average. All the participants worked with research and development at VCC.
4.5
Design
In each of the two simulators included in the study the same full within-subjects design was run. The factor reference task was varied on four levels (baseline, visual, cognitive, haptic), the factor
traffic was varied on two levels (lead car, no lead car), and the factor task difficulty was varied on
three levels (easy, medium, hard). This resulted in a 4x2x3 design, which was completed with an additional baseline in which the reference task was performed while the vehicle was parked. This was necessary to obtain a baseline for the maximum performance on the reference task only, allowing an estimation of the performance decrement caused by driving, and consequently, of the effort placed on the secondary task. Two baseline blocks, with and without lead car, were driven both in the beginning and in the end of each run, to be able to control for behavioural changes over the course of the experiment. Within each block the order for the sections with or without lead car was balanced between and within participants.
Further, each participant completed three blocks with one of the three reference tasks in each block. The order of the blocks was balanced between participants. Within each block, there were always three sections. In one the participant only completed the reference task without driving, in one the participant drove with a lead car ahead while executing the reference task, and in one the participant drove without lead car ahead while executing the reference task. The order of the three sections within each block was balanced across participants.
Each section was built up such that the participant first drove or waited 30 s without performing the reference task, depending on which section in the block it was. Then the reference task was executed on Level 1 for 30 s, followed by a break of 30 s. Next the reference task was executed on Level 2 for 30 s, followed by another break of 30 s. Finally the reference task was executed on Level 3 for 30 s, followed by a last break of 30 s. When the participant had to drive at the same time, the time counter was started as soon as the participant had reached a speed of 75 km/h. For a visualisation of a reference task block and a baseline block see Figure 5.
30 s 30 s 30 s 30 s 30 s 30 s 30 s ref. ta s k bl oc
k ref. task only Level 1 Level 2 Level 3
ref task + driving
with lead car Level 1 Level 2 Level 3 ref task + driving
without lead car Level 1 Level 2 Level 3
ba s el ine bl oc k
driving only with lead car
driving only without lead car
time
Figure 5: Visualisation of one reference task block and one baseline block. The order of the sections within each block is balanced across and within participants, the levels of task difficulty always appeared in the same order.
4.6
Procedure
The procedure is described in detail for VTI, which was first out to run the study. For VCC only those aspects that differ from the VTI procedure are taken up.
VTI
Each participant received information and instructions for the experiment via mail a few days before the actual experimental run. A link and a login to a web-based background
questionnaire was sent as well, together with the request to fill in the questionnaire before the experiment was run.
Upon arrival the participant was welcomed and led to the simulator hall. The experimental procedures were gone through once more, whereupon the participant signed the informed consent form. Afterwards all three secondary tasks were explained in detail and practiced until the experimenter felt that the participant surely had understood the task. The participant was informed that each reference task would be practiced in the simulator as well, before the respective block (Figure 5) was started. Then the participant was informed about the
performance rating scale. It was stressed that only the secondary task performance during the third level should be rated. Driving performance should be rated for the same time period. The participant was then seated in the simulator. The safety routines were explained, and the necessary equipment like the haptic task box and the screen for the visual task was pointed out to the participant. The participant was instructed to drive as he or she usually would on a road of the present type, and that it was not allowed to overtake. It was stressed, however, that it was paramount that the secondary task should be performed as well as possible.
Then the motion system was started and the simulator was placed in driving position. The participant was asked to calibrate the Smart Eye cameras, whereupon the eye tracking profile for the participant was built.
At first the participant drove a training session without secondary tasks in order to get used to the simulator. The training lasted for five minutes, and the participant was asked to brake and
accelerate a couple of times in order to get used to the simulator motion. When the training was finished and the participant did not have any further questions, two baseline sections were driven. They lasted 3.5 minutes each, and the only difference between them was that there was a lead car in one of the baselines and no lead car in the other baseline. The order was balanced between participants.
After the two baseline sections one of the three secondary task blocks started. Each was made up of three sections, one where the participant executed the secondary task while parked (secondary task baseline) and two where the participant executed the secondary task while driving, once with and once without lead vehicle. The order of the secondary task blocks as well as the section order within each block was balanced across participants. Each block started out with a practice session of the secondary task in question. The participant practiced to reach proficiency in the task as long as the experimenter deemed necessary. Within each section the secondary task executions always started with the easiest level, followed by Level 2, and then Level 3. In the sections that involved driving Level 1 was started 30 s after the participant had reached a speed of 75 km/h for the first time. When all three secondary task blocks were finished the participant drove the two baselines once more, with the order balanced across participants.
After each section the participant was asked to rate his or her performance between 1 and 10. In the driving baseline sections only driving was rated, in the secondary task baseline sections only secondary task performance on Level 3 was rated, and in the sections where both driving and secondary task execution took place, both activities were rated. About halfway through the experiment the participants were also asked how they felt they had allocated their attentional resources between driving and secondary task engagement, where applicable. After the last baseline had been driven the simulator was parked, and the participant left the simulator. The participant was thanked and accompanied to the door.
VCC
The procedure at VCC was identical to the procedure at VTI, except that the safety
instructions were different and the eye tracking system was calibrated by the experimenter.
4.7
Research questions and analysis
The study design allowed for within-subjects comparisons for all factors except for the factor
location, which was between-subjects. The research questions touched different levels of
Table 4: Generalised research questions for the study at hand, with motivations. Research Question Motivation for testing this research question.
The PI will change in a consistent manner across participants with driving situation and task level.
Subject effects are limited, results are consistent across participants. sim u lat o r ty p e
The longitudinal PI and the eye-tracking related PI will be more consistent across simulators than the lateral PI.
Earlier research has shown that linear motion in lateral direction affects lateral PI more
(Greenberg, Artz, & Cathey, 2003).
b ase line / b as eline
Driving and driver parameters will not differ between the first and the second set of baselines for the free vehicle situation.
Learning or fatigue effects do not influence the results in a consistent manner.
Driving and driver parameters will not differ between the first and the second set of baselines for the following vehicle situation.
Learning or fatigue effects do not influence the results in a consistent manner.
se con d ar y ta sk p erf o rm an ce
The more difficult the secondary tasks are the more incorrect execution of them will occur.
Performance is influenced by the intrinsic task difficulty of the secondary task (Östlund et al., 2005).
The secondary task performance will differ for the baseline, lead-car- and no-lead-car situation.
The driving situation influences the secondary task performance, as resources have to be shared (Wickens & McCarley, 2008).
d riv in g p erf o rm an ce
The driving performance will differ depending on the secondary task type, and will agree with findings in the literature.
It has been shown that especially visual and cognitive tasks affect driving behaviour differently (Recarte & Nunes, 2000). Purely haptic tasks have not been investigated extensively.
Driving performance will decrease with increasing secondary task difficulty.
It is assumed that driving and the secondary task compete for the same central resource, and increasing demands from one task will decrease performance on the other task (Wickens & McCarley, 2008). su b jec tiv e r at in gs
Cognitive task performance will be rated as better during the secondary task baseline than with concurrent driving.
It is easier to concentrate on the secondary task only as compared to synchronising it with driving. Driving performance will be rated
differently depending on the secondary task type (better for cognitive and haptic than visual).
The participants will feel the performance decrements more for the visual load than for the cognitive and haptic load.
Secondary task performance will be rated differently depending on the driving condition (better for baseline than with concurrent driving).
The hypothesis goes hand in hand with the expected higher performance during secondary task baseline. A better performance is expected to be rated as better.
It was investigated whether the participants changed their behaviour over time, to ensure that later analyses are not influenced by artefacts of that kind. It was also investigated whether the performance on the secondary task differed while performing the secondary task only, as compared to performing it while driving. These analyses established the pre-conditions for the main analyses, which then compared the effect of the three levels of difficulty of the different secondary tasks on driver behaviour, driving behaviour and subjective judgements for driving
with and without a car ahead. It was also investigated whether the performance indicator changed in a similar fashion between participants, which is important for its robustness. Each participant drove one baseline with a car ahead and one baseline without a car ahead before the trials with the secondary tasks, and once more after the trials with the secondary task.
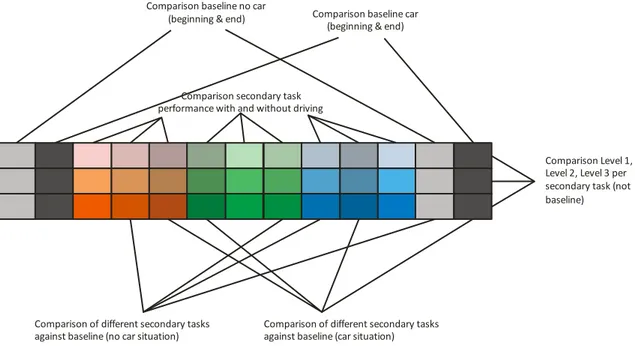
The comparisons (analyses) undertaken are shown in Figure 6. The statistical analyses used an -level of 0.05.
Figure 6: Graphical representation of the analyses. Light grey boxes represent baseline drives without lead car. Dark grey boxes represent baseline drives with lead car. Red, green and blue boxes represent the three different secondary tasks on three levels of difficulty (from unsaturated to saturated colours). The different shadings represent the driving condition under which the secondary task was executed (no black component: secondary task only; slight black component: driving without lead car; heavy black component: driving with lead car).
4.7.1 Performance indicator classification scheme
PIs for analysis were identified by building a PI classification scheme (Table 5). For the first phase of the project only control level PIs were used, that is, strategic and tactical decisions were not considered. This is also due to the study design used, which did not require any strategic or tactical decisions on the part of the driver.
Comparison baseline no car
(beginning & end) Comparison baseline car (beginning & end)
Comparison secondary task performance with and without driving
Comparison Level 1, Level 2, Level 3 per secondary task (not baseline)
Comparison of different secondary tasks against baseline (no car situation)
Comparison of different secondary tasks against baseline (car situation)
Table 5: Classification of the PIs into different categories.
PI classification L e v e l 1
Driver behaviour Driver opinion Driving behaviour
L e v e l 2 d ri ve r i n te rn al in tera ct io n w ith ve h ic le in tera ct io n w ith se co n d ar y t as k in tr o sp ec ti ve (s ta te /o w n p er fo rman ce ) exte rn al la tera l c o n tr o l lo n gi tu d in al co n tr o l L e v e l 3 gaze direction - PRC - mean AttenD - AttenD warning - energy radius eyelid head direction electro-physiology hand position other steering wheel - steering wheel reversal rate - steering wheel entropy gas pedal - throttle hold rate - throttle hold diff brake pedal clutch pedal indicators, windscreen wipers, etc. embedded nomadic on-line - estimation of own driving performance - estimation of own performance on secondary tasks off-line on-line off-line related to road - mean. lat. position - std lat. position - modified std lat. pos. - number of lane crossings - lane departure area - lane departure time - lane departure distance related to other road users related to road - mean speed - max speed - speeding index - speeding area related to other road users - mean time Headway (THW) - std THW
4.7.2 Performance indicator definitions
Each PI is calculated for each box in Table 6. For the different tasks, data from the 30-second segments are extracted and the PI is calculated based on data from this particular segment. In the baseline cases, both in the beginning and in the end of the experiment, the 30-second segments are extracted at corresponding locations along the road. In total, 26 different PIs are derived. These are defined in Table 6.
The PIs that are based on eye tracking are only derived if the gaze quality is above 0.2 for at least 70 % of the data in the segment. The vertical and horizontal gaze directions were derived as a weighted mean of data from the left and the right eye. The dominant eye was given a weight of two plus the quality value of that eye unless no tracking was available. In that case
the weight was set to zero. The other eye was given a weight corresponding to the quality value of that eye. The fused gaze direction signal was subsequently filtered by a 0.5 sec wide interpolating median filter. A median filter was chosen since it does not smear out the edges associated with saccades. Interpolation was used to fill out short sequences of low quality data for example due to eye blinks. The interpolation was implemented by simply ignoring data with quality below 0.2 in the median calculation. Low quality data with duration longer than the window width were marked as missing values.
Table 6: PI (performance indicator) definitions.
mean speed The mean velocity in the current segment. max speed The maximum velocity in the current segment.
std speed The standard deviation of velocity in the current segment. speeding index The speeding index in the current segment. Speeding index is
calculated according to the Uppåt project (Hjälmdahl, Dukic, &
Pettersson, 2009). Basically it quantifies how much the driver is violating the speed limit and large transgressions are punished more severely (vl
is the speed limit):
∫ ((𝑣(𝑠) 𝑣𝑙+ 3) 3 − 1) 𝑠𝑡𝑜𝑝𝑠𝑒𝑔𝑚𝑒𝑛𝑡 𝑠𝑡𝑎𝑟𝑡𝑠𝑒𝑔𝑚𝑒𝑛𝑡 𝑑𝑠 𝑡𝑜𝑡𝑎𝑙𝑠𝑒𝑔𝑚𝑒𝑛𝑡𝑑𝑖𝑠𝑡𝑎𝑛𝑐𝑒⁄ speeding area The area under the velocity curve where the speed exceeds the speed
limit. In the sketch below this is indicated by the grey area where the velocity exceeds the speed limit.
mean THW The mean time headway in the current segment. Time headway is defined as the distance from the front of the driven vehicle to the rear of the vehicle ahead divided by the velocity of the own vehicle. In the sketch below THW = d/vown.
min THW The minimum time headway in the current segment.
mean lat pos The mean lateral position in the current segment. The lateral position is measured from the centre of the lane.
std lat pos The standard deviation of lateral position in the current segment (also SDLP).
mod std lat pos Modified standard deviation of lateral position according to the AIDE project (Östlund et al., 2005). The lateral position time series is filtered with a 0.1 Hz 2nd order Butterworth high pass filter before the standard
deviation is calculated. The high pass filter removes any variations of longer periods than 10 seconds.
# lane crossings The total number of lane deviations where the outer margin of the left or the right wheel crosses the inside of the line marking for the lane boundaries.
lane departure area The total area that any part of the vehicle is outside the lane boundaries in the current segment. The area is calculated as the integral of the lateral position time series according to the grey areas in the sketch below.
lane departure time The total time that any part of the vehicle is outside the lane boundaries in the current segment.
lane dept. distance The total distance that any part of the vehicle is outside the lane boundaries in the current segment.
PRC 8 deg radius The percentage of gaze data that lies within a circle with 8° radius according to Victor et al. (2005). The data are centred around the median value in the horizontal and vertical gaze direction (separately). In the sketch below PRC is the number of gaze data points (dots) inside the circle divided by the total number of dots.
mean AttenD The mean AttenD buffer value in the current segment. AttenD is an algorithm that estimates how attentive the driver is based on where he/she is looking. The algorithm is implemented according to Kircher and Ahlstrom (2012). In the sketch below the driver is considered attentive when the buffer is full. Every time the driver looks away the buffer is decreased and if it reaches zero (stars) the driver is considered inattentive.
# AttenD warning The number of times that the driver is considered inattentive according to the AttenD algorithm (Kircher & Ahlstrom, 2012). Note that the driver is not actually given a warning, it is just the occasions where a warning should have been given that are indicated by this PI.
energy radius The radius of an ellipse covering 90 % of the gaze data. The radius r defines the horizontal radius of the ellipse whereas the vertical radius is defined as r/2. In the sketch below, the energy radius equals the r-value that defines an ellipse that covers 90 % of the dots.
longest glance The time duration of the longest consecutive sequence of gaze data that is directed outside a circle with 20° radius. In the sketch below there are four sequences of data outside the circle (light grey part of the scan path). The longest sequence outside the circle is the longest glance.
eyes-off-road glances
The number of glances that are directed outside a circle with 20° radius. In the sketch above there are four eyes-off-road glances.
eyes-off-road time The percentage of accumulated time that the gaze is directed outside a circle with 20° radius.
throttle hold rate Throttle hold rate is calculated based on the position of the accelerator pedal (measured in per cent) according to Green et al. (2007). If the throttle position deviates with less than 0.2% in a one-second wide sliding window, a throttle hold is marked at this particular window location. The throttle hold rate is then determined as the percentage of throttle hold instances within the current segment.
throttle hold diff Similar to throttle hold rate, but throttle hold diff is defined as when the differentiated throttle position is zero.
stw reversal rate The number of steering wheel reversals larger than 1° (Östlund et al., 2005). Before counting reversals, the steering wheel angle is low pass filtered with a 0.6 Hz 2nd order low pass Butterworth filter (also SWRR).
stw entropy Steering wheel entropy represents the predictability of steering wheel movements (Boer, Rakauskas, Ward, & Goodrich, 2005). The steering wheel signal is down-sampled to 4 Hz and the residuals from a one-step prediction based on autoregressive modelling are used to determine the entropy.