http://www.diva-portal.org
Postprint
This is the accepted version of a paper published in Social Psychology and Personality Science. This paper has been peer-reviewed but does not include the final publisher proof-corrections or journal pagination.
Citation for the original published paper (version of record): Eriksson, K., Simpson, B. (2014)
Poverty Prefers Company.
Social Psychology and Personality Science, 5(3): 319-325 http://dx.doi.org/10.1177/1948550613497985
Access to the published version may require subscription. N.B. When citing this work, cite the original published paper.
Permanent link to this version:
1
Poverty prefers company
Kimmo Eriksson, Stockholm University, Stockholm, Sweden, and Mälardalen University, Västerås, Sweden
Brent Simpson, University of South Carolina, Columbia, South Carolina, USA
Abstract:
In three web-based experiments we show that both actual poverty and experimentally induced (imagined) poverty create a preference for greater inequality. Study 1, a cross-national
comparison between Americans and Swedes, showed that respondents who were actually poor and those who were experimentally induced to imagine that they were poor tended to express a heightened preference for greater inequality, and for a higher proportion of poor citizens. Study 2 replicated the effects using different procedures. Study 3 showed that imagining oneself being poor increases preferences for a greater proportion of poor people, but imagining oneself being rich does not increase preferences for a greater proportion of rich people. This poverty-prefers-company effect might affect support for policies aiming at reducing the number of poor people.
2
Poverty Prefers Company
Economic inequality has a range of deleterious outcomes at the societal and individual levels (Oishi, Kesebir & Diener, 2011; Wilkinson & Pickett, 2009, 2010). Moreover, citizens of highly unequal countries such as the U.S. seem to prefer less inequality than they believe exists
(Eriksson & Simpson, 2012; Norton & Ariely, 2011). Why then is there so little democratic pressure on U.S. policy makers to implement programs that would reduce economic inequality? Particularly puzzling, especially from a rational economic standpoint, is why those who suffer the most from ongoing systems of inequality don’t press for change (Della Fave, 1980; Marx & Engels, 1983).
Some research suggests that even the poor tend to think that wealth allocation via markets is fair and that procedural justice is more important than distributive justice (Della Fave, 1980; Jost et al. 2003; Kagan, 2011; Tyler, 2011). Our aim is to investigate a heretofore unrecognized and complementary reason why those who are most disadvantaged by inequality may not support policies aimed at reducing stratification: poverty prefers company. We know from prior work, on resource distributions in small groups, that people are averse to being alone at the bottom end of the distribution, such that they prefer company at the bottom end even if it means a more unequal distribution overall (Eriksson & Simpson, 2011; Kuziemko, Buell, Reich & Norton, 2011). Here we explore whether a related phenomenon may occur at the societal level. Specifically, we address whether there is a tendency among the poor to prefer to belong to a larger segment of society—outweighing the aversion to the increased inequality that would typically coincide with a larger number of poor citizens or households. In other words, when poverty is salient we
3
tentatively predict that individuals might be more apt to prefer a society where many others are also poor. As a result, those whom we would otherwise expect to be the most concerned with economic inequality might paradoxically be least interested in policies aimed at reducing the number of poor people.
By demonstrating a poverty prefers company effect, we aim to contribute to the growing social psychological literature on the myriad – and often paradoxical -- ways in which social class impacts preferences, cognitions, and beliefs (see Kraus, Piff, Mendoza-Denton, Rheinschmidt, & Keltner, 2012). Recent work has shown that members of lower social classes are more apt to explain personal and social outcomes in contextual versus dispositional terms (Kraus, Piff, & Keltner, 2009) and to act more ethically (Piff, Kraus, Côté, Cheng, & Keltner, 2012) than members of higher social classes. Other studies in this vein have shown how social class affects responses to social and economic uncertainty. For instance, while members of lower social classes respond to chaotic social environments by becoming more communally oriented, social chaos leads those in higher social classes to place increased emphasis on wealth (Piff, Stancato, Martinez, Kraus, & Keltner, 2012). Further, Smith and colleagues (2012) found that social class impacts responses to economic threat (losing a job), with those from higher social classes activating broader, more diverse, contacts in response to threat and those from lower social classes activating fewer and more constrained networks in response to the threat of job loss. Given that new jobs are generally found through weak, or distal, ties (Granovetter, 1973) the Smith et al. findings provide a glimpse into how class-based differences in social cognition may buttress extant class systems. As we detail more fully below, the poverty prefers company effect may provide another mechanism through which the social class system can be self-reinforcing.
4
Overview of Studies
We tested our prediction in three web-based experiments that allowed us to examine both actual poverty and an experimental manipulation of (imagined) poverty. The first two studies employed the same two dependent measures. First, we had participants indicate their ideal percentage of poor in a society. Second, participants indicated whether they would prefer to join a nation with 34% poor people or with 10% poor people. Given a definition of “poor” as a family receiving an income of less than half of the national average, these income distributions correspond to the United States and Sweden, respectively.
To address whether preferences correlated with actual poverty, we asked participants to which income category they belonged. To establish the hypothesized causal relationship between poverty and preferences for inequality, we also introduced a between-subjects manipulation. In one condition, participants were asked to state their national income distribution preferences assuming that they would be poor. Control conditions in the first study asked participants to imagine either that they would be rich or that they would not know which income category they would belong to. In the second study, the control condition simply asked participants to imagine that they would belong to their current (actual) income category.
A third study was designed to disentangle the poverty-prefers-company effect from an
alternative, everyone-prefers-company, effect. To this end, Study 3 respondents made choices between four pairs of national income distributions where the proportions or poor and rich people were manipulated independently.
Study 1 Method
5
An online survey was completed by representative samples of 1,058 American (51% female, mean age 40 years) and 1,060 Swedish respondents (50% female, mean age 42 years).1 Each
respondent was assigned to one of three conditions described below. All respondents completed six measures in the following order:
Preferred Income Distribution. We presented income distributions as the relative sizes of four categories, explained to respondents as follows:
Poor: individuals whose income is less than half the national average (i.e. income less
than 50% of average income).
Lower Middles: those with incomes between 50% and 100% of the national average.
Upper Middles: those with incomes between 100% and 200% of the national average.
Rich: those with incomes greater than 200% of the national average.
Pie charts displayed the income distribution in two nations (Fig. 1). Depending on condition, respondents were asked to imagine that, whichever of these nations they joined, they would either “be in the poor category” (imagine-poor condition), “be in the rich category” (imagine-rich condition), or “be randomly assigned to a place in the distribution” (veil-of-ignorance condition). Ideal Percentage of Poor. Respondents then indicated what proportion of their “ideal society” would be composed of poor people. We reminded them that “if some people earn more than average, then others earn less than average.”
1 The survey was conducted by surveysampling.com. Respondents were drawn from large panels; we do not have
6
Income Category and Political Views. Respondents indicated which of the four national income categories they belong to, and classified their political views on a five-point scale (from very conservative to very progressive).
The questionnaire also included two items that checked comprehension of the definition of the income categories and pie diagrams.For the former, respondents were asked which of the three options describes the upper middle category: (1) individuals whose income is less than, but no less than half, the national average; (2) individuals whose income is more than, but not more than double, the national average; (3) individuals whose income is more than double the national average. To check comprehension of the pie diagrams, respondents were asked to indicate in which of the two nations it is most common for people to have incomes close to the national average.
Results
Comprehension checks
About 50% in each country and condition failed at least one of the two comprehension checks. The finding that about half of all respondents did not properly understand these basics is
remarkable, but consistent with poor comprehension of nearly identical questions in other studies (Eriksson & Simpson, 2012; Eriksson & Simpson, 2013). It is also consistent with general
findings of poor financial literacy in large segments of the population (Lusardi & Mitchell, 2008).
Because comprehension of the income categories and the diagrams was essential for our dependent measures, respondents who failed any comprehension check were removed from further analysis, leaving 507 respondents from the U.S. and 540 from Sweden. This selection of respondents did not change the age or gender composition, but slightly biased the sample
7
towards people with college education (from 52.7% to 56.3%) and towards those with more progressive political views (from 24.6% to 29.1%). We know of no reason why selection effects introduced by excluding those who failed the comprehension checks would drive the differences between conditions we report below. Nonetheless, we designed the second study to avoid these comprehension difficulties.
Preferred income distribution and ideal percentage of poor
Recall that we measured preferences for inequality in two ways: the choice of preferred income distribution (U.S./Sweden, dummy coded 1/0) and the ideal percentage of poor. As expected, the two measures were correlated (U.S. sample: r = .21, p < .001; Swedish sample: r = .23, p < .001).
Table 1 reports descriptive statistics per condition and country for these measures. The table shows two clear patterns: First, preferences for inequality were greater in the U.S. sample than in the Swedish sample. More relevant to our theoretical arguments, preferences for higher levels of inequality were also greater in the imagined poverty condition than in either of the two control conditions.2 Table 2 reports logistic and linear regression analyses for the binary and continuous preference measures, respectively, establishing the statistical significance of these patterns.3
2There was also a weaker but systematic difference between the two control conditions, with participants in the
imagine-rich condition expressing preferences for higher inequality than those in the veil of ignorance condition Note that the more unequal country of Figure 1 not only has a larger proportion of poor, but also a larger proportion of rich citizens. The fact that those in the imagine rich condition also expressed a heightened preference for inequality, relative to the veil of ignorance condition, might therefore suggest that those in the imagine-rich condition also prefer company (an “everyone-prefers-company” effect), or that they prefer more poor people. Study 3 ruled out this competing mechanism by orthogonally manipulating the proportion of rich and poor.
3 A two-way ANOVA for the continuous preference measure revealed no significant interaction between country
8
These results were unchanged when a range of control variables – age, gender, college education and political views – were included. (These analyses are available upon request.)
A binary measure of actual poverty was obtained from participant's income category by coding poor participants as 1 and others as 0. We also analyzed the effect of actual poverty in the veil-of-ignorance condition where participants were not told to which income category they would belong. In the U.S. sample (N = 173, out of which 42 were poor), 33% of poor respondents preferred the more unequal income distribution compared to just 12% of participants in the non-poor categories, an odds ratio of 3.59, p = .002. In the Swedish sample (N = 176, out of which only 20 were poor), 10% of poor respondents preferred the more unequal income distribution compared to 6% of participants in the non-poor categories, an odds ratio of 1.62; however, the extremely small cell size makes statistical tests meaningless. Unexpectedly, actual poverty did not correlate with ideal percentage of poor in either country, a point to which we return in the discussion below.
Discussion
In our first study, only a small minority (12%) of American respondents who were not poor preferred the more unequal U.S.-type income distribution to the Swedish one. However, among poor respondents, there was a substantially larger tendency to prefer the more unequal
distribution. We found similar effects for the experimental manipulation: compared to those in the veil of ignorance condition, American respondents who were asked to imagine that they would be poor were more than twice as likely to express a preference for the highly unequal U.S. distribution. This tendency was even larger among Swedish respondents, who expressed a three-fold increase in their preferences for the more unequal system when asked to imagine that they would be poor. These results strongly support our proposition that poverty prefers company.
9
The experimental manipulation yielded similar effects for respondents' ideal percentage of poor. For this measure, however, we did not see a correlation with actual poverty under a veil of ignorance. It is likely that participants' current income level was insufficiently salient in that condition, since they were asked to imagine that they would be randomly assigned to a place in the distribution. A second limitation of the first study was the large exclusion rate, due to
respondents’ limited comprehension of wealth presented as percentiles (see Eriksson & Simpson, 2012). Our second study sought to replicate the Study 1 findings with a design that circumvented these two concerns.
Study 2 Method
An online survey was completed by a sample of 550 American adults (47% female, mean age 32 years; 56% with college education). Participants, recruited from the Amazon Mechanical Turk (mturk.com), were assigned to one of two conditions described below.
Our first goal was to make income categories easier for respondents to understand. Thus, in Study 2, we defined income categories in terms of absolute levels, as recent work shows substantially higher comprehension rates using this approach over the percentile approach of Study 1 (Eriksson & Simpson, 2012). That is, Study 2 defined household income in absolute terms as follows: poor: less than $25,000; lower middles: $25,000−$50,000; upper middles: $50,000−$100,000; rich: more than $100,000. Respondents were shown the same pie charts as in Study 1 (Fig. 1). They were then asked to indicate their own household's income category, before completing the same measures of preferred income distribution and ideal percentage of poor as in Study 1. When completing these measures, respondents were asked to imagine that
10
they would either “be in the poor category” (imagine-poor, N = 200) or “be in the same category you stated you belong to today” (imagine-actual, N = 350).4
Finally, to assess understanding of income distributions given in the pie diagrams, respondents were asked to indicate which of the two nations has “the least unequal income distribution (i.e., fewer poor people and fewer rich people)?”
Results
Comprehension checks
Only 12% of participants failed the comprehension check. Excluding these participants resulted in a sample of N = 484 for the analyses reported below.
Preferred income distribution and ideal percentage of poor
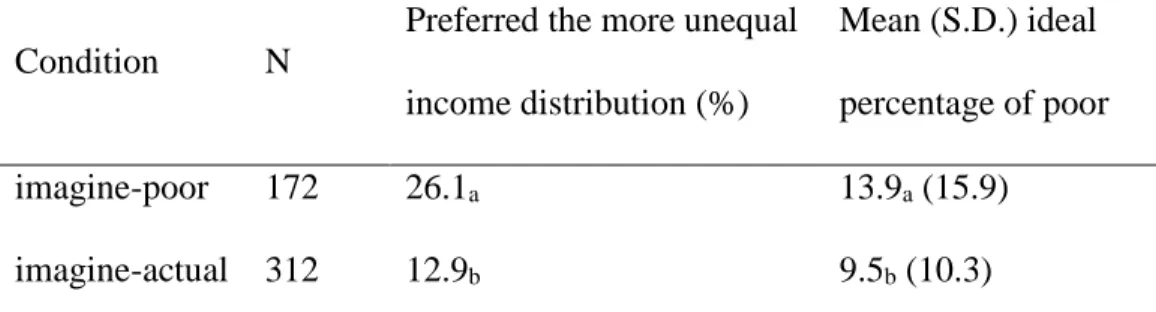
As in Study 1, preference for the more unequal income distribution was correlated with higher ideal percentage of poor, r = .46, p < .001. Table 3 reports descriptive statistics for these two measures of preferences for inequality. Compared to the imagine-actual-income condition, the imagine-poor condition had a higher proportion of participants preferring the more unequal income distribution (odds ratio 3.06, p < .001) and a higher average ideal percentage of poor (r = 0.16, p < .001). Within the imagine-actual-income condition (N = 312), actual poverty was similarly related to a higher proportion of participants preferring the more unequal income distribution (odds ratio 2.75, p = .008) and a higher average ideal percentage of poor (r = 0.15, p = .008). All these results were essentially unchanged when control variables were included (analyses available upon request).
4 We assigned a larger number of participants to the own income category condition in order to achieve the
11
Discussion
Study 2 provided additional support for the poverty prefers company effect. However, the first two studies do not allow us to distinguish a tendency for poor people to prefer company from a more general effect of everyone preferring company. Specifically, just as imagining membership in a poor category might create a preference for a larger poor population, it might be that
imagining membership in the rich category also creates a preference for a larger rich population. An additional weakness of the first two studies was potential ambiguity about the consequences of category size. Participants might have assumed that a larger poor population larger would be better off than a smaller one. For instance, they might have assumed, for whatever reason, that each individual poor person would be better off when there were many others than when there were fewer others (e.g., because a larger share of societal resources would be devoted to helping the poor). Or they might have assumed that a large population of poor would be more apt to benefit from collective action or other changes aimed at improving the lot of the poor. We designed the third study to address these issues.
Study 3 Method
300 American adults (37% female, mean age 31 years; 69% with college education), recruited from the Amazon Mechanical Turk, participated in Study 3. Participants were randomly assigned to one of three conditions: imagine-poor, imagine-rich, or imagine-actual-income.
The definition of income categories and comprehension checks of pie charts followed those of Study 2. Respondents were then presented with four new pairs of income distributions, presented in pie charts. Each distribution had the sizes of the rich and poor categories at either a low level
12
(9%) or a higher level (15%). The middle categories were sized such that the median was always the cut-point between the lower and upper middles. Specifically, the four pairs were as follows:
Pair 1: [9% poor : 41% lower mid. : 41% upper mid. : 9% rich] vs. [9% : 41% : 35% : 15%]
Pair 2: [15% : 35% : 35% : 15%] vs. [15% : 35% : 41% :9%]
Pairs 1 and 2 test preferences for proportions of rich when the proportion of poor is fixed at a low (Pair 1) or high (Pair 2) level. Pairs 3 and 4 test preferences for proportions of poor when the proportion of rich is fixed at a low (Pair 3) or high (Pair 4) level:
Pair 3: [9% : 41% : 41% : 9%] vs. [15% : 35% : 41% : 9%]
Pair 4: [15% : 35% : 35% : 15%] vs. [9% : 41% : 35% : 15%]
For each pair, respondents indicated which nation they would rather join, or if they were perfectly neutral. To remove ambiguity about possible consequences of category size, the instructions stated: “When indicating your preference, assume that the standard of living for any given category member will remain constant, regardless of the size (or number of members) of that category. Further assume that there will no policies or redistribution efforts that would impact the standard of living of category members.” For all choices, respondents were asked to imagine that they would either “be in the poor category” (imagine-poor), “be in the rich
category” (imagine-rich) or “be in the same category you currently belong to” (imagine-actual-income). Participants remained in the same income condition (poor, rich, or actual) for all four choices.
Results
Comprehension checks
Fourteen participants failed the comprehension check and were excluded, leaving N = 286 participants.
13
Preferred income distribution
Each of the four choices was conceived as a choice between a high or low level of the manipulated category (either rich or poor). Responses were scored 1 for preference for high level, 0.5 for neutral, and 0 for preference for low level. The two measures for preference for many poor were then averaged to a single preference-for-many-poor index (Cronbach’s α = .58), and similarly for the two measures for preference for many rich (α = .49). Preferences for many rich and many poor were uncorrelated (r = -.03, p = .57). Descriptive statistics for the two preference indices for each of the three conditions are reported in Table 4.
An ANOVA showed that preferences for many poor differed significantly between the three conditions, F(2, 283) = 6.88, p = .001. Consistent with Studies 1 and 2, as shown in Table 4, the preference for many poor was higher in the imagine-poor condition than in any of the other conditions.
In contrast, preferences for many rich did not differ significantly between conditions, F(2, 283) = 1.07, p = .35. Specifically, the preference for many rich was no different in the imagine-rich condition than in the other conditions.5 The statistical significance of the interaction between condition (imagine rich, poor, or actual income) and measure (preference for rich versus poor) was confirmed in a three-by-two mixed ANOVA, F(2, 283) = 4.46, p = .01.
Discussion
Study 3 replicated results from Studies 1 and 2 using a design that allowed us to address two important alternative explanations: that the findings were driven by an “everyone prefers
5 Separate ANOVAs for each of the four individual measures yielded similar results: Regardless of whether the
14
company” effect, and that poverty prefers company because larger categories of poor promise better conditions for the poor. The findings from Study 3 strongly support the poverty prefers company prediction, allowing us to rule out these alternatives.
General Discussion
In this paper we have explored whether poverty might prefer company, a possibility suggested by prior work on resource distributions in small groups (Eriksson & Simpson, 2011; Kuziemko et al, 2011). Three web-based studies supported this hypothesis. When participants imagined being poor, their preferences tended to shift towards greater inequality. Similarly, when
participants imagined they would stay in their current income category, poor participants tended to prefer greater inequality than participants in higher income categories.
On the surface, our findings might appear to run counter to Piff and colleagues’ (2010) recent demonstration that the poor tend to be more egalitarian and, as a consequence, more generous than their counterparts from higher social classes. But the ostraphobia (Eriksson & Simpson, 2011) and last place aversion (Kuziemko et al., 2011) arguments on which we based our predictions posit an aversion to being alone at the bottom of a rank or distribution. Thus, while Piff and colleagues (2010) posit a linear (and negative) relationship between social class and helping, our findings deal specifically with members of the bottom social class. Moreover, even among those at the bottom, a preference that others are similar in status need not imply less willingness to engage in the routine, everyday helping behaviors of the type investigated by Piff
< .01), with the imagine-poor condition yielding the highest preferences for many poor. On the other hand, across both proportions of poor, there was no significant effect of condition on preferences for many rich (both ps > .39).
15
et al. More generally, offering to care for a peer’s child or providing a temporary monetary loan to those in similar circumstances does not generally, if ever, improve the beneficiary’s social class position. In short, our arguments and findings complement, rather than contradict recent findings in the social psychology of social class.
Importantly, our first study showed that the poverty prefers company effect held among citizens of both the U.S. and Sweden. Among Western nations, the U.S. and Sweden have very high and very low levels of inequality, respectively. We found that Swedes and Americans tend to have quite different notions of “ideal” levels of inequality, suggesting that individuals’ preferences tend to adapt to the realities of the society in which they live. Yet manipulating (imagined) poverty had similar effects on Americans and Swedes’ preferences for inequality. Moreover, these effects were independent of respondents’ political views, age, education, or gender. This robustness across and within cultures suggests that the poverty prefers company effect may be relatively universal.
While the goal of our current work was to demonstrate the poverty prefers company effect, rather than an explicit mechanism, Study 3 allowed us to narrow down the possible causes of this effect. To begin with, the effect remained even when instructions ruled out any implicit assumptions that larger classes of poor will be more successful at reducing inequality or otherwise improving their lot. Further, results of orthogonal manipulations of the sizes of the poor and rich categories confirmed that the effect is not driven by a tendency for everyone to prefer company. Rather our findings suggest that an increase in the preferred size of one’s own income category is specific to the poor.
Why might the poor be especially apt to prefer company? One possibility is that being part of a larger category allows for external vs. internal attributions about one’s circumstances. For
16
instance, when many are poor, I can tell myself (and others) that society offers too few people opportunities to get ahead. When fewer are poor, I may be forced to question whether I have the talents and abilities required for success. Another, non-competing, possibility is suggested by recent work on last place aversion (Kuziemko et al., 2011) or ostraphobia (Eriksson & Simpson, 2011) which shows that members of small groups who receive the smallest rewards prefer redistributions where other group members receive equally small rewards, even though such redistributions tend to enhance overall inequality in the group.
Whatever the exact cause, we believe that the poverty prefers company effect has important implications. For instance, contrary to the intuition that poor people would be the strongest supporters of policies to reduce poverty, our findings suggest that poverty may make people less, not more, interested in reducing the number of poor people. If so, efforts to mobilize the poor to reduce inequality might be more effective when they are framed as efforts to improve the lots of individuals rather than reducing the number of poor as a whole.
References:
Baumeister, R.F., & Leary, M.R. (1995). The need to belong: Desire for interpersonal attachments as a fundamental human motivation. Psychological Bulletin, 117, 497-529. Cruces, G, Truglia, R.P. & Tetaz, M. (2011). Biased perceptions of income distribution and preferences for redistribution: Evidence from a survey experiment. Available at SSRN: http://ssrn.com/abstract=1817906
Della Fave, R. (1980). The meek shall not inherit the earth: Self-evaluations and the legitimacy of stratification. American Sociological Review, 45, 955–971.
Eriksson, K., & Simpson, B. (2011). Perceptions of unfairness in allocations between multiple recipients. Cognitive Psychology, 62, 225–244.
17
Eriksson, K., & Simpson, B. (2012). Building a better measure of perceived inequality. Judgment and Decision Making, 7, 741-745.
Eriksson, K., & Simpson, B. (2013). The available evidence suggests the percent measure should not be used to study inequality: Reply to Norton and Ariely. Judgment and Decision Making, in press.
Granovetter, M. S. (1973). The strength of weak ties. American Journal of Sociology, 1360-1380.
Jost, J.T., Pelham, B.W., Sheldon, O., & Sullivan, B.N. (2003). Social inequality and the reduction of ideological dissonance on behalf of the system: Evidence of enhanced system justification among the disadvantaged. European Journal of Social Psychology, 33, 13-36.Kraus, M. W., Piff, P. K., & Keltner, D. (2009). Social class, sense of control, and social explanation. Journal of personality and social psychology, 97, 992-1004.
Kraus, M. W., Piff, P. K., Mendoza-Denton, R., Rheinschmidt, M. L., & Keltner, D. (2012). Social class, solipsism, and contextualism: How the rich are different from the poor.
Psychological Review, 119, 546.
Kuziemko, I., Buell, R. W., Reich, T., & Norton, M. I. (2011). Last-place aversion: Evidence and redistributive implications (No. w17234). National Bureau of Economic Research.
Lusardi, A., & Mitchell, O. (2008). Planning and financial literacy: How do women fare? American Economic Review, 98, 413-417.
Marx, K., & Engels, F. (1983). Collected works. Vol. 10, Marx and Engels: 1849-1851. Lawrence & Wishart.
Norton, M., & Ariely, D. (2011). Building a better America—one wealth quintile at a time. Perspectives on Psychological Science, 6, 9–12.
18
Oishi, S., Kesebir, S., & Diener, E. (2011). Income inequality and happiness. Psychological Science, 22, 1095–1100.
Piff, P. K., Kraus, M. W., Côté, S., Cheng, B. H., & Keltner, D. (2010). Having less, giving more: The influence of social class on prosocial behavior. Journal of Personality and Social Psychology, 99, 771-784.
Piff, P. K., Stancato, D. M., Côté, S., Mendoza-Denton, R., & Keltner, D. (2012). Higher social class predicts increased unethical behavior. Proceedings of the National Academy of Sciences, 109(11), 4086-4091.
Smith, E. B., Menon, T., & Thompson, L. (2012). Status differences in the cognitive activation of social networks. Organization Science, 23, 67-82.
Tyler, T. (2011). Procedural justice shapes evaluations of income inequality: Commentary on Norton and Ariely (2011). Perspectives on Psychological Science, 6, 15–16.
Wilkinson, R. G., & Pickett, K. E. (2009). Income inequality and social dysfunction. Annual Review of Sociology, 35, 493– 511.
Wilkinson, R., & Pickett, K. (2010). The spirit level: Why equality is better for everyone. London, England: Penguin.
19 Tables:
Table 1. Descriptive statistics of dependent measures (Study 1)
Country Condition N
Preferred the U.S. income distribution (%) Mean (S.D.) ideal percentage of poor U.S. imagine-poor 166 35.5a 21.2a (24.7) imagine-rich 168 24.4b 14.7b (19.5) veil-of-ignorance 173 17.3b 13.4b (16.7) Total 507 25.6 16.4 (20.8) Sweden imagine-poor 185 22.2a 10.9a (18.0) imagine-rich 179 11.7b 6.9b (11.9) veil-of-ignorance 176 6.8b 5.7b (9.0) Total 540 13.7 7.9 (13.7)
Note. Entries in a given column with different subscripts significantly differ according to Holm-Bonferroni post-hoc tests.
20
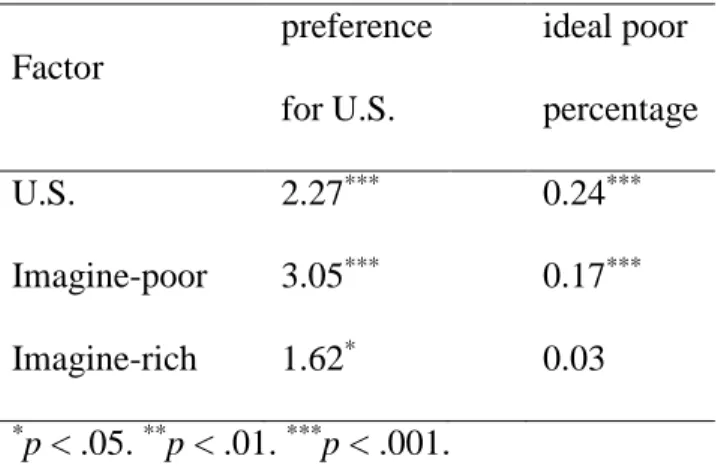
Table 2. Logistic regression predicting preference for the U.S. income distribution and linear regression predicting ideal percentage of poor (Study 1)
Factor preference for U.S. ideal poor percentage U.S. 2.27*** 0.24*** Imagine-poor 3.05*** 0.17*** Imagine-rich 1.62* 0.03 *p < .05. **p < .01. ***p < .001.
Note. Entries are odds ratios from logistic regression (left column; Nagelkerke R2 = .08) and standardized coefficients from linear regression (right column; adjusted R2 = .08).
21
Table 3. Descriptive statistics of dependent measures per condition (Study 2)
Condition N
Preferred the more unequal income distribution (%)
Mean (S.D.) ideal percentage of poor
imagine-poor 172 26.1a 13.9a (15.9)
imagine-actual 312 12.9b 9.5b (10.3)
22
Table 4. Descriptive statistics of dependent measures (Study 3)
Condition N
Mean (S.D.) preference for many poor
Mean (S.D.) preference for many rich
imagine-poor 94 .25a (.36) .36a (.37)
imagine-rich 95 .09b (.22) .38a (.39)
imagine-actual-income 97 .14b (.29) .44a (.38)
Note. Entries in a given column with different subscripts significantly differ according to Holm-Bonferroni post-hoc tests.
23
Figure captions:
Fig. 1. The two income distributions presented in the survey, modeled on Sweden (left) and the U.S. (right).