VTI meddelande
No. 788A - 1996
Evaluation of CMA/NaCl mixture
Effect on road condition/friction, ice melting capacity, corrosion and effect on concrete
VTI meddelande
No. 788A + 1996
Evaluation of CMA/NaCl mixture
Effect on road condition ice melting capacity, corrosion and effect on concrete
Anita lhs, Kent Gustafson and Kerstin Persson
an
Swedish National Road and / Transport Research Institute Cover: C. Tonstrom, Mediabild
Publisher: Publication:
VTI Meddelande 788A
Published: Project code:
Swedish National Road and 1996 60161
A Transport Research Institute
S-581 95 Linkoping Sweden Project:
Test with mixture of CMA and NaCl Printed in English 1997
Author: Sponsor:
Anita Ihs, Kent Gustafson and Kerstin Persson Swedish National Road Administration
Title:
Evaluation of a CMA/NaCl-mixture.
Effect on road condition/friction, ice melting capacity, corrosion and impact on concrete.
Abstract
Together with plowing and sanding, chemical deicing and deicing agents are important tools for highway snow and ice control. The most commonly used deicing agent is sodium chloride (NaCI), and as such it is effective, easy to handle and inexpensive. Many negative and often costly side effects, such as corrosion and damage to vegetation and ground water have, however, been recognized over the years. Extensive research has therefore been conducted to find alternatives. Calcium magnesium acetate (CMA) is an alternative deicing agent which has given very promising results in laboratory and field tests. The most significant impediment to its use is its high price, which is more than 20 times that of NaCl. To reduce the cost but still benefit from the positive effects with CMA tests have been conducted with CMA/NaCl mixtures. In 1993 the Swedish National Road and Transport Research Institute initiated a research project of testing and evaluating a 20/80 weight-% CMA/NaC mixture. The field evaluation was conducted during the winters 1993/94 and 1994/95 on highway E4 near Nykoping, County of Sodermanland, and included both friction measurements and corrosion tests. The laboratory testing, mainly done at the Swedish National Testing and Research Institute, included corrosion tests and freeze/thaw testing on cement concrete. The laboratory tests showed that the addition of CMA to NaCl does reduce the corrosion of steel and the scaling of concrete. The corrosion of steel is reduced also according to the results from the field tests, but not to the same extent as in the laboratory tests. Furthermore, the same deicing could be obtained with the CMA/NaCl mixture as with NaCl.
ISSN: Language: No. of pages:
Foreword
In cooperation with the National Swedish Road Administration, the National Swedish Road and Transport Research Institute (VTT) has for many years been engaged on research and development projects to test and evaluate salting methods and alternative deicing agents. Over the period 1985-1990 the MINSALT programme was carried out in which a number of alternatives to NaCl as deicing agent were studied. One agent which was investigated in greater detail was CMA, calcium magnesium acetate. Its melting capacity, corrosive effect and effect on cement concrete were subjected to particular study, and the results showed that the agent has favourable properties but is very expensive.
In 1993, the Road Administration commussioned VTI to start a research project with the object of testing and evaluating a mixture of CMA and salt (NaCl) as deicing agent. Evaluation comprised both field trials and laboratory tests. Field trials were made during two winters, 1993/94 and 1994/95, using a 20/80% by weight CMA/NaCl mixture. This report sets out the results of these investigations. In Bulletin No 789 a state of the art report is given concerning CMA and its effects. This bulletin is based on an up to date study of the literature.
The project manager during 1993-1994 was Kent Gustafson and during 1995-1996 Anita Ihs. The author of this report is Anita Ihs, assisted by Kent Gustafson and Kerstin Persson. All field measurements on many cold and snowy winter nights were made by Anders Swensson and Bjorn Bjornsson. Corrosion tests in the field and in a climate controlled chamber were planned and performed by Kurt Jutengren, National Swedish Testing and Research Institute (SP).
Tests on concrete were planned by Anders Andalen and performed by Monica Lundgren, both of SP. Anita Carlsson has edited the manuscript of the report. The staff of the Road Administration Production Division at NykOoping took an active part in the project and showed a high degree of commitment. The contact person at the Road Administration was Lennart Axelson. To all those who have been taken part in this project, I wish to extend my sincere thanks.
The project has been commussioned and financed by the Road Administration. The report has been translated by L J Gruber, BSc(Eng) CEng MICE MIStructE
Linkoping, April 1996
Kent Gustafson
Contents
Foreword Summary 1 Introduction 2 _- Method
2.1 Follow up of maintenance operations 2.1.1 Test sections and mixing procedure 2.1.2 Data collection, control observations 2.2 Melting tests
2.2.1 Method 2.2.2 Materials 2.3 Corrosion tests 2.3.1 Introduction
2.3.2 Field and laboratory tests at SP 2.3.3 Laboratory tests at VTI
2.4 Tests on concrete at SP 3 Results
3.1 Control observations 3.1.1 General
3.1.2 Results of control observations in winter 1993/94
3.1.3 The results of control observations during winter 1994/95 3.1.4 Conclusions of the control observations
3.2 Melting tests 3.3 Corrosion tests
3.3.1 Field and laboratory tests at SP 3.3.2 Laboratory tests at VTI
3.4 Tests on concrete
4 Conclusions from the entire investigation Bibliography
Appendix No 1: Sketch showing placing of measurement sections during winter 1993/94
VTI meddelande 788A
11 14 14 14 15 16 16 17 17 17 17 20 20 23 23 23 24 62 88 88 90 90 93 94 96 98
Evaluation of CMA/NaCl mixture
Effect on road condition/friction, ice melting capacity, corrosion and effect on concrete
by Anita Ihs, Kent Gustafson and Kerstin Persson
Swedish National Road and Transport Research Institute 581 95 Linkoping
Summary
In 1993 VTI was commissioned by the Swedish Road Administration to start a research project with the object of testing and evaluating a mixture of 20% by weight of calcium magnesium acetate (CMA) and 80% by weight of sodium chloride (NaCl) as deicing agent. The evaluation comprised both field trials and laboratory tests.
Field trials were performed during winters 1993/94 and 1994/95 on a section of European Route E4 near Nykoping, Sodermanland County. Field trials included control observations and corrosion tests. During the control observations, the deicing effect was investigated in variable weather and road conditions by means of friction measurements. Friction was measured with a SAAB Friction Tester on both a test section on which CMA/NaCl mixture had been spread and on a control section on which only NaCl had been spread. The experience gained from these control observations is that the same deicing effect can be achieved with the CMA/NaCl mixture as with pure NaCl.
The corrosive effect was studied using test panels of steel plate which were set out in the central reserve of the road along both the test and control sections. This study was performed by the Swedish Testing and Research Institute (SP). During the first winter, there was a pronounced difference in loss of metal due to corrosion. Loss of metal (rate of corrosion) was 25% (southbound carriageway) and 45% (northbound carriageway) lower on the CMA/NaCl section than on the NaCl section. A greater number of treatments and a greater quantity of deicing agent had however been applied on the NaCl section. Before the second winter, the test and control sections were changed round. During this winter, more treatment was carried out and a greater quantity of deicing agent spread on the CMA/NaCl section. This was interpreted to mean that the local climate on the two sections is different. Despite a greater number of treatments and a greater quantity of deicing agent on the CMA/NaC] section, loss of metal on this section was still lower than on the control section, even though the difference was not as pronounced as during the first winter.
Laboratory tests comprised ice melting capacity, corrosion and effect on concrete. The ice melting capacity of pure CMA is considerably inferior to that of NaCl. The ice melting effect of CMA is particularly slow in the initial phase (ca 15-30 minutes). The ice melting capacity of the CMA/NaCmixture is however largely the same as that of NaCl.
Corrosion tests were performed at both VTI and SP. The results show that corrosion damage is reduced when CMA is mixed into NaCl. Tests in the controlled climate room at SP show that the rate of corrosion caused by the CMA/NaCl mixture is ca 45% lower than that due to pure NaCl.
The effect of CMA and different mixtures of CMA and NaCl on the frost resistance of different types of concrete was studied by SP. In this case also the results show that the CMA/NaCl mixture causes less damage than pure NaCl. On modern bridge concrete little scaling is caused even by NaCl. There were some signs that CMA attacked concrete chemically, but no further study was made of this.
The conclusion of the investigation is that when 20% by weight of CMA is added to NaCl, the deicing effect produced is about the same as that due to pure NaCl, and the mixture causes slightly less corrosion and slightly less damage to concrete than pure NaCl. These latter effects are however rather limited. Since the price of the CMA/NaCl mixture is 5-6 times as high as that of NaCl, it is doubtful whether it is economically advantageous to use the CMA/NaCmixture instead of pure NaCl.
1 Introduction
Spreading of sodium chloride (NaCl) is the most common method at present for deicing roads and streets carrying high volumes of traffic. NaCl has many advantages: it is a very effective deicing agent, it is easy to store, handle and spread, and it also has a relatively low price. Over the years, however, as the use of NaCl has increased, serious drawbacks have been found. One very extensive problem is corrosion on vehicles and reinforcement in road structures such as bridges, and damage to concrete, which NaCl causes. Damage to vegetation and elevated salt concentrations in soil and groundwater near highly trafficked roads have also been noted. These negative effects cost road management authorities and the general public large amounts of money. In view of this, several alternatives have been tested with a view to reducing the use of salt.
In cooperation with the Road Administration, VTI has for many years been engaged on research and development projects to test and evaluate salting methods and alternative deicing agents. Over the period 1985-1990, a comprehensive research programme designated MINSALT was carried out with the object of finding methods and strategies for winter road management which would minimise the harmful effects of the use of salt without detracting from road safety. The results of the many different parts of this programme were set out in a number of interim reports and summarised in a final report. (G. Oberg, K. Gustafson and L. Axelson, 1991).
As far as chemical decing, application of salt, is concerned, methods of spreading have been developed from the earlier use of dry salt to the present practice of spreading salt which is in most cases prewetted with a suitable solution, usually NaCl solution, or spreading NaCl solution. With prewet salt or a salt solution, salting is more effective. Salt adheres better to the road surface which reduces losses from the road and a smaller quantity of salt can therefore be used to achieve the same effect as with dry salt. Salt also dissolves more rapidly and can be used at slightly lower temperatures. As a result of the MINSALT programme a salting strategy was also proposed which would reduce the use of salt and make salt treatment generally more effective. This would be achieved by a more preventive use of salt before the road becomes slippery, and a reduction of curative application when the road has already become slippery due to snow and ice.
The MINSALT programme also comprised investigations with a view to finding optimum spread rates in various weather and road conditions. The influence of the road structure, surfacing and the origin and grain size of salt were other factors which were studied.
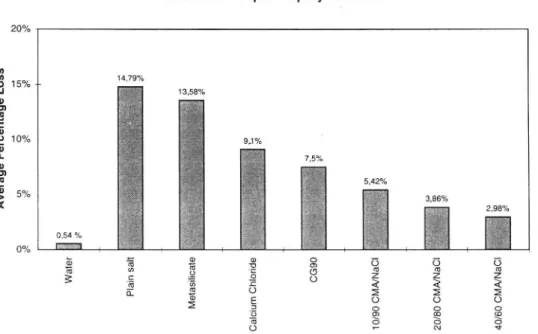
A number of deicing agents as alternatives to NaCl were also tested. One agent which received more detailed attention was calcium magnesium acetate, CMA. Its ice melting capacity, corrosive effect and effect on cement concrete were subjected to particular study. The great disadvantage of CMA is its high price, more than 20 times as high as that of NaCl. In the US tests have therefore been carried out on mixing CMA and NaCl; these yielded very promising results, for instance in regard to the reduced corrosive effect. Tests made by the Minnesota Department of Transportation have shown that a mixture of 80% by weight of NaCl and 20% by weight of CMA can produce a significantly lower rate of corrosion on steel plates than NaCl. (B.W. Bohlmann, 1993). The results from
some corrosion tests with different types of deicing agents are plotted in Figures 1:1 and 1:2.
Auto Body Coupon - Spray Test 1990-1
60% 50% + 40% + 30,32% + 30% 4 20,52% 20% { T Av er ag e Pe rc en ta ge Lo ss 11,74% 10% + 0%
-Plain Road Domtar United Sait Quick Salt CG9O0 20/80
Salt Surf. Saver. CMA/NaCl
Fig. 1:1. Loss of metal from auto body coupons which had been sprayed with 3% solutions of different deicing agents. Results from B.W. Bohimann, Minnesota Department of Transportation (2).
Mild Steel Coupon - Spray Test 1991-2
20% 14,79% 15% + 10% 5% Av er ag e Pe rc en ta ge Lo ss 0,54 % - L-0% Wa te r egeC w and "LB Q Me ta si li ca te h ed O O O o G G < < <-< < & p3 p3 pS O O [®] & O O C2 & & O O O *- A < C a l c i u m Ch lo ri de
Fig. 1:2. Loss of metal from mild steel
plates which had been sprayed with 3%
solutions of different deicing agents. Results from B. W.Bohimann,
Minnesota Department of Transportation (2).
In view of the results from Minnesota DOT and the cooperation which exists between the Swedish Road Administration and the Federal Highway Administration (FHWA), USA, the Road Administration in 1993 commissioned VTI to start a research project with the object of testing and evaluating this 20/80% by weight CMA/NaCl mixture as deicing agent. Evaluation comprises both field trials and laboratory tests. Field trials were carried out in the winters 1993/94 and 1994/95. In these field trials, deicing effect under variable weather and road conditions was investigated. The corrosive effect was also studied using steel plates set out along the road. Laboratory tests comprised ice melting properties, corrosive effect and the effect on cement concrete.
The commission of the Road Administration also included a study of the literature concerning CMA. This is presented in VTI Bulletin No 789 (Ths, A and Gustafson, K, 1996).
2 Method
2.1 Follow up of maintenance operations 2.1.1 Test sections and mixing procedure
The sections studied are situated on European Route E4 in S6odermanland County and extend from Nykopings Bro to the north. This is a 4-lane motorway with an AADT of ca 12,000 (see Table 2:1). In Drift 94 (General Technical Specifications), the road management standard is specified for a number of standard classes and recomendations are given regarding the selection of standard in view of traffic flow and road category. According to these recommendations, the section of E4 used in the investigation is assigned to Standard Class A2.
20/80% by weight CMA/NaCl mixture was spread on a test section of ca 20 km length and only NaCl on a control section of about the same length. In winter 1993/94 the CMA/NaCl section was situated between Nykopings Bro and Tystberga, and the NaC) section between Tystberga and Vagnhirad. The former section has a stone mastic asphalt surfacing (HABS) and the latter a conventional close textured asphalt concrete (HABT). Measurements were made in the slow and fast lanes (Kl and K2) and on both northbound and southbound carriageways. A total of 16 measurement sections were used in the first winter, 8 on the test section and 8 on the control section. Each measurement section was 400 m long and they were chosen so as to be similar regarding cross section, environment, traffic and other conditions. A sketch of the location of these sections in the first winter is to be found in Appendix No 1.
In winter 1994/95, the test and control sections were to a large extent interchanged. In this winter, CMA/NaCl was spread between Brohagen and H616, and NaCl between Nykopings Bro and Brohagen. To start with, the number of measurement sections was reduced to 4 each on the test and control sections, but 4 more measurement sections were later added to the control section.
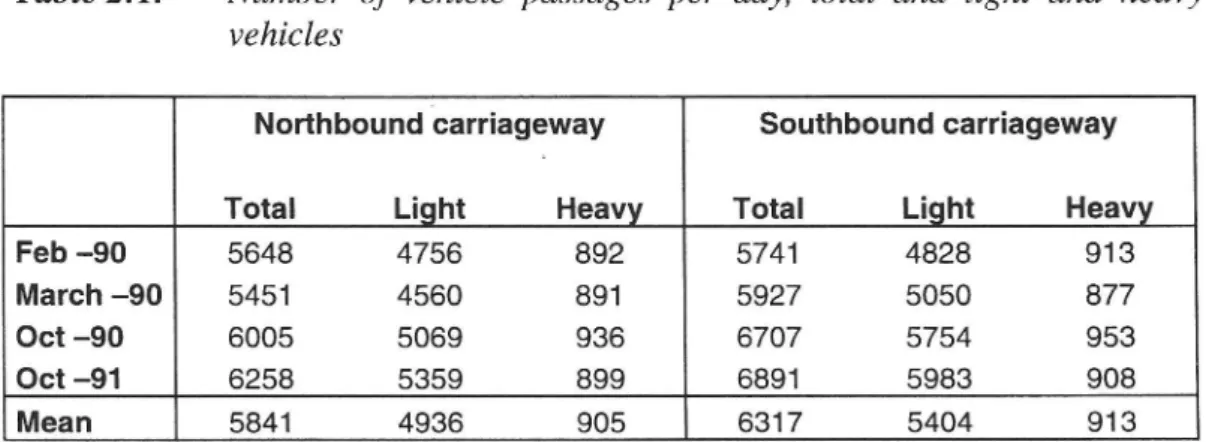
Table 2:1. Number of vehicle passages per day, total and light and heavy vehicles
Northbound carriageway | Southbound carriageway
Total Light Heavy Total Light Heavy
Feb -90 5648 4756 892 5741 4828 913
March -90 5451 4560 891 5927 5050 877
Oct -90 6005 5069 936 6707 5754 953
Oct -91 6258 5359 899 6891 5983 908
Mean 5841 4936 905 6317 5404 913
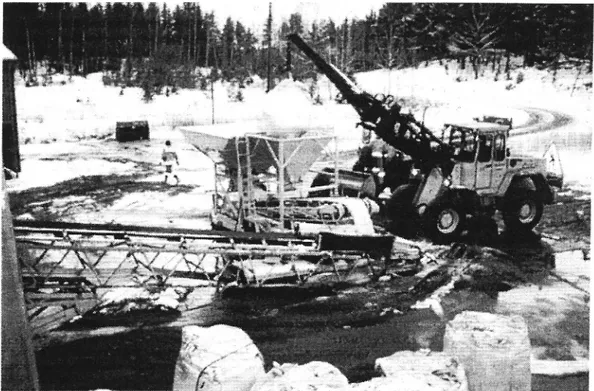
CMA was delivered in sacks of 1000 kg. These were kept in a store erected on wooden pallets so as to avoid moisture uptake by the sacks. This way of storage was adopted after sacks stored outdoors had become wet and been damaged. The CMA in these sacks caked into clumps and became very hard. Attempts were made to crush the caked material but this was found very difficult. It is therefore very important for CMA to be stored in the dry.
Both the CMA/NaCmixture and the ordinary salt were spread both dry and wet. A saturated NaC] solution, approx 23% by weight, was used to wet the salt. Wetting is effected on the spreader plate by adding a 30% by weight solution to the dry salt. The spreader vehicle for wet salt has a load capacity of 8 m} salt and 2000 litres of solution.
Figure 2:1 Mixing of CMAand NaCl using a conveyor belt and twin feed bins
2.1.2 Data collection, control observations 2.1.2.1 Friction
Friction on the carriageway was measured with a SAAB Friction Tester. The first measurement was made before the first application of deicing agent or, if this was not possible, as soon after application as possible. Friction was thereafter registered at 1-2 hour intervals until a friction equivalent to that on a snow-free carriageway was achieved. The aim was to document development of friction at the time the road became slippery, from the time ice had formed until snow-free carriageway friction was achieved due to application of the deicing agent. The value given as the result of friction measurements is the mean over the measurement section (ca 400 m).
2.1.2.2 Road condition
The condition of the road was surveyed and noted for each test section and friction measurement. The alternatives to be noted regarding road condition were dry snow-free carriageway, damp snow-free carriageway, wet snow-free carriageway, thick ice, hard packed snow, thin ice, hoar frost, loose snow, slush. The thickness of snow and slush, in cm, could also be stated.
2.1.2.3 Weather
The weather and the temperature of the air and the surface were noted at the time of the friction runs. The alternatives to be noted regarding weather were light snowfall, moderate snowfall, heavy snowfall, light drifting snow, moderate drifting snow, heavy drifting snow, light rain, moderate rain, heavy rain, freezing rain, sleet, foggy, overcast, cloudy, clear, sunny.
Weather information was also obtained from the Road Weather Information System (RWIS) stations in the area. These register measurements every half hour, and the data used were surface and air temperature, quantity and type of precipitation. In winter 1993/94, Station No 0403 situated near test section 3/4 and Station No 0405 situated near test section 7/8 were used. Precipitation data were obtained from Station No 0403 which is equipped with an optical precipitation sensor. Temperature data were taken from both stations. In winter 1994/95, Station No 0404 situated near the CMA section and Station No 0405 situated between the CMA and control sections were used. Precipitation data were obtained from Station No 0404 which is equipped with an optical precipitation sensor, and temperature data were obtained from both stations.
2.1.2.4 Treatment
The treatment applied was noted by the driver concerned on a special form. The data noted were distance driven, time when the treatment started and finished, the type of treatment and rate (g/m?) of salt spread. The types of treatment which could be noted were gritting, salting, ploughing and combined salting and ploughing. In some cases the rate of spread was not noted, and this was subsequently estimated from the number of tonnes used according to the salt treatment report.
2.2 Melting tests 2.2.1 Method
The test was performed in a refrigerated room. Blocks of ice of 114 cm* area were made by freezing deionised water in special aluminium foil moulds. In a number of blocks thermocouples were placed to register ice temperature during the test. For each tested material and temperature, 6x2 ice blocks were used. One block was used as a check on ice temperature and had no deicing agent added. The other
2.2.2 Materials
The deicing agents used in the investigation were: . NaCl
CMA
Mixture of 20% by weight CMA and 80% by weight NaCl
Mixture of 20% by weight crushed CMA and 80% by weight NaCl
Mixture of 14% by weight CMA, 56% by weight NaCl and 30% by weight NaCl solution
Mixture of 14% by weight crushed CMA, 56% by weight NaCl and 30% by weight NaCl solution
7. Sodium acetate (NaAc).
i s w o p -O
In mixtures 4 and 6 the round CMA grains were first crushed. In mixtures 5 and 6 the dry mixture was wetted with saturated NaCl solution (approx 23% by weight).
2.3 Corrosion tests 2.3.1 Introduction
Both field and laboratory tests were made in order to investigate the corrosive effect of a 20/80% by weight CMA/NaCl mixture. The field tests were made during the 1993/94 and 1994/95 winter seasons by K. Jutengren of the Swedish Testing and Research Institute (SP) in Boras; steel plate specimens were set out along the road on the test section where 20/80% by weight CMA/NaCI was spread and along the control section where only NaCl was spread. (K. Jutengren, 1995). After the first winter's exposure the plates were removed and analysed at SP. New plates were set out before the next winter season. The procedure applied during the field tests is described below.
Laboratory tests were made at both SP and VTI. A brief description of the tests at SP is given below. An SP report by K. Jutengren which describes the field and laboratory tests in greater detail will be completed in the spring of 1996 (K. Jutengren, 1995).
2.3.2 Field and laboratory
testé at SP
In order to study the corrosive effect on car body samples under realistic
conditions, frames with test plates were set out in the central reserve between the
southbound and northbound carriageways. The sample plates were made of cold
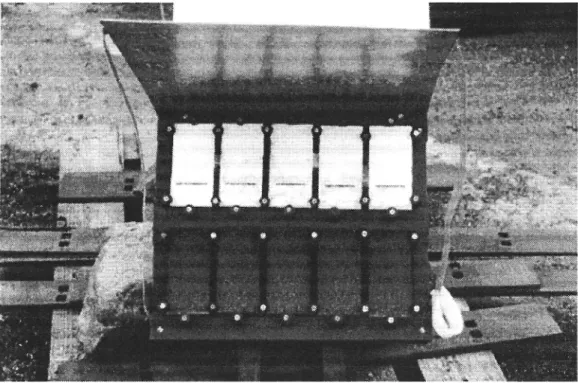
rolled Steel 1146 in accordance with Swedish Standard SIS 14 11 46. Five painted
and five unpainted steel plates (only in the first winter) were mounted on frames
as shown in Figure 2:2. Each of the five painted plates had a groove in the painted
surface. These plates were used to evaluate cracking and flaking due to corrosion.
The five unpainted plates were used to determine the rate of corrosion. At the end
of exposure the rust was removed and loss of metal determined by weighing. Two
frames were set out along both the test and control sections, one facing the
northbound and the other the southbound carriageway (see Figure 2:3).
Atmospheric corrosion was determined by exposing five unpainted steel plates
mounted on a frame on top of a hill along each road section (see Figure 2:4). By
subtracting atmospheric corrosion from the corrosion measured on the unpainted
test plates near the road sections, the corrosive effect of the road environment could be determined. The results of field tests are described in Chapter 3.
Corrosion tests were also made in the laboratory of the Swedish Testing and Research Institute. Tests were made in a controlled climate room. This room which had been specially developed to simulate the effect of an authentic road environment on exposed material is described in SP Report No 1991:26 (K. Jutengren, 1991). In this investigation, the environment at the test section (CMA/NaCl) and the control section was simulated. Earlier tests made in the controlled climate room had shown very good correlation with results obtained in the road environment.
VTI meddelande 788A 19 Figure 2 4. Test plates for recording atmosph2rlC COrrosion
inn
-motorway
ng of frame wi
2.3.3 Laboratory tests at VTI
Two test series were performed at VTI. In these, steel test plates covered with synthetic road dirt were exposed to different CMA/NaCl mixtures.
The first test series was performed broadly in agreement with Swedish Standard SS 18 60 39 (this standard has now been withdrawn). However, the steel used for the test plates was Steel 1147 instead of Steel 1146 which could not be obtained.
Two plates (200x100 mm) were used for each CMA/NaCl mixture. Prior to the test the plates were cleaned with xylene and weighed. They were then coated with synthetic road dirt (112 g sand 55, 26 g sand 36, 50 g sand 17 and 12 g kaoline; this quantity is enough for two plates) mixed with 20 ml 15% solution of the deicing agent. The plates were placed in a controlled climate room at 23°C and 100% relative humidity and were wetted once a day with distilled water. The test was discontinued after 64 days. Most of the rust was scraped off and the rest was removed by pickling in ammonium citrate. Weight loss could then be determined and provided a measure of corrosion.
In the second test series the plates were coated with a synthetic road dirt consisting of 2% asphalt filler of <0.0075 mm grain size, 28% bitumen B180 and 70% deionised water. The road dirt was applied with a spray gun to a weight of 0.4 g dry road dirt per plate. After this, 1.0 g of 3% solution was sprayed on to the dry plates with a spray gun. The plates were stored in the same way as above but were wetted only at the beginning of the test. The test was discontinued after 93 days and the weight loss was determined as above.
2.4 Tests on concrete at SP
An investigation of how CMA and CMA/NaCl mixtures affect the frost resistance of concrete was made by M. Lundgren and A. Andalen at the Swedish Testing and Research Institute in Boras (A. Andalen and M. Lundgren, 1995).
For more than ten years, all concrete which the Swedish Road Administration and the Swedish Rail Administration purchase for their civil engineering structures have been pretested in accordance with Swedish Standard SS 13 72 44. The tests are made by exposing a sawn concrete surface to 56 freeze/thaw cycles in contact with a 3% NaCl solution. Freezing in the presence of salt solution causes much more severe action than freezing in water, and the concentration 3% NaC) has been shown to produce the greatest damage (Verbeck, G Jand Klieger, P, 1957).
The above method was used to investigate how different CMA/NaCl mixtures affect frost resistance. Four proportions of CMA/NaCl were used in the tests: 0/1100, 20/80, 40/60 and 100/0. Three different concrete grades were used in the tests:
A) Concrete made with STD Slite cement without air entrainment or with a low degree of air entrainment. This concrete represents a former bridge
C) Concrete made with Degerhamn low alkali, sulphate resisting cement, 5% silica fume and air entraining admixture. This represents a very tight concrete of high quality which is used in certain civil engineering structures, and is a grade that may be expected to become increasingly common in future.
Concrete A is a concrete which is expected to have low frost resistance, while B and C are grades which are reckoned to have very good frost resistance.
Thetest specimens were made in the laboratory of the concrete section at SP at Boras using Slite and Degerhamn low alkali, sulphate resisting cement as binder and natural aggregate of 16 mm maximum size. The admixture Cementa 88L was used as air entraining agent.
The material properties of the three types of concrete are presented in Table aig.
Table 2:2. Concrete grades used in the investigation
Concrete Cement content W/c Cement Air Density* Strength" ratio content content (kg/m?) (MPa)
(kg/m®) (%) A Slite Std 0.49 410 1.2 2380 53 B Degerhamn 0.43 410 4.6 2352 56 C Degerhamn -__ gas 410 3.6 2342 63 +5 % Silica fume ~ % by weight
* 389.5 kg/m} cement + 20.5 kg/m? silica fume * at 28 days
* at 28 days, test on 2 cubes in accordance with SS 13 72 10
On the standard bridge concrete (B) the frost resistance was tested on both a sawn and an as-cast surface. This was done to see if there were any differences between a surface with a large proportion of cement in the surface (which is the case for an as-cast surface) and a sawn surface.
An investigation was also made of how high concentrations of CMA affect the frost resistance of the standard bridge concrete (B). CMA solutions of 3, 10 and 20% concentration were used.
Details of all the tests are given in Table 2:3.
Table 2:3 Details of tests
Test Refrigerant Concrete A Concrete B Concrete C O O ~ O au A G N -woh O NaCl 3 % " CMA/NaCl 20/80 % by weight * CMA/NaCI 40/60 % by weight * CMA 3 %
"CMA 3 % as-cast surface CMA 10 % CMA 20 % * CaCIz 3 % CaCl 10 % CaCl» 50 % X X X X X X X X X X X X -X X X X X
" NaCl from the Road Administration salt store in Jonkoping
* The refrigerant is a 3% solution comprising 20% CMA and 80% NaCl or 40% CMA and 60% NaCl
" The original proposal was for 50% CMA. However, this produced a thick and very viscous paste which could not be used as refrigerant. The proportion of CMA was therefore reduced to 20% by weight
3 Results
3.1 Control observations 3.1.1 General
An account is given below of the occasions in winters 1993/94 and 1994/95 when the control observations were made. The reports were somewhat different in the two winters as regards detailed data on salting and ploughing. The presentation in the tables below of the treatment applied is therefore slightly different for the two winters.
In winter 1993/94 observations were made on 9 occasions, each of which lasted for & to 2 days. The dates when these observations were made are given below.
Occasion No Date 23-24 November 1993 30 November-1 December 1993 2-3 December 1993 15-16 December 1993 27-29 December 1993 18-20 January 1994 25-26 January 1994 2-3 February 1994 2-3 March 1994 \O J O \] QO Uu B Q DD
-In winter 1994/95 observations were made on 6 occasions. -In this winter also, each occasion lasted for & to 2 days. The dates when these observations were made are given below.
Occasion No Date 1 27 December 1994 9-10 January 1995 23-24 January 1995 31 January-2 February 1995 15-17 March 1995 27-28 March 1995 O U B Q DJ
Apart from measurements of friction on a number of occasions, the number of application rounds and the quantity spread were also studied. The total number of salt applications and the total quantity of salt spread on the test and control sections have been summarised for both winters.
Evaluation of the effect which the CMA/NaCmixture has on road conditions is not uncomplicated. Friction varies not only between the test and control sections, but also between lanes, directions of travel, etc. Owing to the higher traffic intensity, the condition of the road is usually considerably better in the slow lane K1 than in the fast lane K2. There is a particularly large difference at night when almost no traffic uses K2. Because there is no mechanical action by traffic, the condition of the lane is very bad.
3.1.2 Results of control observations in winter 1993/94
The nine occasions in winter 1993/94 when control observations were made are set out below. The tables give the approximate time of treatment on the CMA/NaC] section and the control section, and the rate of salt spread (g/m). When ploughing was carried out, the type of blade used (steel or rubber) is stated.
3.1.2.1 Occasion No 1, 23-24 November 1993 First observation round began: 12.15 on 23/11 Last observation round ended: 08.30 on 24 /11
Precipitation: Light to moderate snowfall started before the first observation round and ended around 17.30.
Temperature: Surface temperature was between 0°C and -0.5°C. Air temperature in the afternoon was ca -0.5°C and rose to 1-2°C after the end of precipitation. During the night air temperature again dropped and in the morning it was between -0.5 and 0°C.
Treatment CMA/NaCl NaCl
23/11 |12:00-13:00 15g dry 13:00-14:45 20g dry+steel 14:30-15:30 20g dry+steel |15:30-16:15 20g dry+steel 19:30-20:30 20g dry+steel |18:00-18:45 20g dry+steel 21:15-22:15 15g dry+steel |20:45-21:30 20g dry+steel
Comments
_
In the afternoon and evening of 23/11 4 treatments were applied on both the test
and control sections. The treatments were similar, which generally means
combined ploughing and salting at the rate of 20 g/mdry.
Northbound
Treatment on the control section with NaCl started somewhat
later than on the test section. In K1 the effect of the CMA/NaC mixture was
better than that of NaCl, and particularly after the end of snowfall friction
increased more rapidly on these sections. In K2 the effects were more alike, even
though the test section obviously had better friction at the first measurement. It
must however be borne in mind that salt had been applied on this section
immediately before, while this was not the case on the control section.
Southbound
On the southbound carriageway also friction was slightly
better on the test sections, particularly in K1. At around 1700 snow-free values
were measured on test sections 13 and 15, while on the control sections, especially
on section 9, friction was lower.
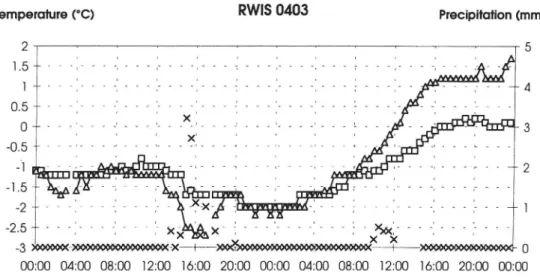
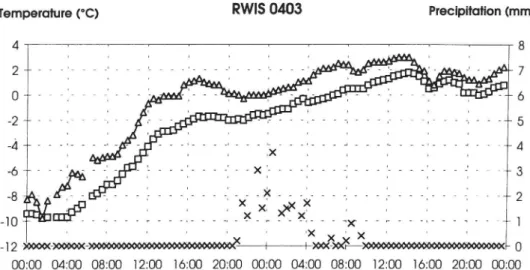
Temperature (°C) RWIS 0403 Precipitation (mm)
-2.0 1
-3 >
L D Surface -A- Air x Precipitation I
Temperature °C RWIS 0405 Precipitation (mm)
2 1 a + 0.9 a r c - 0.8 O.SB h n n n t n tp u a rpg -+ 0.7 0 - - 0.6 -0.5 + 0.5 -1 4 + 0.4 -1.8 cho s Ac s a s noe - 0.3 <2. 1 4 + 0.2 -2.5 | j ~ -f 0. -3 | | | | | | f | + 0 00:00 04:00 08:00 12:00 16:00 20:00 00:00 04:00 08:00 12:00 16:00 20:00 00:00
{AD Surface -A- Air -x Precipitation I
Figure 3:1 Data on surface and air temperature and precipitation from RWIS Stations Nos 0403 and 0405 on 23-24 November 1993
K1 northbound Friction Precipitation (mm) --AB-- CMA/NaCI (1) --&-- CMA/NaCI (3) -o- NaCl (5) -A- NaCl (7) e Appl CMA/NaCI ¢ Appl NaCl x Precipitation 0 f | | hs 0 22:00 00:00 02:00 04:00 06:00 08:00 10:00 12:00 14:00 16:00 K2 northbound Friction Precipitation (mm) -B- CMA/NaCI (2) --i&- CMA/NaCI (4) -O- NaCl (6) -A-NaCl (8) e Appl CMA/NaCI e Appl. NaCI x Precipitation &oi- o 22:00 00:00 02:00 04:00 06:00 08:00 10:00 12:00 14:00 16:00
Figure 3:2 Friction measurements on the CMA/NaCl and control sections, precipitation and the time when treatment was applied on 23-24 November 1993. Northbound carriageway.
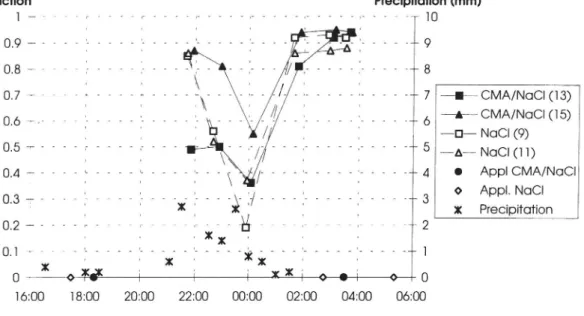
K1 southbound
Friction Precipitation (mm)
O.7 -on n noe n n nre n n nbr n n nbn n n h n n n n n n £ t t coe > > >4- 7 -#- CMA/NaCI (13) O6 Ge n e e ea e e eate aa faa a da s d t u]. 4 -a- CMA/NaCI (15)
5
.
.
.
.
.
.
.
,
-a- NaCl (9)
0.5*___:_-__:____:_---:-_-_:-_-_:-_-:____:---9)
-a-0.4 -o s n e s n e n e s he e 4 e e d+ >> k s oa ast- 4 ® Appl CMA/NaCI . . . ' . ' A
O.B - n e e e ee eee a s s d e t e ugmi ppl NaCl ' X Precipitation (.J .- - a soa aos mus som s,s mos s,m som s, so s s m sos sop s s k pos « se- 9
Ol -= n n n R n n r n e c c dpe Pc bcc-I Xx % 0 } | P | | s *o-- 0 22:00 00:00 02:00 04:00 06:00 08:00 10:00 12:00 14:00 16:00 K2 southbound Friction Precipitation (mm) J -o s e ae e ae ae >> be n nb e n b r t t R > oe < +5 e fr ~
08 => fects ece cds igo
Z $60} s ah a whe a ale fp sla aoa ab dope F fa a -#- CMA/NaCI (14)
e fess s sng -i&- CMA/NaCI (16)
I -a- NaC (10) 0.5 - -a- NaCl (12) 0.4 e Appl CMA/NaCI 0.3 6 Appl. NaCl ® Precipitation 0.2 0.1 - x C
(J. --PR-{Mgt]--i]---Rg:AMsiseperemeecfpesesssonfteescoofies sees seesf $9 10° 12" 14° 16" 18" 20° 22° 00° 02° 04° 06" 08" 10"
Figure 3:3 Friction measurements on the CMA/NaCl and control sections, precipitation and the time when treatment was applied on 23-24 November 1993. Southbound carriageway.
3.1.2.2 Occasion No 2, 30 November-1 December 1993 First observation round began: 21.45 on 30/11
Last observation round ended: 14.00 on 1/12
Precipitation: During all observations, up to around 13.00, there was light snowfall.
Temperature: In the evening both surface and air temperatures were ca -2°C. During the night and morning they slowly rose and in the middle of the day were between -0.5 and -1°C on the surface and ca 0.5°C in the air.
Treatment: CMA/NaCl NaCl
30/11 14:00-15:00 15 g dry 14:30-15:15 15 g dry 18:30-19:30 15 g dry
1/12 03:15-04:15 15 g dry 03:30-04:15 15 g dry 11:45-12:45 17 g dry 12:30-13:15 18 g dry
Comments
During the time shown in Figure 3:2, dry salt was spread on both sections.
Northbound: Sections 1 (K1) and 2 (K2) with CMA/NaCl both had snow free friction on this occasion while the other sections had reduced friction around midday on 1 December. Friction was particularly low on the NaCl sections.
Southbound: In the K1 lane there were snow-free values on all sections during the observation period. In K2, on the other hand, friction on the NaCl sections was reduced as a result of snowfall between about 10.00 and 12.00.
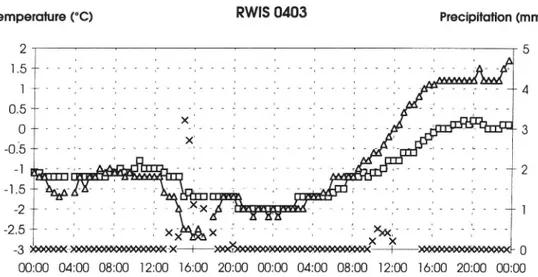
Temperature (°C) RWIS 0403 Precipitation (mm)
-3 - - 0
00:00 04:00 08:00 12:00 16:00 20:00 00:00 04:00 08:00 12:00 16:00 20:00 00:00 i -O- Surface -A- Air -x Precipitation l
Temperature °C RWIS 0405 Precipitation (mm)
2
-
.
.
.
-
,
ce
,
.
r
1
LB pc s sus s =o aos «qs a # oq somos ros # om # sos pou som. «os ops c
< c
c co G
I4 b d b dc bc cc c} -~
tf -"os
dn cs dpe d bcdct cb,
i> 3 07
e
| 0.6
A1
l
c
~
ley
1.6
.
.
aas
ws
geal
ptho cs gs e csc ge - {§
#4
1
fu
"o-
~ Hae
PB}
10
1
be
16
b
l e
e
l
b po
-
|
t
|
|
|
|
|
|
i
|
0
00:00 04:00 08:00 12:00 16:00 20:00 00:00 04:00 08:00 12:00 16:00 20:00 00:00
l D Surfoce -A- Air x Precipitation!Figure 3:4 Data on surface and air temperature and precipitation from RWIS Stations Nos 0403 and 0405 on 30 Nov-1 Dec 1993
K1 northbound Friction Precipitation (mm) -B- CMA/NaCI (1) CMA/NaCI (3) -H- NaCl (5) -B- NGCH £7) e Appl CMA/NaCI ¢ Appl. NaCl x Precipitation . . . 2 X xx . . 0 | |-- | } K 0 22:00 00:00 02:00 04:00 06:00 08:00 10:00 12:00 14:00 16:00 K2 northbound Friction Precipitation (mm) 0.9 R 0.8 = 0.7 |- 7 -_- CMA/NaCI (2) 0.6 -- 6 -&-- CMA/NaCI (4) --o- NaCl (6) 4.8 - 1 5 -a-NaCl (8) 0.4 > + 4 e App! CMA/NaCI
0.3 - | 3 & Appl. NaCl
I . __x Precipitation
0.2 - \I£4 e
M e d
.
.
.
'.
l
, X Xx ,
}
(§ s
ansi amsAfiancn ce sdawesveemonf nt oRannncriff
ace
\ 0K1 southbound
Friction Precipitation (mm)
,J w- - a «1s « a sue aoa sis «os sim soa shok mos a k mos a om s e m « e se- 7 -- CMA/NaCl (13)
O é ______6 f CMA/NOCI(15)
. . . .
Z
.
.
.
-o- NaCl (9)
o p p T O
oy r r e kok s s e > > >-- A
e Appl CMA/NaCI
o o o
.
,
,
,
,
,
,
,
aa
x Precipitation
,2 ~- - s a owo oa a age a aos
«o «, 6 ko wo «y woo w ogo os ow woop oa oso omoge s oa ssa- 2
©,] -+ s «s a < ok Cs aoe . fa aoa s' m soe doe soe doe soe hos soa % . . .~- ]
I
X x x
0
|
}
co
}
|
+6
-
0
22.00 00:00 02:00 04:00 06:00 08:00 10:00 12:00 14:00 16:00
K2 southbound
Friction
Precipitation (mm)
tn DNL
'
|
// | -0.7 - bo ay R g + 4+ 7 -E- CMA/NaCI (14) 0.6 - AX \ Xy s // so 2 Lg] @ CMA/NaCI (16)box C
\I / '
-a- NaCl (10)
0.5
Swen
A
cog Cop cu
. [t 81a-
A- NaCl (12)0.4 to ay | { 4 e Appl CMA/NaCI 0.3 \A 04 0 Appln. Nag . __x_ Precipitation | 0.2 2 o 0.1
.
.
.
f
22:00 00:00 02:00 04:00 06:00 08:00 10:00 12:00 14:00 16:00
Figure 3:6
Friction measurements on the CMA/NaCl and control sections,
precipitation and the time when treatment was applied on 30
Nov-1 Dec Nov-1993. Southbound carriageway.
3.1.2.3 Occasion No 3, 2-3 December 1993 First observation round began: 21.15 on 2/12 Last observation round ended: 03.45 on 3/12
Precipitation: Around 21.00 precipitation began in the form of sleet. Later on during the night it turned into snow which stopped around 01.30. A little later there was light rain.
Temperature: Surface temperature was around 0°C and air temperature a degree
'
or two higher.
Treatment:
CMA/NaCl
NaCl
2/12
17:15-18:45
15Gg dry
17:15-18:00
20g dry
3/12
02:00-04:00
20 g dry
02:30-03:15
20 g dry
+rubber
+rubber
05:00-05:45
15 g dry
+rubber
Comments
The treatments applied are relatively similar during this period. In the evening of 2
December salt was spread as a preventive measure. After snow mixed with rain
had stopped there was a combined run using a rubber blade and 20 g/mdry salt.
On the NaCl section there was a further combined run a little later in the morning.
Northbound
During snowfall, the effect in Kl on CMA/NaCsection
No 3 was slightly inferior to that on the other three sections. In K2, on the other
hand, both test sections were better than the two NaCl sections where the
minimum value of friction was ca 0.2.
Southbound
On the southbound carriageway also friction is generally
slightly better on the CMA/ NaCsections although there were some contrary
values during some measurements. Friction is mostly highest on sections Nos 15
and 16, i.e. CMA/NaCl in Kl and K2, while it is least, ca 0.15-0.2, on NaCl
sections Nos 9 and 10.
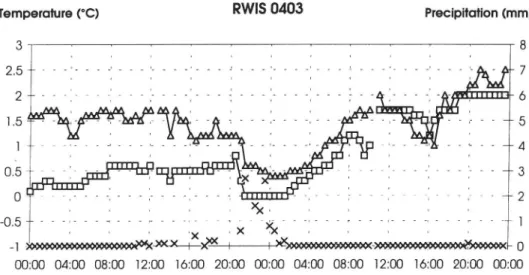
Temperature (°C) RWIS 0403 Precipitation (mm)
____________________
-] X ()
00:00 04:00 08:00 12:00 16:00 20:00 00:00 04:00 08:00 12:00 16:00 20:00 00:00
I -O- Surface -A- Air x Precipitation I
RWIS 0405 Temperature °C Precipitation (mm) 1 +09 + 0.8 + 0.7 + 0.6 1 0.5 + 0.4 + 0.3 + 0.2 +0. -] | b { { } } } | } f- % 0 00:00 04:00 08:00 12:00 16:00 20:00 00:00 04:00 08:00 12:00 16:00 20:00 00:00 I D Surface -A- Air x Precipitation
Figure 3:7 Data on surface and air temperature and precipitation from RWIS Stations Nos 0403 and 0405 on 2-3 Dec 1993
K1 northbound Friction Precipitation (mm) -A- CMA/NaCI (1) --&- CMA/NaCI (3) -o- NaCl (5) -A- NaCl (7) e Appl CMA/NaCI e Appl NaCl x - Precipitation 16:00 18:00 20.00 22.00 02:00 04:00 06:00 K2 northbound Friction Precipitation (mm) 1 o n n n e e > ec n >> See See es > > >-- 10 o not fot t fo t t So9 O.8 -> 9 n cop n > >> h
'
A
m- CMA/NaCI (2)
0.6 -
4
|
-a- CMA/NaCI (4)
-a- NaCl (6)
0.5 -
°
|
-a- NaCl (8)
0.A -
f
K\ ce -A e Appl CMA/NaCIi
.
I
o Appl NaCI
0.3 -
al-
g '/
3
* |
\\* 2 T KC x -Precipitation 0.2 - A-.
o
0.1
*I
1
e
eof *
|
|
|. --X
0
16:00
18:00
20.00
22.00
00:00
02:00
04:00
06:00
K1 southbound Friction Precipitation (mm) -- CMA/NaCI (13) -&-- CMA/NaCI (15) -o- NaCl (9) -A- NaCl (11) e Appl CMA/NaCI e Appl. NaCl -x Precipitation 16:00 18:00 20:00 22.00 00:00 02:00 04:00 06:00 K2 southbound Friction Precipitation (mm) 1 -o n n r r > > > esc - > > es c > > ec - - >-- 10 ce he > he n > ho c > e 22-9 0.8 => 9 9 > be >> c e pek ss poses por s aaa- 8
0.7 - - 7 --- CMA/NaCI (14) 0.6 =o s s > 6 =--&- CMA/NaCI (16) . -o- NaCl (10) 0.5 ~> °] -a- Nacl(12) 0.4 - - A e Appl CMA/NaClI gs - a 0 Appll. Nag x Precipitation 0.2 - 2 0.1 - 1 %
K
o
2
0 =_ =-- F#--i
{+--
- 0
16:00
18:00
20:00
22.00
00:00
02:00
04:00
06:00
Figure 3:9
Friction measurements on the CMA/NaCl and control sections,
precipitation and the time when treatment was applied on 2-3 Dec
1993. Southbound carriageway.
3.1.2.4 Occasion No 4, 15-15 December 1993
First observation round began: 21.15 on 15/12 Last observation round ended: 08.30 on 16/12
Precipitation: Snow began to fall around 21.00 and went on until 04.00 when it changed to rain.
Temperature: Surface temperature rose from -2°C to 0°C the next morning. Air
'
temperature was a degree or two higher.
Treatment:
_CMA/NaCl
NaCl
15/12
23:00-00:00 15g dry+steel 23:30-00:15
15g dry+steel
16/12
|02:15-03:45 15g dry+steel |0O2:30-03:15
15g dry+steel
05:15-06:45 15g dry+steel |06:15-07:00
20g dry+steel
Comments
The treatments applied on the two sections were similar, three combined runs with
a steel plough and dry salt.
Northbound
CMA/NaCl sections No 1 (K1) and 2 (K2) have better
friction than the other compared sections. This is particularly so at the beginning
of snowfall and not least after snowfall had stopped when friction on these two
sections rapidly increases.
Southbound
When the different sections are compared, friction in both
K1 and K2 is relatively similar even though there is relatively large variation.
During snowfall friction is steeply reduced, especially in K2 where in some cases
it is even less than 0.1. After the end of snowfall, friction increases most rapidly in
Kl and on CMA/NaCl section No 15, while the increase on No 13 is slow. Both
NaCl sections have an improvement which is intermediate. In K2 improvement of
friction is moderate after the snowfall, and at the last reported measurement at
around 08.00 it 1s still relatively low on all four sections.
Temperature (°C) RWIS 0403 Precipitation (mm)
4 T T T T T T T T T T T 8
1 i D 1 t 1 1 1 AAPA 1 1
a aa , A A A A
i 1 1 D 1 i 1 f 1 1 1 A
«he zoo zoos {m oso so ® so zo owo wo zo im om 'm ow om % om owo & wo om omo o ow f Ww - A \- - - A& ~ x z -
f-2 §A \& A ll' LJ[] P A- thaCY XA LA 7
A AA 65 [] l a 2992 A
fy A Aaa G J L S-A_[ "I L3 a
. f . Do L" - EAA 3pS_ : C|anls 1 CP OOHL- |
mg oss ose ise as owe oes ome ome es m % A A A A = a a A egg Ld m m n m mm mn s | - -+- 6
i i A 1 1 A i ll... 1 1 1 1 i 1 1 | 1 l... 1 1 1 1 A 17.3 Wa a aa a es Lol alnbtir;;s, 1"! a e - 1 1 A : ll. 1 1 1 t 1 t ~ Ior 1 i A ( I 1 t 1 1 » A B
_4___ <0 - be o- o- o- -R - fJ - - -d - < < <b o- o- < oce & < be < <0 bose oe < de o- o- o- d e o- o- 4 ose os __._.4
i A A A [7]I 1 1 ix 1 1 t 1 1 6 1 1 l. 1 1 1 x t 1 1 1 1 1 3 i i .. 0 1 0 1 1 1 1 1 i ..l 1 1 1 x 1 1 1 1 1 20 l e a e e -8 i L 1 i 1 1 1 1 ( 1 i i 2 ?! 1 t IXXXI xix t 1 + 1
-10 noe see a soko aoe sus son moe Bulk Pia Bha aos age sow ow sos sas sos s s s an 2
- 12 --- oolSo-3000000000000000000000000000- 0
00:00 04:00 08:00 12:00 16:00 20:00 00:00 04:00 08:00 12:00 16:00 20:00 00:00
I D Surfoce -A- Air -x Precipitation I
RWIS 0405 Temperature °C Precipitation (mm) 4 . . ' 7 r , --- . r - 1 [o b ; pda [44846 pa84C
:%~~0.8
ora Aai
.
.
,
|
.
"
.
,
, , + 0.7*J po l of, peetee? 100 1 0 10 10 1001 fos
4 | . . . -+ 0.6
A fp fouls fru soa shon aoe hoe an' aos ,
, A | | . . f . . . + 0.2
403; AA la l
l 0 1
lo
l lo
le
lo
To
l
po
12 "
|
|
n
|
|
|
f | | | t 000:00 04:00 08:00 12:00 16:00 20:00 00:00 04:00 08:00 12:00 16:00 20:00 00:00 [ii Surface -t- Air xX Precipitofion]
Figure 3:10 Data on surface and air temperature and precipitation from RWIS Stations Nos 0403 and 0405 on 15-16 Dec 1993
K1 northbound
Friction Precipitation (mm)
c mos # > = moc - > >- ec c - > e0> > - >-- 10 c t- Rw,: tot camo n 9 9 + 9 Q.§ -- = - « «= po aos «o « posa » soa pou soa ofa & « Efe je so s j Z gs ae a oa woul 8
(.J < 9 n n n k e e e e k e es <= _- -f «_- fP O A 22> eos e e -+ 7 -#- CMA/NaGCI (1) 0.6 - 0 Ms z z s e z z z e s y ela k eate ely od. 6 --i&k-- CMA/NaCI (3)
| . . . -O- NaCl (5)
0'5* "j""" e 1 ":'_'/":""" e _5 A NOC|(7) 0,4 - - - - = *¥e = = - ® syn =o s of = = > a e tot coc A e Appl..
' . | I..
0.3 - 9 9 > - } Bigg ~ } > > Fo s 7k > -> Ro s n Sl s s > -- 3
°App_..
.
, . . x Precipitatio0.2 - "ot c S t t t e0c >- - tat - - - +4- 2 O. =s n e R e e e p e -f h s f B s e> toc cc} x9 +] 0 * 4 0 o + 0<> k 0 ¢ )5 s 0 20:00 22:00 00:00 02:00 04:00 06:00 08:00 10:00
K2 northbound
Friction Precipitation (mm)
J <8 s k soe £ k k kok £ k . > wou kos Sce ec > > > en > > > + 10 ioc tot tt mot tt tot tt Woe [ooo~ 9
68 -
'
|- 8
0.7 -
7 |--m- CMA/NaCI (2)
66 -
4 -A- CMA/NaCI (4)
-L- NOCI (6)
0.5 -
~5
|
-a-Nacl(@B)
0.4 -
A
e Appl..
0.3 -
a
6 Appl..
. _x__Precipitatio 0.2 - 2 0.1 1 XK 0 - 1 o 20:00 22:00 00:00 02:00 04:00 06:00 08:00 10:00K1 southbound Friction Precipitation (mm) -B- CMA/NaCI (13) --i&-- CMA/NaCI (15) -o- NaCl (9) -A- NaCl (11) e Appl. CMA/NaC -e Appl.. x Precipitatio 20:00 22:00 00:00 02:00 04:00 06:00 08:00 10:00 K2 southbound Friction Precipitation (mm)
J - « s « « posa a «os wow s = o% wow a a % ce s «os e w oa w wage 10
0.9 = s be c > hee he c > he n > hoc > boc -f 9
~ cc eos «sos poe +o wos pos « por «o= ne, 8
0.7 -~ 7 -- CMA/NaCIl (14) 0.6 - 6 |&A- CMA/NaCI (16) -o- NaCl (10) 0.5 - 15) -a- NacLt2 0.4 - A e Appl. CMA/NaC 0.3 - 3 0 Appl'. Nag x Precipitatio 0.2 - 2 0.1 i
O ae emerin rons both. 4 aon fgofp,,A,AMm_ H4 ov_.._.__ + _ __ .___.v.,,_+_a~,___v__"Th, 2222222222222 | O
20:00 22:00 00:00 02:00 04:00 06:00 08:00 10:00
Figure 3:12 Friction measurements on the CMA/NaCl and control sections,
precipitation and the time when treatment was applied on 15-16
Dec 1993. Southbound carriageway.
3.1.2.5 Occasion No 5, 27-29 December 1993
First observation round began: 19.15 on 27/12 Last observation round ended: 22.15 on 27/12 First observation round began: 13.30 on 28/12 Last observation round ended: 13.00 on 29/12
Precipitation: Light to moderate snowfall, at times mixed with sleet, began
'
around 14.00 on 28/12 and went on until around 02.00.
Temperature: Around midday on 28/12 both the surface and air temperatures
were ca -4°C. Temperature then rose and during the night had a
maximum value of 0°C on the surface and 1.5°C in the air. In the
morning of 29/12 surface temperature varied between -3° and 0°C
and air temperature between -1.5° and 1°C.
Treatment:
CMA/NaCl
NaCl
27/12
|15:30-16:30
|20g dry+steel 15:45-16:30
30g dry+steel
19:00-20:00
20g dry+steel 18:45-19:30
30g dry+steel
28/12
20:45-21:45
20g dry
21:00-21:45
30g dry
29/12
|00:00-01:00
15g dry
1:30
30g dry+steel
09:00-10:00
15g dry
04:00-04:45
30g dry+steel
08:30-09:15
20g dry
Comments
This occasion can be broken down into two parts, the evening of 27 December and
28-29 December. In the evening of 27 December the results are relatively
uniform. In K1 on both the north and southbound carriageways all sections have
snow-free values while in K2 it is only the NaCl sections that have this. The
CMA/NaC] sections, on the other hand, have evidently lower friction, especially
on measurement sections Nos 4 and 14.
Northbound
In K1 the effect of CMA/NaC on section No 3 is
slightly inferior to that on the other sections which are relatively similar. In K2, on
the other hand, friction and the effect of deicing is more variable. To start with,
the CMA mixture produces a slightly better effect while the opposite is true in the
latter part of this occasion.
Southbound
In K1 the overall effect of the two methods is relatively
similar. One section with the CMA mixture has a better effect than the NaCl
sections, while on the other section the effect is worse. In K2, on the other hand,
the CMA/NaC] sections in most measurements have better friction than the NaCl
sections.
Temperature (°C) RWIS 0403 Precipitation (mm)
o Khe c nce s oan z a'z s m @
-g { W >s<x>»>0»))))))»»)))))))»)X t +- t ? } ? 0
00:00 06:00 12:00 18:00 00:00 06:00 12:00 18:00 00:00 06:00 12:00 18:00 00:00
[+8urfoce -&- Air -x Precipitation
Temperature °C RWIS 0405 Precipitation (mm)
"F O
-8 <--- | |
%
|
00:00 06:00 12:00 18:00 00:00 06:00 12:00 18:00 00:00 06:00 12:00 18:00 00:00
[A Df Surface -A- Air x Precipi rc rionl
Figure 3:13 Data on surface and air temperature and precipitation from RWIS
Stations Nos 0403 and 0405 on 27-29 Dec 1993
K1 Northbound K1 Southbound
1p o -o- eos c ain ~ > -- 10
- B
09?7 9
-B- CMA/NaCI j . -- CMA/NaCl (1) §§ 4s - sus «ou sys s som- 8 (13) -&- CMA/NaCI dp Las L_ __ ... 4 -i- CMANaCI
(3) ' (15) 0.8 - 8 s s un n n >- -- 6 -O - NaCl (5) MB 40s so >,s = = -o- <- 6 -O - NaCl (9) 0.5 = met tarot t tar t t <1 5 -A -NaCl(7) 0.5 fot to tam tot tet tot 7~ 5 -a -NaCl(11) 0.4 -on n cos n n cus > -+ 4 ® Appl. $4 Bon c cus ~ > yc ~ > 4-4 @ Appl. .B -on =o ,n n n oe - >- -- 3 0.3 Fo -o -o =o ,> -~ - <- 3 CMA/NaCl
© Appl. NaCl © Appl. NaCl
0.2 -on n non n n nn ~ > -+ 2 PP 0.2 40> ~ cus ~ no .> - - G- 2 PP e -q X Precipitation c - 4 ® Precipitation 0 o- | 0 ro o 4+--o-@---4----+ 0 18:00 20:00 22:00 00:00 18:00 20:00 22:00 00:00 K2 Northbound K2 Southbound 1 - + 10 1[ --- -+- 10 4 - DO
+ 9 CMA/NaC! 69 $ - - HZ -_- &At- . +9 -m- CMA/NaCl --- + 8 (2) O8 40+ < << - > <u> < > -g (14)
-&- CMA/NaCl ' ' -&- CMA/NaCI --- +7 (4) 0.7 |
,
+7(16)
... 46 -O -Nacl(6) 0.6 , , +6 -O -Nacl (10) --- T 5 -A -NaCl(8) 0.5 . 1 5 -a -NaCl (12)__________ +4
@ Appl.
04
'
(
j
.
1
4
@ Appl..
- 3
CMA/NaCI
03 |
Cle
eee
CMA/NaCI
o Appl. NaCl
. . o Appl. NaCl0.2 <2 S 0.2
./. ee
°
0.1
q
% Precipitation
01 +
'
'
44
X Precipitation
0
o-
% 0 o 0 o -ai | 0 18:00 20:00 22:00 00:00 18:00 20:00 22:00 00:00Figure 3:14 Friction measurements on the CMA/NaCl and control sections, precipitation and the time when treatment was applied on 27 Dec
K1 Northbound Friction Precipitation (mm) -B- CMA/NaCI (1) --- CMA/NaCI (3) -o- NaCl (5) -A- NaCl (7) e Appl. CMA/NaC ¢ Appl. NaCl 0 I---@&|---@-O@-+---@----@---12" 1400 16:0 18:0 20:0 22:0 00:0 02:0 04:0 06:0 08:0 10:0 12:0 14:0 K2 Northbound Friction Precipitation (mm) r r e on nd n e r a O 9 __ R2 cu n o a o o n ae e aa 2 o c a e 1s _- _+ It _ 1A 7 __ [. A- ~
0.8 aba P s I / Rol s. I _ A._/, ,' 20.
0.7 p | y
/
--m-- CMA/NaCI (2)
0.6
./
.
Tele
-A-CMA/NaCI (4)
0.5
pace
wgn ie
Ro
s
| -B-NaCl (6)
0a
ho
lt
Nof A
ot}
'
|! l
'
'
e Appl. CMA/NaC
0.3
fo' (
-Q
/
0
|
e_ApplNaCl _ |
are
101
[WL
l
og f
1
1
It
LoC
e
kzegk/ do
) s fe fpr
-|
12:0 14:0 16:0 18:0 20:0 22:0 00:0 02:0 04:0 06:0 08:0 10:0 12:0 14:0
0 0 0 0 0 0 0
0 0 0 0 0
Figure 3:15 Friction measurements on the CMA/NaCl and control sections,
precipitation and the time when treatment was applied on 28-29
Dec 1993. Northbound carriageway.
K1 Southbound Friction Precipitation (mm) ece we on na nn e r a 0.9 0.8 0.7 -#- CMA/NaCI (13) 0.6 --&-- CMA/NaCI (15) 0.5 -o- NaCl (9) 0.4 -A- NaCl (11) ' ® e Appl. CMA/NaC 0.3 ( e Appl.. 0.2 . 0.1
I
0
|
12° 14" 16" 18" 20° 22" 00° 02" 04" 06" 08" 10° 12" 14°
K2 Southbound
Friction
' Precipitation (mm)J -o sus s mys som oso sop sos 2 o= s.e s a mos poe ® wos eis s my s = x e = 0.9 - - - ty =- be e «oe a b s sols oosiw most moose bor os le oes co stos a d -08*--j-\-j --- / O. 7 ' os To---I -B- CMA/NaCI (14) 0.6 - -A-CMA/NaCI (16) 0.5 - -o- NaCl (10) 0.4 -A- NaCl (12) ' R e Appl. CMA/NaC 0.3 ' // _ Appl.. 0.2 wf CG) rC [/ 0.1 C> NoX f O - fso -f c ofr] -- ---@- {@ 12° 14" 16" 18" 20° 22" 00" 02° 04" 06" 08" 10° 12" 14"
Figure 3:16 Friction measurements on the CMA/NaCl and control sections, precipitation and the time when treatment was applied on 28-29
3.1.2.6 Occasion No 6, 18-20 January 1994
First observation round began: 21.00 on 18/1 Last observation round ended: 08.00 on 20/1
Precipitation: Snow began to fall around 05.00 on 19/12 and went on the whole day. Around 20.00 it changed to rain and stopped around 22.00. Temperature: In the evening on 18/12 surface temperature was -12°C and air
temperature -13°C. It then rose during the night and next day and
in the evening of 19/12 it was 0°C on the surface and 2°C in the air.
Treatment:
CMA/NaCl
NaCl
19/1
|06:45-07:45
20g dry
07:00-07:45
20g dry
09:15-10:15
20g dry+steel |10:45-11:30
20g dry+steel
12:15-13:15
20g dry+steel |13:00-13:45
10g dry+steel
14:45-15:45
20g dry+steel |16:45-17:30
30g dry+steel
18:00-19:00
20g dry+steel |20:00-20:45
20g dry+steel
23:45-00:30_
20gdry+steel
20/1
|04:45-05:45
15g wet
04:45-05:30
15g dry
Comments
On this occasion, with snow falling over a relatively long time, a lot of treatment
was applied at different times. The number of treatments applied on the test and
control sections is also different. Evaluation is therefore somewhat complicated
since the friction curves cannot be compared directly. Account must also be taken
of the times when the different treatments were applied and their extent. See, for
instance, friction at ca 12.00 in K1 northbound where the NaC) sections have very
good friction, ca 0.75, while the CMA sections have much lower friction, ca 0.3. It
must however be noted that on the NaCl section treatment had been applied
immediately before while on the CMA sections treatment had been applied more
than 2 hours previously. The large difference in friction might therefore be more
an effect of the time that had elapsed since the treatment than the effect of the
treatment itself.
A
Northbound
In Kl there was a slightly better effect on the NaCl
sections even if the opposite occurred in some measurements. In K2 also the effect
of NaC) is slightly better but there is not a lot of difference. Note especially the
last two measurements, made after similar treatment, where the CMA sections are
clearly lower than the NaCl sections.
Southbound
As on the northbound carriageway, treatment with
NaCl produced a slightly better effect, but this is less than might appear from a
first look at the figure. Measurement of friction at around 0500 which shows very
low values on the CMA sections was made prior to treatment on these sections
and, very probably, just after treatment on the NaCl sections. In K2 also NaCl had
a better effect.
Temperature (°C) RWIS 0403 Precipitation (mm)
CA
16 DDD» >»»>»»»>»>>>>>»»>»»»»>»2Li >>¥ x x i>>»»»»»>»»>»»»»»>»»»>»o>»»»>)$>»>»»< 0 00:00 06:00 12:00 18:00 00:00 06:00 12:00 18:00 00:00 06:00 12:00 18:00 00:00
l D Surfoce -#A&- Air -x Precipitation
Temperature °C RWIS 0405 Precipitation (mm)
-16 | | | t | | | | | | | 0)
00:00 06:00 12:00 18:00 00:00 06:00 12:00 18:00 00:00 06:00 12:00 18:00 00:00 |'_|3_ Surface -A- Air x Precipitation]
Figure 3:17 Data on surface and air temperature and precipitation from RWIS Stations Nos 0403 and 0405 on 18-20 Jan 1994
K1 northbound
Friction Precipitation (mm)
I "a" *+" _ cam g 10
0.9 - At 9
0.8 - Ck Ros o r n n } coc o> >> MRJp - <+ 8
0.7 => 8% ¥ c c c c fy rc ccc Fat EM} fle -f 7 -f- CMA/NaCI (1)
06 - - - 6 ~-~«#&-CMA/NGCI (3)
'
e
o
ee N
-A- NaCI (5)
0.8 = or oro fo cr hora fff croc
S) -a-nNact@
0A =-} -to} ycA H oc
-*- Appl
f
6 Appl. NaCl
*X Precipitatio
20 22 00 02 04 06 08 10 12 14 16 18 20 22 00 O02 04 06 08
K2 Northbound
Friction
Precipitation (mm)
1 i i i D f i i i i f 1
i i 1 i
A 09 - Ntoro er cr cr C C C GCNo * Ms Wr n r f f \y p 07 =- her -c cbbc#5 @* Nb -L <1 +7 --0.6 - 6 --&- CMA/NaCI (4) -o- NaCl (6)0.5 - Coe e e d < 2 Mf o N ft OAT 6] -a- Nact®
049 1 [at ol 1 p 17 Dal N) pear 4] ® Appl.
0.3 3 ¢ Appl. NaCl
soa w } /P K*\ xX Precipitatio
0.2 = s a ae a -, K2 eo b Po o a coe f 2 F
0d t t g
zixzx iku:.
ol 1 of g agg]
O
0
20 22 00 02 04 06 08 10 12 14 16 18 20 22 00 O02 04 06 08
Figure 3:18 Friction measurements on the CMA/NaCl and control sections,
precipitation and the time when treatment was applied on 18-20
Jan 1994. Northbound carriageway.
K1 southbound Friction Precipitation (mm) -B- CMA/NaCI (13) --&- CMA/NaCI (15) -o- NaCl (9) -&- NaCl (11) e Appl. CMA/NaC e Appl. NaCl x Precipitatio 20 22 00 02 04 06 08 10 12 14 16 18 20 22 00 O02 04 06 08 K2 Southbound Friction Precipitation (mm) e r e .r-.--.-)i-10
0.4 ~ s se cde ane ane abs asa als
~'" A 9
08*-E\---- -f-F-f-f-k---ki" -Xy3-f-sz*8
BF msd rly b ele ale «le cle lee es de df ie fap n 5 4. 7 --
(14)
0b 1 Ne fof f fo
e
%
I, |. 4, -a- CMA/NaCI (16)
Ho
So ] o A
-o- NacL(10)
a
Cob t t toe
g 4 oa Nyt /Z] 5)
04 -
noe e e se 2 a fa e e MN ¥ L4
|_
e Appl. CMA/NaC
Z
(o o # // ¥ - N ws)
Axe 0 #4470
MR-B---@ ,
0 App!
x Precipitatio
0.2 -
\\ f 4ka | v pg . L0 4 9i i . 1 $7.1 i i % A 1 i i i 1 1 i
0 < n r r ix x.y &C ¥" o e
0 <-A4 0
3.1.2.7 Occasion No 7, 25-26 January 1994 First observation round began: 20.30 on 25/1 Last observation round ended: 13.45 on 26/1
Precipitation: It started snowing around 22.00 and went on until about 10.00 the next day.
Temperature: Surface temperature rose from -5°C in the evening to ca 0°C in the middle of the day. Air temperature rose from ca -3°C to ca 0.5°C.
Treatment: CMA,/NaCl NaCl
25/1 23:45-00:45 20g dry 23.15-00:00 20g dry 26/1 04:00-05:00 20g dry+steel 02:30-03:15 20g dry+steel
08:15-09:15 18g dry+steel 06:15-07:00 20g dry 10:00-11:00 10g dry 10:15-11:00 10g dry
Comments
Northbound The result in both K1 and K2 is that friction improves slightly more rapidly on one of the CMA sections while the other sections are very similar. While it is snowing, there is a relatively large reduction in friction, to ca 0.1.
Southbound In Kl the effect of the two compared treatments is relatively similar. On one of the CMA sections friction increases slightly more rapidly but this is probably due to the fact that the treatment had been applied immediately before. In K2 also friction is relatively similar, even though in one of the CMA sections the rise after it had stopped snowing is somewhat slower.
Temperature (°C) RWIS 0403 Precipitation (mm)
-10 » _ A : ' i | ()
00:00 04:00 08:00 12:00 16:00 20:00 00:00 04:00 08:00 12:00 16:00 20:00 00:00 -O- Surface -A- Air x PrecipitationI
Temperature °C RWIS 0405 Precipitation (mm) 1 + 0.9 mt 0.8 + 0.7 + 0.6 + 0.4 + 0.3 10.2
'
,
.
.
,
,
.
,
,
+ 0.1
-10 +=
|
|
t
}
i } { } } | t 0 00:00 04:00 08:00 12:00 16:00 20:00 00:00 04:00 08:00 12:00 16:00 20:00 00:00 { n Surface -B- Air xX Precipitation]Figure 3:20 Data on surface and air temperature and precipitation from RWIS Stations Nos 0403 and 0405 on 25-26 Jan 1994
K1 northbound Friction Precipitation (mm) 1 - , 09 4 0.8 + -0.7 + -- -B- CMA/NaCI (1) -&- CMA/NaCI (3) -a- NaCI (5) -A- NaCI (7) e Appl. CMA/NaC 6 Appl. NaCI x Precipitatio 20.00 22:00 00:00 02:00 04:00 06:00 08:00 10:00 12:00 14:00 K2 Nortobound Friction ' Precipitation (mm)
J p cos sow sos «age nor syr aos spk sos gor rok wos ros gos sos eos w ks- 10 o r a e
:
-
.
OB 4
t- s c s eyes so =,2 # so #,* * so q =os * gos =o
= sf "r k T 8
be
e
b
b
b
be
b
b
O.7 s n fe n n r r n r r h r f
-'~-//- -+ 7 -R- CMA/NaCI (2)06 - r r e {/ | $|A- CMmaANaci@)
5 , . , e , , -B- NaCI (6)
r a
0.4 - PND Kye 2 1 to / s ff n so o-} 4 e Appl. CMA/NaC
. .* xx . . . .
/ .
e Appl. NaCI
©.3 40
;
>>
wok k a [owe) _ >t
hoe w s ese 3
Log,
. , , . , , Cog) ol x Precipitatio J
ars ey ix nynaff oot oc }?
0.1 e 9-e C .! < cox } 1
X
(J iff esiige -»--*|-o-is--- {}
20.00 22:00 00:00 02:00 04:00 06:00 08:00 10:00 12:00 14:00
Figure 3:21 Friction measurements on the CMA/NaCl and control sections,
precipitation and the time when treatment was applied on 25-26 Jan 1994. Northbound carriageway.