1
School of Innovation, Design and Engineering
Logistics Optimization:
Application of Optimization Modeling in
Inbound Logistics
Master Thesis Work, Innovative Production
(KPP231)30 credits, Advanced level
Master Program in Product and Process Development, Production and Logistics Management (ZKS21)
Khanittha Arayapan
Piyanut Warunyuwong
2 Report code:
Commissioned by: Khanittha Arayapan and Piyanut Warunyuwong Tutor (company): AnnChristine Strigen
Tutor (university): Sabah Audo Examiner: Sabah Audo
3
Abstract
To be a market leader, low cost and responsiveness are the key success factors. Logistics activities create high cost reducing competitiveness of the company, especially for the remote production base. Thus, logistics activities which are delivery planning, freight forwarder and delivery mode selection must be optimized. The focusing area of this paper is inbound logistics due to its big proportion in the total cost and involvement with several stakeholders. The optimization theory and Microsoft Excel’s Solver is used to create the standard optimization tools since it is an efficient and user friendly program. The models are developed based on the supply chain management theory in order to achieve the lowest cost, responsiveness and shared objectives. 2 delivery planning optimization models, container loading for fixed slitting and loading pattern and container loading for pallet loaded material, are formulated. Also, delivery mode selection is constructed by using optimization concept to determine the best alternative. Furthermore, freight forwarder selection process is created by extending the use of the delivery mode selection model. The results express that safety stock, loading pattern, transport mode, and minimum order quantity (MOQ) significantly affect the total logistics cost. Including hidden costs, long transit time and delay penalties, leads freight forwarder selection process to become more realistic and reliable. Shorter processing time, ensured optimal solution, transparency increase and better communication are gained by using these optimization models. However, the proper boundaries must be defined carefully to gain the feasible solution.
Keywords: logistics optimization, supply chain and logistics management, operations research, delivery planning, delivery mode and freight forwarder selection
4
(Acknowledgements)
We would like to thank Sabah Audo, our lecturer and thesis advisor, who gives us a lot of knowledge and advices in Production and logistics planning, Operations research, and Project management. We also acknowledge Mats Jackson, the lecturer and guru in Supply chain management, as well as the other honourable lecturers and staffs of Innovation, Development, and Engineering faculty at Mälardalen University.
Huge thanks to Anders Andersson, AnnChristine Strigen, Petra Andersson, Sven Gulin, and Thomas Pettersson from Procurement Department of Mölnlycke Health Care Headquarters for the support and encouragement. Also warm thank to all Mölnlycke staffs in Gothenburg and worldwide for the hospitality and fika!
A special thanks to Prapat Phupinyokul, the General Manager, Apiluk Lohachitkul, the Planning and Logistics Director, and all members of Executive Management team of Mölnlycke Health Care Thailand who provide us the opportunity to do our thesis work with Mölnlycke Health Care at the Headquarters. And we also would like to express appreciation to Airin Pruettijaraspong, Kornrit Maneerattanayol, Ratchanu Paonil, Piyajit Srehirun, Suthichart Phatummakul, and Nawin Nakbut from Planning and Logistics Department, and Charee Kaewbangphra from Financial and Accounting Department of Mölnlycke Health Care Thailand who support the useful information for the thesis.
Last but not least, we thank all our classmates, both MIMA (international) and Swedish, who always give us friendship and good experience in study and life in Sweden.
5
Contents
1. INTRODUCTION ... 7 1.1COMPANY BACKGROUND ... 7 1.2PROBLEM BACKGROUND ... 9 1.3AIM OF PROJECT ... 10 1.4PROBLEM STATEMENT ... 11 1.5PROJECT LIMITATIONS ... 11 2. METHODOLOGY ... 123. THEORETICAL BACKGROUND & SOLUTIONS METHODS ... 13
3.1 SUPPLY CHAIN AND LOGISTICS MANAGEMENT ... 13
3.1.1LOGISTICS TREND ... 13
3.1.2LOGISTICS AND SUPPLY CHAIN MANAGEMENT ... 14
Procurement ... 14
Manufacturing ... 15
Distribution ... 15
3.1.3THE NEW COMPETITIVE FRAMEWORK: THE FOUR RS ... 15
Reliability ... 16
Responsiveness ... 16
Resilience ………16
Relationships ... 16
3.1.4AGILE SUPPLY CHAIN ... 17
3.1.5RESPONSIVE SUPPLY CHAIN ... 17
3.1.6TRANSPORTATION MANAGEMENT ... 18
3.1.7THE ROLE OF LOGISTICS SERVICE PROVIDERS IN EUROPEAN MARKET ... 19
3.1.8LOGISTICS COST CALCULATION ... 19
3.1.9INFLUENCING FACTORS ... 19
3.1.10TRANSPORT PERFORMANCE MEASURES ... 20
3.1.11PERFORMANCE MONITORING ... 21
Balanced scorecard ... 21
3.1.12LEAN SIX SIGMA LOGISTICS ... 22
3.1.13SUPPLIER SELECTION PROCESS ... 23
3.2 OPERATIONS RESEARCH ... 24
3.2.1LINEAR PROGRAMMING ... 26
3.2.2INTEGER PROGRAMMING ... 28
3.2.3PROCESS/PATTERN SELECTION MODEL ... 32
3.2.4LOGISTICS OPTIMIZATION ... 32
3.2.5LOGISTICS SYSTEM OPTIMIZATION ... 33
Total cost ... 33
Horizontal integration ... 33
Vertical integration ... 34
3.2.6TRANSPORTATION OPTIMIZATION ... 34
4. CURRENT STATE ANALYSIS ... 35
4.1CURRENT PROCESS... 35 4.1.1 Material Procurement ... 35 4.1.2 Logistics Procurement ... 35 4.1.3 Material Planner ... 36 4.1.4 Freight forwarder ... 36 4.2PERFORMANCE MEASUREMENT ... 37 4.3DISTURBANCE ANALYSIS ... 38
6
4.4COST STRUCTURE ... 41
5. APPLIED SOLUTION PROCEDURES ... 43
5.1CASE STUDY 1:THE DELIVERY PLANNING OPTIMIZATION ... 43
5.1.1 Delivery choices optimization: with fixed loading pattern for the roll materials (Model 1) ... 43
5.1.2 Container loading optimization – material on pallet (Model 2) ... 44
Case A: Full-pallet purchase ... 45
Case B: Not full-pallet purchase ... 46
5.2CASE STUDY 2:THE ALTERNATIVE SELECTION ... 48
5.2.1 Delivery mode/container size selection (Model 3) ... 48
5.2.2 Freight forwarder selection (Model 4) ... 50
6. RESULTS AND ANALYSIS ... 54
6.1CASE STUDY 1:THE DELIVERY PLANNING OPTIMIZATION ... 54
6.1.1 Delivery choices optimization: with fixed loading pattern for the roll materials (Model 1) ... 54
6.1.2Container loading optimization – material on pallet (Model 2) ... 55
6.2CASE STUDY 2:THE ALTERNATIVE SELECTION ... 57
6.2.1 Delivery mode/container size selection (Model 3) ... 57
6.2.2 Freight forwarder selection (Model 4) ... 58
7. DISCUSSION ... 60
7.1OPTIMIZATION ... 60
7.1.1Boundary of the constraints ... 60
7.1.2Limitation of Solver ... 60
7.2COMPANY’S CONSTRAINTS ... 60
7.2.1Master roll width and slitting & loading pattern ... 60
7.2.2Safety stock ... 61
7.2.3MOQ and full-pallet order ... 61
7.2.4Cost calculation ... 61
8. CONCLUSIONS & RECOMMENDATIONS ... 63
8.1CONCLUSION ... 63
8.2RECOMMENDATION ... 63
9. REFERENCES ... 65
10. APPENDICES ... 67
10.1MODEL 1:PATTERN SELECTION:FIXED SLITTING AND LOADING PATTERN ... 67
Figure A 1 Solver of Model 1 (1) ... 67
Figure A 2 Solver of Model 1 (2) ... 68
Figure A 3 Solver of Model 1 (3) ... 69
10.2MODEL 2:CONTAINER LOADING OPTIMIZATION – MATERIAL ON PALLET ... 70
Figure A 4 Solver of Model 2-Case A(1) ... 70
Figure A 5 Solver of Model 2- Case A (2) ... 71
Figure A 6 Solver of Model 2- Case A (3) ... 72
Figure A 7 Solver of Model 2- Case B (1) ... 73
Figure A 8 Solver of Model 2- Case B (2) ... 74
Figure A 9 Solver of Model 2- Case B (3) ... 75
10.3MODEL 3:DELIVERY ALTERNATIVE SELECTION ... 76
Figure A 10 Solver of Model 3 ... 76
10.4MODEL 4:FREIGHT FORWARDER SELECTION WITH ALTERNATIVE SELECTION ... 77
Figure A 11 Solver of Model 4 (1) ... 77
7
1. Introduction
1.1 Company background
Mölnlycke Health Care is a world leading manufacturer of single-use surgical and wound care products and services for the professional health care sector. The mission of the company is to be “a
global company that provides outstanding solutions for safe and efficient surgical procedures and gentle and effective wound healing” [1].
Mölnlycke Health Care’s business is divided into two divisions, the surgical division and the wound care division, which have 62% and 38% of sales respectively. The surgical division offers safe and efficient surgical solutions through a wide range of single-use products in order to minimize the risk of infections for patients and protect health care workers. Key brands include BARRIER®, Biogel® and HiBi®. The surgical division also offers custom produce trays, known as Procedure Pak®, that add value by reducing time and resources needed to prepare a surgery delivery and cost efficiencies. The wound care division offers gentle and effective wound healing and provides a range of unique products based on a patented soft silicone technology, Safetac®: e.g. Mepilex® and Mepitel®, together with surgical, absorbent and fixation dressings, e.g. Mepore ®. The assortment also has supplementary portfolios in compression, dermatology and orthopedics, as well as products for hard-to-heal wounds, Xelma®, extra cellular matrix protein [1][2].
8
Mölnlycke Health Care started operations as an independent company in 1998 and was acquired from Apax Partners by Investor in January 2007. Currently, the company has about 6,200 employees and manufacturing plants in Belgium, the Czech Republic, Finland, France, Malaysia, Thailand, and the U.K as well as having suppliers producing in China, Japan, Dominican Republic, and US etc [1].
The Thai factories in where this thesis focuses are the important subsidiaries under surgical division as they contribute 44% of the company’s factories production income. There are two factories, TH16 and TH18, which have 1,600 employees in total and produce surgical gowns and drapes brand Barrier. The production is labor intensive. Because of quality restriction, 90% of material value or 65% of total article numbers used in Thai factories are imported from the qualified overseas suppliers. In addition, the large amount of these imported materials is bought with the incoterms (international commercial terms) EXW (Ex Works) which have the deliveries handled by the company and CIF (Cost, Insurance and Freight) which the suppliers are responsible for the deliveries. The company’s materials classified by delivery term and country of origin are shown in Table 1 [2].
Advanced Wound Care
Advanced wound
care includes moist wound healing dressings that minimise pain and trauma at dressing change, minimise the risk of infection and initiate healing in hard to heal wounds Conventional Wound Care Conventional wound care includes surgical dressings and fixation products.
The division also includes compression, dermatalogy, and antiseptic products Drapes & Staff Clothing Sterile surgical drapes and staff clothing are used in the operating room to help reduce the risk of post-operative wound infections and protect the patient and the surgical team Sterile surgical gloves are a medical device worn by the surgical team and form a critical barrier between patient and staff in helping to reduce the risk of cross infection Wound Care Division Surgical Division Antiseptics Surgical Gloves Custom Procedure Trays Antiseptics are antimicrobial substances that are applied to the skin or surfaces to prevent the transmission of pathogens Custom Procedure Trays are customized to include single-use medical products for a specific surgical procedure and if necessary specific staff
9
Table 1 2009 budget categorized by value and number of article
Categorized by Value (%) Number of Article
(%) Overseas 90 65 Delivery term CIF 47 16 EXW 43 49 Country of origin US 47 25 Europe 40 38 Asia 3 3 Local 10 35
Reference: Company’s 2009 material budget for Thai subsidiaries
To be able to focus on the core competence, the company uses the freight forwarder to handle the EXW shipments. After several years of using the only one freight forwarder for every shipment, recently the company has decided to change the strategy to select one more competitive freight forwarder to compete with the existing one. To work with dual-freight forwarder, the shipments will be divided to 2 main routes, US and Europe origin. The freight forwarder who has the competitive price with the acceptable performance will win the tender and takes care of all shipments in the route. These freight forwarders are responsible for all aspects of the freight without interference in choice of carriers, ports or terminals from the company.
1.2 Problem background
Today’s market condition becomes more volatile and causes more pressure on cost and speed. Due to high competition in the globalization market and the more demanding customer, the product life cycle and time to market become shorter, price competition is tougher, and the responsiveness to changing demand is more crucial. Beside high product quality, total cost and response time seem to be the key success factors and important missions that the company and its supply chain and logistics functions have to optimize in order to achieve the cost and service leadership.
Because the production of surgical gown and drape is labor intensive, the Thai factories which have low labor cost and efficient production system offer the strength and competitive advantage with low production cost. However, the factories locations are remote from suppliers and customers, the factories endure the high logistics cost and time. Nevertheless, the company realizes this hinder and tries to lessen it by implementing several projects such as S&OP, Value Engineering, and Procurement excellence program to increase the supply chain and logistics performance. The logistics optimization proposed in this paper is another idea to increase supply chain and logistics efficiency through mathematical programming.
10
Principally, the business context and the optimization concept have the same goal. They both try to reach the objective functions that are maximizing profit or minimizing cost bounded by the certain constraints which are the limited resources, budget, capacity, and so on. Therefore, the company should take the optimization concept as the framework to carry out in every process to achieve the maximum level of the desired competitive advantages, the cost leadership and service leadership.
Since these two objectives are somehow conflict to each other, the company has to trade-off these conflicting goals reasonably. The systems optimization which includes all desired objectives and related costs and constraints in the calculation will help the company make the effective and efficient logistics decision and design.
There are several decisions made in different functions and progression of supply chain processes which each of them affects the overall logistics costs, time, quality, reliability, and utilization which are the major logistics performance. The optimization tools are required to trade-off between these conflicting goals to get the optimal solution which gives the lowest cost but best performance (time, quality, utilization), especially in the essential and costly processes: the freight forwarder selection, the delivery mode/ route selection, and delivery planning, for instance.
Moreover, the current decision makings concerning supply chain and logistics cost and time are done by the responsible functions individually and separately. Some costs and constraints from the other functions may not be included in the consideration. Also, the current tools are not designed in respect to the optimization concept. Therefore, the standard tool and method for optimization are needed to ensure the efficient decision making and enhance the information transparency and better communication within the organization
The current MRP calculation, for example, is designed based on singular item basis. When the company wants to utilize the container space by combining all materials from the same source or supplier in the same shipment, SAP, which is used to manipulate MRP, can not calculate the best delivery for the combined shipment. The material planner would have to manipulate it manually with Microsoft excel. Consequently, different planners may utilize different methods of calculation and get different answers depending on skill and experience. Therefore, the standard tool and method with all relevant costs and constraints from concerning parties are needed for the most effective decision making.
Besides, the decisions such as selection of supplier, freight forwarder, delivery route, delivery mode, and purchasing and planning parameters setting (e.g. minimum order quantity, safety stock, etc) are also the important activities significantly affecting on the overall organizational cost and performance. Hence, all concerning costs and impacts should be taken into consideration in order to choose the optimal value that best meets the organization’s shared objective.
1.3 Aim of project
The aim of this project is to develop tools and methods in order to aid the supply chain and logistics functions in making efficient and optimal decisions. The focused areas are freight forwarder selection, delivery mode and route selection, and delivery planning. With the mathematical programming optimization’s ability to determine the optimal solution which is the minimum overall costs or maximum
11
profit, the lowest overall logistics cost with best delivery time and performance under provided resources and constraints is expected to be achieved.
The standard optimization tools and method are also expected to ensure the efficiency and transparency of the decision making. Moreover, the communication within the supply chain would be improved due to the same standard tools deployment.
1.4 Problem statement
Mölnlycke Health Care is a global company, thus, several decisions are made by respective functional units. As a result, the objectives priority of all functions is different which affects on each other’s operation. For example, ordering restrictions such as whole pallet purchase may cause higher material and inventory cost. On the other hand, if the ordering amount is not full-pallet, it will cause several problems in warehouse management. Moreover, the insufficient sharing of knowledge and information may not provide the system optimization. Furthermore, some hidden costs such as cost of delay and long transit time are difficult to be determined; consequently, the selection has tended to focus more on the material/service price. Moreover, the current tool works with singular item basis rather than the integrated optimization, so the users need to create the extra tool to make a decision which it has never been proved that is the optimal solution. Finally, decision making efficiency depends on the company’s personals’ experience and skill. Therefore, standard working process and decision should be set up being assured that all decisions are made in the most suitable way.
1.5 Project limitations
The scope of the study will be limited to the procurement and supply of the imported materials and logistics service for Barrier production in Mölnlycke Health Care Thailand. Although the company’s supply chain includes the activities of production and distribution from the manufacturing sites to the distribution center, the project will exclude them from the scope of work in order to focus only the inbound logistics. However, the tools and methods developed in this project are expected to be the models which can be adjusted for use of other supply chain and logistics functions and other branch of the company.
In order to test the validity of the optimization tools, the specific cases are chosen as the samples - Delivery of materials from supplier X for Drape production in one plant of Thai factory is
selected for the delivery choice optimization with fixed slitting and loading pattern.
- Shipment from supplier Y is selected for the container loading optimization for pallet loaded material, delivery mode selection, and freight forwarder selection.
12
2. Methodology
An action research is used to conduct this research. The authors were participated in the organization and assigned to search for the way to optimize the logistics performances of the inbound logistics.
The research strategy of this thesis is a case study. The current situation of a company was studied and explained how and why it has happened. Then the involving variables and cause-and-effect relationship were identified, and recommendations were created to improve the process. Generally, it can be called as explanatory case study [3].
The following four steps have been performed this research. 1. Data gathering
Both primary and secondary data collection techniques are used in the thesis in order to get quantitative and qualitative information for analysis. Working process observation and interview with the company staffs and management have been done to gain the primary data. Several meetings with different functions were set to get all related information. Moreover, historical data such as supplier performance, standard working procedure, supplier evaluation, for instance, are used as the secondary data. Also, the quantitative data from the existing working spreadsheets and the company’s ERP system were accessed and collected.
2. The raw data received from the company has been analyzed and converted to the desirable form and unit in order to formulate the mathematical models.
3. Recently, there are several optimization programs in the market. Each of them provides different advantages and disadvantages. Microsoft Excel Solver has been chosen to apply in this thesis because of its usability and availability.
4. In the test and validation process, the models have been tested in the actual circumstance. Subsequently, the result of the model has been compared to the actual outcome in order to eliminate all flaws. Consequently, the validity of the model is assured that the models represent the actual processes.
13
3. Theoretical background & solutions methods
3.1 Supply chain and Logistics management
In a competitive global market, companies inevitably have to reduce cost. Regarding cost contribution, raw material is a major part of the total cost. Therefore, the companies seek for low cost suppliers from various distant locations for common and more specialized raw materials [4]. As a result, logistics cost is also a significant cost contributor, considering the number of suppliers and the distance from the suppliers. In order to lower suppliers cost, logistics is, thus, a very important aspect to consider.
There are several terms referring to logistics, for example, logistics is the organized movement of materials, information, and sometimes people [4] or Rushton et al. gave an equation to express that “Logistics = Supply + Materials management + Distribution” [5]. Obviously logistics management, especially global logistics management, needs a variety of skills such as buying skill, logistics knowledge, and so forth.
3.1.1 Logistics Trend
As logistics is an important key to become a successful company, there are several parameters affecting the capability of logistics; new product development and order fulfillment, for instance. Logistics system can be depicted as follows;
The foremost goal of logistics is satisfying customers’ demands with effective cost. This idea is supported by Michael Porter who mentioned that a successful company needs to provide the various
Figure 2 Pressure influencing logistics system [5] Increasing customer service requirements Regulator changes Changing materials handling & transport technologies
Improved communications & information technology
Need to redesign and improve efficiency of logistics system Competitive pressure Product proliferation shorter product life cycles
Pressure for improved financial performance & inventory reduction
Change in players & roles in distribution channels
Pressures to develop supply chain vision and co-operation
14
products at a low price. Previously, companies have tried to reduce cost by looking for cheaper supply while customer service level might be reduced. However, if the investment in logistics is increased without consideration of the proper customer service level strategy, the expected profit cannot be reached. Thus, new trend of logistics activity is traded-off on cost and customer service level, known as customer value. Waters et al describes that customer value is a ratio between perceived benefits and total cost of ownership of each customer [6]. Inputs used to calculate customer value should be defined circumspectly because some costs such as opportunity cost and hardly tangible costs can be ignored easily. All in all, a company responding more rapidly to customer requirements at lower costs becomes a leader in the market.
Some companies do not want to invest considerably in logistics assets which might affect on companies core businesses, thus logistics outsourcing and third-party logistics are answers to overcome the logistics issues. On one hand, single logistics activity, transport and warehousing, for examples, cannot cope with the overall logistics problems. Therefore, third-party logistics companies (TPLs) offer several kinds of logistics services which cover planning, controlling, and monitoring services. This allows the companies to manage the whole logistics activities. Advanced information technologies and logistics facilities are provided by TPLs to have higher level of agility in logistics as well as gaining economy of scale. The number of TPLs has grown rapidly though logistics outsourcing cost has greatly increased which is a consequence of their ability to provide value-added services such as custom clearance and brokerage, freight forwarding, cross-docking and shipment consolidation, order fulfillment, and distribution [7].
3.1.2 Logistics and supply chain management
Logistics and supply chain management is an activity to optimize material and information flows along the supply chain with the purpose of meeting the customer demand. The aim of logistics and supply chain management is extending the logistics upstream to the suppliers as well as downstream to final customers to gain the highest profit and spend the lowest cost [8]. Integration of all function units in the market channel is the basis of logistics management philosophy. The link between the market and supply chain can be expressed as follows;
Procurement
Normally, procurement strategies have been made to reduce cost of material which is the biggest proportion of the total cost. However, procurement decisions and procedures are not only influenced by the cost, but also the innovation and lead time which depends on the relationship with suppliers considerably. The concept of co-makership has been expressed by Christopher
MANUFACTURING DISTRIBUTION PROCUREMENT Co-makership Requirement planning Schedule coordination Master scheduling JIT management Flexibility Demand management Quick response Postponement
15
(2006) which is the mutually beneficial relationship between supplier and buyer in place of adversarial posture deteriorating other advantages in the supply chain [8]. The co-makership is a longer-term relationship which adopts process alignment and synchronization from the customer to the supplier. There are many tools to develop the co-makership such as electronic data interchange (EDI) and open communications with real-time data sharing, which can reduce lead time and eliminate inventories.
Manufacturing
Traditional perception of manufacturing increases non-production cost in the factory such as inventory cost and facilities investment. Therefore Lean philosophy has been used in manufacturing processes for decades to eliminate waste of which associated cost would be reduced. Recently, many companies have also concerned about agility which is the ability to provide various product types and volume within shorter lead time. To respond to the unstable market, higher cost may be unavoidable. Thus, the company must consider both agility and cost, so-called “flexibility”. Flexibility can be created by several methods such as one piece flow, where a product is made one at a time. Nevertheless, one piece flow cannot be implemented in all processes as a result of process uncertainty. Subsequently, capacity booking which is a reservation of a fixed cycle capacity is agreed in order to produce many kinds of products according to the real demand. In addition, the lowest-cost products can be produced as work-in process inventory, and then final products which are the higher-cost source will be manufactured only when real demand is known. As a result, the processing time can be decreased.
Distribution
Transport and warehousing were previously perceived as parts of supply distribution. However, distribution is an information-based, valued-added activity which links the marketplace and the factory together. For a successful company, the substantial task of distribution is demand management which is the process of anticipating and fulfilling orders against defined customer service goals [8]. Demand management performance is a consequence of information input quality which comprises sale forecast, production schedule, inventory status, and so forth. Thus, improved information system is increasing information accuracy and reinforcing response speed. Quick response has been invented in order to enable an organization to achieve cost reduction and quicker response of which real demand is shared throughout the supply chain. In order to respond more rapidly, the amount of product transported must be smaller; it results in higher transport cost, but lower inventory cost. Trade-off between transport and inventory cost must be designed carefully to reach the company’s strategies. In addition, postponement can gain more flexibility and minimize inventory by producing generic products for the whole market and assembling customized products to response to the real demand.
3.1.3 The new competitive framework: the four Rs
Customers always seek for companies who can provide higher level of customer value. Formerly, competitive advantages were based on four P’s; product, price, promotion, and place. Unfortunately, 4 P’s cannot respond to the recent market. Thus in place of 4 P’s, four Rs: reliability, responsiveness, resilience,
16
and relationships were created to increase level of customer value and to be a guideline for a new logistics trend.
Reliability
Because of more competitive market, every function unit, including customer, in the supply chain has to reduce cost; inventory must be reduced and delivered to the customers on their demand punctually, for example. The company strategy must also emphasis on reliability as a prime objective. Process design and control which are related to information fastness and accuracy are the keys to enhance logistics reliability. Tools such as RFID and barcoding make the system more reliable. Moreover, supply chain management can simplify the process because the process is considered as the whole process rather than fragmented basis. Non-value-adding activities are discovered, then the numbers of hand-offs can be reduced. As a result, there is a possibility to decrease errors in the chain. Furthermore, a lead logistics service provider (LLP) is used to control quality and guarantee the due date, which imposes charges, can be set up. Normally, buyers who purchase several commodity sources tend to work with LLP.
The main reason for unreliability in the supply chain is performance variability. Six-Sigma implementation reduces variations in the process by identifying the cause of variability and using statistical tools to control the process performance. Six Sigma logistics will be discussed in the later section.
Responsiveness
Responsiveness is the ability to respond to the customer demand quickly. Quick response logistics is a term of transporting smaller quantities directly to the point of use within the shorter lead time. The core activity to reduce time is eliminating non-value-adding activities. This implies the number of tasks operated is reduced. Even some cost may increase as a result of eliminating redundant stages; however, the final result is cost effective. Another important key influencing responsiveness of the logistics system is information transparency. If there are some obstacles or difficulties to approach information, time to respond to the real demand will be extended as well.
Resilience
One of the market characteristics is being dynamic, so there are, constantly, risks and uncertainty. Especially in the global supply chain, risks are higher and more difficult to control. Thus, buffers in forms of inventory and excess capacity, for instance, are created in order to absorb risks; however, number of buffers depends on customer service level strategies of the company. Buffers are not made in all nodes but normally only in the critical function units. Besides, audit risk team should be set up to follow up the risk management policies whether all risks are still managed and mitigated.
Relationships
Due to wider range of product requirement, the number of stakeholders also increases. The relationships within the supply chain have higher importance. Furthermore, logistics management is a thread connecting the inbound and outbound flows. Accordingly, the strong relationships with supplier network can augment the possibility to improve quality, reduce cost, and response quicker. For example, good relationship creates trust between the supplier and the
17
customer, so the real data is shared and the vendor can see customer demand directly to prepare the capacity and replenishment instead of waiting for placed orders. This sort of relationship can be identified as vendor managed inventory (VMI).
Previously, logistics improvement is not so much concerned because of difficulty in measurement. Some companies operate vertical organization which is a hindrance to develop logistics system. Contrary, horizontal organization enhances company competence with information system that see-through information since forecast until inventory exists. The organization structure of the international company should be based on full integration with the core business to triumph over culture barriers and geographic obstacles. The system such as ERP allows the supply chain to become truly demand-driven by means of shared information.
3.1.4 Agile Supply Chain
Agility is defined as a comprehensive response to the challenges posed by a business environment dominated by change and uncertainty [9]. For a company, the agility means capability of turning continually and unpredictably changing customer opportunities into profitability. In addition, the ability to match supply with demand under ever increasing levels of volatility can be defined as the agility [10]. Generally, it can be categorized into four sub-groups, with different focus, that is, strategies, technologies, systems and people [11].
The agile supply chain has a number of characteristics as follows [10]:
- Market sensitive: That means being closed to the end users trend in the market and being able to seize the opportunity by reacting to the changing trend rapidly.
- Virtual: In agile supply chain, virtual organization is extended by sharing information among all the whole supply chain partners.
- Network-based: Flexibility is obtained by using the strengths of specialist players.
- Process aligned: An agile supply chain is of high degree of interconnectivity between the network members.
3.1.5 Responsive Supply Chain
By using market knowledge and virtual corporation to catch the profitable opportunity, flexible manufacturing such as agile manufacturing is needed to tackle the changing market condition; however, agile manufacturing only focuses on speed and flexibility not concerning on cost. In contrast, lean production which is developed to reach goal of reducing the cost by eliminating unnecessary non-valued adding activities, lacks speed and flexibility. As a result, there is a need to develop an effective supply chain which is flexible, rapid and cost concern at the same time. The responsive supply chain which is defined as “a network of firms that is capable of creating wealth to its stakeholders in a competitive
environment by reacting quickly and cost effectively to changing market requirement” combines all
18 3.1.6 Transportation Management
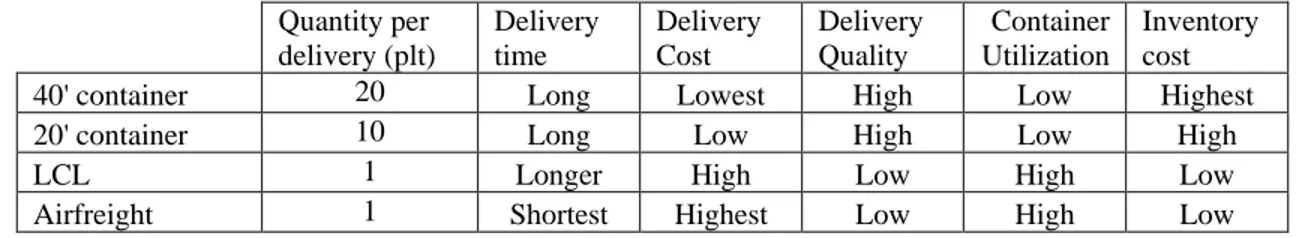
Because of the recent global logistics, transportation management is essential. The fraction between transport cost and the total cost depends on the product’s properties. Sand and coal, for instance, creates high transportation cost proportion of its total cost while electronics appliances have less transportation cost fraction. Also, transportation mode affects on responsiveness and agility in the supply chain. Normally, transport mode is chosen according to customer service level of products and characteristics of transportation type which are dependability, time-in-transit, market coverage, flexibility, loss and damage performance, and ability to provide more than basic transportation service. Transport is performed by various modes, motor, rail, air, water, and pipeline, for instance.
An international transport route comprises several kinds of transport mode. Generally, water mode plays an important role in the international logistics activity. In addition, because of the combination of different transport modes, there are many hand-offs which may create a difficulty in an agreement of payment and responsibility. Thus, Incoterms are developed and issued by the International Chamber of Commerce (ICC) in order to facilitate international trades. It is a codification of international rules for the uniform interpretation of common contract clauses in export/import transactions involving goods [13]. There are thirteen terms in the current version which has been validated in 2000. In summary, all thirteen terms can be depicted in Fig. 4 below:
Figure 4 Incoterms 2000: Transfer of risk from the seller to the buyer [14]
Note: (1) EXW: Ex Works, (2) FCA: Free Carrier, (3) FAS: Free Alongside Ship, (4) FOB: Free On Board, (5) CFR: Cost and Freight, (6) CIF: Cost, Insurance and Freight, (7) CPT: Carriage Paid To, (8) CIP: Carriage and Insurance Paid To, (9) DAF: Delivered At Frontier, (10) DES: Delivered Ex Ship, (11) DEQ: Delivered Ex Quay, (12) DDU: Delivered Duty Unpaid, (13) DDP: Delivered Duty Paid [13]
19
3.1.7 The role of logistics service providers in European market
The international business creates a complicated logistics network and uncertainty. As mentioned that logistics providers can offer more reliability in logistics; therefore, logistics service providers play important roles to reduce cost and time of the operation. However, the company should make a clear extent of service providers’ roles in order to guarantee satisfaction of manufacturers and customers. Two aspects which are normally concerned by logistics providers are geographical scope and range of services. Airlines and shipping lines, for instance, are nodes to link several units together as a network. In the geographical feature of European market, it is a challenge to logistics service companies to provide one-stop shopping because one-one-stop shopping has already existed in some European companies. However, the scope of logistics services in European market has extended to final assembly of products, product tracking and tracing, and inventory management; it is far beyond the general services such as documentation services [15].
3.1.8 Logistics cost calculation
The cost of logistics can be combined by different components according to the analysis such as US logistics cost surveyed by Herbert W Davis & Company (2005) comparing to European logistics cost survey arranged by A T Kearney: it is illustrated in Figure 5.
Figure 5: The proportion of US and European logistics cost [5]
3.1.9 Influencing factors
Due to the complex relationship of influencing factors affecting on logistics cost, the management should make a decision on the logistics strategy which can result in many ways. Besides, each parameter should be understood clearly because it affects on the overall performance and cost. Consequently the
20
proper logistics trade-offs must be obtained in order to become a successful company. Table 2 summarizes the effect of trade-off strategies on finance, production, distribution, and marketing [5].
Table 2 Some potential trade-offs in logistics, showing how different company functions might be affected [5]
Trade-off Finance Production Distribution Marketing
Longer
production runs
Lower production unit costs
Lower production unit costs
More inventory and storage required
Lower prices
Fewer depots Reduced costs No impact Less complicated logistics structure
Service reduction due to increased distance of depots from customers
Lower finished good stocks
Reduced costs Shorter production runs higher production unit costs No need to expand storage facilities Poorer product availability for customers Lower raw material and component stocks
Reduced costs Less efficient production scheduling due to stock unavailability Lower stock-holding requirement No direct impact Less protective transport packaging
Reduced costs No impact Reduced transport modal choice Increase in damaged deliveries Reduced warehouse supervision Cost savings through lower headcount
No impact Reduced efficiency due to less supervision
Lost sales due to less accurate order picking
3.1.10 Transport performance measures
Transport is a major task of logistics service and it is also the biggest proportion of total logistics cost. Therefore, transport improvement is a key to let the company be competitive in the market. To develop the transport performance, four criteria which are finance, productivity, quality, and response time should be focused and measured. Each factor, in turn, consists of many terms; terms in finance, return on logistics assets and logistics asset turnover indicate financial performance. However, which parameters to adopt depend on the company’s concentration and strategies. In the next paragraph, it expresses general measurable parameters in each criterion.
- Financial metrics: Normally, total transport costs and associated ratios such as fleet assets are measured in order to include the capital consumption, especially a fleet owner-company.
- Productivity metrics: The utilization and productivity of transport asset such as containers and vehicles, also operator are evaluated. Weight and volume used are the keys for calculating the transport productivity performance. Regarding [16], there are formulas to determine container utilization:
o CU = Max {Cube utilization, Weight utilization}
o Cube utilization = Occupied cube/(Length x width x height) o Weight utilization = Load weight/Container weight capacity
21
For vehicle utilization is calculated from vehicle operating hours (VOH), vehicle available hours (VAH). The ratio of the operating hours to the available hours of vehicle indicates vehicle utilization, for instance.
- Quality metrics: This indicator emphasizes on reliability and damage measurement. The parameters reflecting suppliers’ performance are percentage of claimed shipment, damage rate, on-time arrival percentage (OTAP), on-time departure percentage (OTDP), and so forth.
- Cycle time metrics: Because time is factually money in the transportation industry [16], transit time, loading and unloading times, detention time, and delayed in traffic time are related to cycle time performance. In some points, cycle time is influenced by the company’s capital. Due to several parameters affecting on the transport time, time breakdown analysis can aid logistics managers to detect the bottle neck of the chain easily and reinforce the opportunity to improve the logistics performance.
3.1.11 Performance monitoring
In order to monitor four aspects of transport performance, information which is an important input should be quantitative and comparative. Besides, the information used in the system should be accurate and timely in order to observe performance successfully. Performance monitoring is a cyclical activity starting with current stage study, after that indentifying the distribution process objectives. The next step is developing appropriate strategies to achieve plan objectives, followed by process control and comparing to the plan. As mentioned, the performance monitoring is a cyclical procedure; therefore, continual review and revision of plans must be progressive.
Balanced scorecard
Performance monitoring process is normally unplanned and unrefined which can create complexity and incompleteness of the process. In general, there are several ways to guide performance monitoring procedure such as the balanced scorecard. Kaplan and Norton introduced this method in 1996. Balanced scorecard is a tool to translate the strategic missions to measurable objectives by using Key Performance Index (KPI) [5]. There are four aspects to consider, which are financial perspective, customer perspective, internal perspective, and innovation and learning. All KPIs of four perspectives should be set up to balance all aspects in order to achieve the business’s goal.
22 3.1.12 Lean Six Sigma logistics
The concept of logistics management is cost reduction and quality improvement. Several companies have implemented lean and Six Sigma in logistics operation. Lean philosophy is about eliminating waste, particularly excessive inventory to decrease lead time and increase velocity by focusing on the total cost rather than cost in a single unit. Whereas, Six Sigma concept emphasizes on studying to remove the negative effects of variation in processes by getting customers’ feedback and using statistical process control tools to ensure accuracy and reliability of the process. Both concepts support continuous improvement activities. In general, Lean Six Sigma Logistics can be defined as “the elimination of wastes through disciplined efforts to understand and reduce variation, while increasing speed and flow in the supply chain” [17].
The proportion of lead time and cost caused by transport is significant, also the cost of unreliability and delaying, unsatisfied customers are difficult to identify and handle. Therefore there have been attempts to improve transport system. “Six Sigma” concept in transport improvement is to minimize time and variation of average transport time. There are several causes of waste and variation, outdated equipments and poorly trained drivers, for instance. What is more, to manage transport efficiently, managers must understand that the logistics network comprises inbound and outbound links. Formerly, companies only regarded outbound flow of material due to market response and allow suppliers or production planners handle inbound flow of materials. As a result, suppliers will add up unexposed transportation cost in material cost; this leads to difficulty in transport management. Thus, many companies take charge of the inbound transportation as well. Nonetheless, some companies have chosen to use freight forwarders with whom the management must maintain proper relationship. Long term
Financial measures Sales growth % Market share by €s Investment (% of sales)
Revenue per employee ROCE*
Internal process measures On-time delivery Quality improvement
Stock turnover Order picking accuracy
Internal process measures On-time delivery Quality improvement
Stock turnover Order picking accuracy
Innovation and learning measures Employee retention Employee satisfaction Employee productivity New product introduction
Training achievement
Figure 6 Balanced scorecard: typical measurements [5] * ROCE = Return on capital employed
23
relationship with shippers can let the company get the lowest priced transport service, but sometimes it causes excess inventory or exceeding customer requirement level. In consequence, logistics network must be optimized as “a big picture” cost trade-offs.
Focusing on the individual shipment, causes of inefficient transport are poor utilization of equipment, operators, and other limited resources. However, some companies have not considered the cause of waste, though they can be rectified: multiple less-than-truckload (LTL) shipments in the same route can be consolidated as a truckload and stops at intermediate destinations where the number of damages may be reduced if the products need to be sorted at each intermediary.
3.1.13 Supplier Selection Process
The effectiveness of supplier selection and evaluation process is the key success factor of a supply chain since cost of materials is the major contribution in the product cost. Consequently, cost and quality of material has a direct impact on the cost and quality of products. By selecting the right supplier, the company can significantly reduce product cost and increase corporate competitiveness [19].
The general processes of global sourcing can be divided into 5 stages [18].
1. Investigation and tendering: The organizations do the market analysis and business plan, then set the global sourcing strategies and establish the operational plan and performance measurements accordingly.
2. Evaluation: Develop supplier selection criteria and estimate target cost and benefit required. 3. Supplier selection and development: Select the best supplier, conduct the negotiation, do the
assessment, and schedule the implementation.
4. Implementation: Assign the working team in both parties, construct the supply and logistics agreement, set the performance target and begin to measure the actual performance.
5. Supplier performance and continuous improvement: Assess the effectiveness of the operations and collaboration in order to identify causes of problems and seek for improvement to become excellence.
Generally, a supplier is selected because of their competence to meet company’s expectation on quality, price, and delivery performance. However, other factors such as reputation in the industry, size of enterprise, geographical location, environmental compliance, capacity, services, lead-time, packaging, transportation storage, and product are also essential and can not be ignored whatsoever. The importance of each factor depends on the product type and its market condition [20]. Therefore, supplier selection is a matter of trading-off the multiple conflicting tangible and intangible, quantitative and qualitative, strategic and operational criteria in the most cost-effective way [19].
The high impact on the corporate success and involvement in various conflicting criteria make the supplier selection becomes one of the most important and difficult decision makings in the supply chain and logistics management. Nevertheless, the combination of all important tangible and intangible factors with strategic and operational factors such as quality, delivery, flexibility and so forth with consideration of relevant constraints in the analysis improves the validity of the decision [19].
24
3.2 Operations research
One of the techniques used to aid a decision making is operations research (OR) method. In general, operations research technique is used widely to solve the problems existing in the reality, especially in the operation management. Nowadays, there are several fields using operations research methods to optimize theirs operations such as manufacturing, transportation, and so forth. Inventory system and production planning are the most successful areas by obtaining the advantages of the operations research. In addition, there are a lot of techniques used in the operations research, linear programming and integer programming, for instance. Among several techniques, linear programming model is mostly used in production planning because of its simplicity and effectiveness.
The characteristics of the operations research result in broad applications in various parts. In order to create a model, the problem is studied and all relevant data are gathered, and then the scientific model is formulated to describe it. Generally, mathematical method is used to explain the relationship among several parameters and constraints into equations, consequently the problem becomes tangible. Furthermore, the model must be validated for the real situation by using it in several experiments. In this step, it can be called as model validation. Moreover, the operations research can reduce conflicts which normally happen in a decision making. The best solution for the whole system is provided by including all interesting parameters into the model. Therefore, an operations research team should be an arrangement of persons from several backgrounds such as mathematics, statistics, computer science, and economics. However, the model ought to be created in the appropriate scope which is not too specific to optimize the whole organization; on the other hand, the model must be particular enough due to convenient use.
The operations research procedure consists of six steps, problem definition and data gathering, mathematical model formulation, computer programming, model test and refinement, preparing the model application, and implementation.
Problem definition and data gathering
The first step to solve the problem by the operations research team is studying the problem. Suitable objective and possible constraints are determined to express the relationships between the focused area and other parts of the organization. Also, data must be collected with problem understanding in order to obtain the accurate data in the appropriate unit.
The proper objective is crucial since the model is used to support the management’s decision. Furthermore, the objective of the model must regard the organization as a whole rather than a single unit. Nevertheless, taking into consideration of the entire organization can cause difficulties and a clumsy model which may result in the imprecise objective. Normally, the objective function is set to provide the maximum profit or minimum cost combining with other objectives, for example, product assortment, workers’ morale improvement, and so forth. Therefore, five parties which are owners, customers, employees, suppliers, and nation must be concerned to create the model.
A mathematical model formulation
Generally, the core of the problem is represented by the mathematical model regarding the interrelationships and aiding to facilitate the system analysis. Moreover, the model can
25
disclose cause-and-effect interaction of the problem. In an optimization model, decision variables, normally known as x1, x2, …, xn, present quantitative decisions which are needed to determine.
The desirable performance is a function of the decision variables such as the total cost, C = 1.5x1
+ 2x2 + … + 6xn. Also, restriction of these decision variables can be defined as constraints
presented in inequalities or equations. Furthermore, parameters identifying coefficients and right-hand sides are the constant numbers in the constraints and the objective function. However, some parameters are difficult to define, thus values estimation of parameters happens. In addition, there is always uncertainty in the system causing the variation of the solution from the reality. Therefore, sensitivity analysis would be a method to evaluate difference of the model’s solution if the parameters changed.
In order to create the model describing the real world problem, it can cause an intractable model. Consequently, model simplification is required to determine the solution while maintain the aim of the model. Model validation is significant to trade-off between the correctness and the tractability of the model. Finally, the objective function should be based on the overall performance measurement by combining several objectives to make the ultimate goal.
Computer programming
The next phase after the mathematical formulating is model development which normally is a computer based procedure. This step must not usually be the most difficult part of modeling the program since there are several available software packages. As mentioned that the model represents the idealized problem, so the optimal solution may not be the same as the best solution in the real world. However, some good model provides the answer which is good enough to be the real world solution, the model needs to be validated and test elaborately. Additionally, the execution must be in the appropriate time, thus a lot of operations research teams occasionally use heuristic procedure to find a suboptimal solution in order to gain the maximum net profit.
Testing the model
Several errors, both major and minor, are regularly contained in the first computer program. As a result, the operations research team must inevitably eliminate flaws in the program before implementing it. In some cases, all flaws can not be removed; however, the major problems must be managed. This process calls model validation which is the testing and improving the program’s process to increase its validity. The validating team should consist of at least one person who is not in the model formulation team in order to disclose mistakes. Also, decision variables and/or parameters must be changed to check the solution being in a reasonable conduct. In addition, the model validating process can compare the result of the model with the historical situation called as retrospective test. However, the historical example used in the validation must be equivalent to the prospect condition otherwise the model can not be a representative of the future situation. The document related to the model is also important to improve confidence in the decision making and aid in identifying the causes of the problems. Preparing the model application
The purpose of the optimization model implementation is providing the optimal solution being independent on personnel. Hence, well-documented system must be installed including the model, solution procedure, and procedure for implementation. Besides, databases and management information system ought to support the model with the aim of providing the latest information.
26
The model implementation phase is significant due to the benefits of the study are obtained at this point. The success of the implementation depends on the management and operating management. So, the operations research team must involve in the beginning of this phase in order to inform the benefits of the model to the management and be assured that the model is used in the proper way. Also, remaining errors can be rectified in this final process. Moreover, the team must acknowledge feedbacks from the operational team and modify the system if it is necessary. After all processes are completed, the related document must be defined clearly, accurately, and sufficiently to run the program well repeatedly.
3.2.1 Linear programming
Linear programming is normally used to solve the allocating resources among competing activities problems [21]. The meaning of linear is all mathematical equations are linear functions while
programming refers to planning. Therefore, linear programming often describes assigning resources to
activities. However, it can also be used for several kinds of problem which theirs mathematical models fit to the linear programming format. The objective of linear programming is planning the problems in order to gain the optimal solution.
A standard form of the model
As mentioned that the mathematical model contains the objectives function which is a function of decision variables under the constraints. There are two kinds of objective function which are maximizing profit and minimizing cost. In addition, activities can be formulated as equations or inequalities. Hillier and Lieberman (2005) expressed the data needed for a linear programming model as in Table 3.
27
Table 3 Data needed for a linear programming model involving the allocation of resources to activities [21]
Resource
Resource Usage per Unit of Activity
Amount of Resource Available Activity 1 2 … n 1 𝑎11 𝑎12 … 𝑎1𝑛 𝑏1 2 𝑎21 𝑎22 … 𝑎2𝑛 𝑏2 . . . … … … … . . . m 𝑎𝑚1 𝑎𝑚2 … 𝑎𝑚𝑛 𝑏𝑚 Contribution to Z per unit of activity 𝑐1 𝑐2 … 𝑐𝑚
In summary, the standard form of maximizing profit can be expressed as follow [21]. Maximize 𝑍 = 𝑐1𝑥1+ 𝑐2𝑥2+ ⋯ + 𝑐𝑛𝑥𝑛
Subject to the restrictions
𝑎11𝑥1+ 𝑎12𝑥2+ ⋯ + 𝑎1𝑛𝑥𝑛 ≤ 𝑏1 𝑎21𝑥1+ 𝑎22𝑥2+ ⋯ + 𝑎2𝑛𝑥𝑛 ≤ 𝑏2 . . . 𝑎𝑚1𝑥1+ 𝑎𝑚2𝑥2+ ⋯ + 𝑎𝑚𝑛𝑥𝑛 ≤ 𝑏𝑚 and 𝑥1≥ 0, 𝑥2≥ 0, … , 𝑥𝑛 ≥ 0 In contrary, the minimizing cost formulation can be shown as follow.
1. The objective function:
Minimize 𝑍 = 𝑐1𝑥1+ 𝑐2𝑥2+ ⋯ + 𝑐𝑛𝑥𝑛 2. The constraints are in inequalities:
28
𝑎𝑖1𝑥1+ 𝑎𝑖2𝑥2+ ⋯ + 𝑎𝑖𝑛𝑥𝑛 ≥ 𝑏𝑖 for some values of i 3. Or some functional constraints are in equation form
𝑎𝑖1𝑥1+ 𝑎𝑖2𝑥2+ ⋯ + 𝑎𝑖𝑛𝑥𝑛 = 𝑏𝑖 for some values of i 4. Define the value of decisions variables:
𝑥𝑗 unrestricted in sign for some values of j
3.2.2 Integer Programming
For the optimization models, many problems are reasonable only when the decision variables are integer, for example, the model determining the optimal number of machines. Namely, it is an integer programming problem which normally still is the linear programming problem. In some cases, however, the decision variables can be integer combining with non-integer, thus, the problem can be defined as mixed integer programming. On the other hand, pure integer programming is the problem containing all integer variables. In generally the application of integer programming is popular in investment analysis, site selection, designing a production and distribution network, and so forth.
Binary variables in model formulation
One of the purposes of optimization is decision making which means the decision variables are yes-or-no. Hence, binary variables or auxiliary binary variables are used to change and intractable problem become a pure or mixed integer programming problem. Binary variables are normally fit in the linear programming and integer programming or the problem which there are minor disparities [21]. There are various cases utilizing auxiliary binary variables represented by 𝑦𝑗 combining with the original variables 𝑥𝑗 to solve the problem.
Either-or constraints
For some optimization models, one constraint must be chosen from two possible constraints in order to provide the best solution. Thus, M which is a very large positive number is applied. Also, y, an auxiliary variable being either 0 or 1, is multiplied with M to eliminate the undesirable constraint. In contrary, the product of 1-y and M pledges the existing of the other constraint. From [21], the example can be expressed as follows.
Either 3𝑥1+ 2𝑥2≤ 18 Or 𝑥1+ 4𝑥2≤ 16,
Using M, y, and 1-y to define the desirable constraints 3𝑥1+ 2𝑥2≤ 18 + 𝑀𝑦
29
According to these equations, if y was equal to 1, the second constraint would be chosen to hold, whereas if y was 0, the first constraint would be yes to the first equation.
K out of N Constraints Must Hold
For this case, it is similar to the previous problem where K equal to 1 and N equal to 2. In other word, the general description of this kind of problem is there are K constraints must hold among N possible constraints when K<N and N-K constraints are removed. The common form of constraints can be formulated as below [21].
𝑓1 𝑥1, 𝑥2, … , 𝑥𝑛 ≤ 𝑑1 𝑓2 𝑥1, 𝑥2, … , 𝑥𝑛 ≤ 𝑑2 . . . 𝑓𝑁 𝑥1, 𝑥2, … , 𝑥𝑛 ≤ 𝑑𝑁
Then, the same logic as previous case is applied to defined K constraints must hold and vice versa for N-K constraints. 𝑓1 𝑥1, 𝑥2, … , 𝑥𝑛 ≤ 𝑑1+ 𝑀𝑦1 𝑓2 𝑥1, 𝑥2, … , 𝑥𝑛 ≤ 𝑑2+ 𝑀𝑦2 . . . 𝑓𝑁 𝑥1, 𝑥2, … , 𝑥𝑛 ≤ 𝑑𝑁+ 𝑀𝑦𝑁 𝑦𝑖 𝑁 𝑖=1 = 𝑁 − 𝐾 and 𝑦𝑖 is binary, for i = 1,2, …, N
Functions with N possible values
The situation that there are several possible right-hand-side values of a constraint may happen and only one value provides the best solution. Thus, auxiliary binary variable is used to change it to an integer programming problem. The constraints can be denoted as [21]:
𝑓 𝑥1, 𝑥2, … , 𝑥𝑛 ≤ 𝑑1 or 𝑑2, …, or 𝑑𝑁 Subsequently, the integer programming can be created as follow.
𝑓 𝑥1, 𝑥2, … , 𝑥𝑛 = 𝑑𝑖𝑦𝑖 𝑁 𝑖=1
30 𝑦𝑖 = 1 𝑁 𝑖=1 and 𝑦𝑖 is binary, for i = 1,2, …, N The fixed-charge problem
In an operation, the cost is normally the summation of a fixed charge or set up cost and variable cost depending on the number of activity level. Normally, the total cost can be presented by the following form [21].
𝑓𝑗 𝑥𝑗 = 0 𝑖𝑓 𝑥𝑘𝑗 + 𝑐𝑗𝑥𝑗 𝑖𝑓 𝑥𝑗 > 0 𝑗 = 0, For example
Minimize 𝑍 = 𝑓1 𝑥1 + 𝑓2 𝑥2 + ⋯ + 𝑓𝑛 𝑥𝑛 subject to
given linear programming constraints
Use an auxiliary binary variable,𝑦𝑖, to convert the problem to a mixed integer programming problem. Minimize 𝑍 = (𝑐𝑗𝑥𝑗 + 𝑘𝑗𝑦𝑗 𝑛 𝑗 =1 ) where 𝑦𝑗 = 1 𝑖𝑓 𝑥0 𝑖𝑓 𝑥𝑗 > 0 𝑗 = 0
Moreover, M is used to be assured that 𝑦𝑗 is 1 more willingly than 0 when𝑥𝑗 > 0. Thus, the fixed-charge problem is adapted to the mixed integer programming as following.
Minimize 𝑍 = (𝑐𝑗𝑥𝑗 + 𝑘𝑗𝑦𝑗 𝑛 𝑗 =1 ) subject to
The original constraints, plus
![Figure 2 Pressure influencing logistics system [5]](https://thumb-eu.123doks.com/thumbv2/5dokorg/4541361.115423/13.918.143.765.604.968/figure-pressure-influencing-logistics-system.webp)
![Figure 4 Incoterms 2000: Transfer of risk from the seller to the buyer [14]](https://thumb-eu.123doks.com/thumbv2/5dokorg/4541361.115423/18.918.119.809.542.872/figure-incoterms-transfer-risk-seller-buyer.webp)
![Figure 5: The proportion of US and European logistics cost [5]](https://thumb-eu.123doks.com/thumbv2/5dokorg/4541361.115423/19.918.136.786.510.893/figure-proportion-european-logistics-cost.webp)
![Table 2 Some potential trade-offs in logistics, showing how different company functions might be affected [5]](https://thumb-eu.123doks.com/thumbv2/5dokorg/4541361.115423/20.918.125.794.194.555/table-potential-logistics-showing-different-company-functions-affected.webp)
![Figure 6 Balanced scorecard: typical measurements [5]](https://thumb-eu.123doks.com/thumbv2/5dokorg/4541361.115423/22.918.150.760.114.520/figure-balanced-scorecard-typical-measurements.webp)
![Table 3 Data needed for a linear programming model involving the allocation of resources to activities [21]](https://thumb-eu.123doks.com/thumbv2/5dokorg/4541361.115423/27.918.99.836.135.539/table-needed-linear-programming-involving-allocation-resources-activities.webp)