J
Ö N K Ö P I N G
I
N T E R N A T I O N A L
B
U S I N E S S
S
C H O O L
JÖ N KÖ P I N G U N IVER SITY
F D I a n d G R O W T H
T h e C a s e o f T u r k e y
Bachelor Thesis within Economics
Author: Bengü Kaya
Supervisor: Per-Olof Bjuggren
Deputy supervisor: Andreas Högberg
i
Acknowledgements
I would like to thank my supervisor Per-Olof Bjuggren and deputy supervisor
An-dreas Högberg for the help, guidance and support during the process of writing this thesis.
I would like to thank especially to my parents, my brother, my boyfriend and my
daughter Asya for their great patience. Without their support, love and encouragement I
would not finish my Bachelor thesis.
June, 2009, Jönköping, Sweden
Bengü Kaya
Foreign Direct Investment, Economic Growth, Eclectic
Para-digm, Turkey, Granger Causality, Time Series
JEL Classification F21, F43, 053, C01, C22
iii
Table of Contents
1
Introduction ... 1
2
Background ... 3
2.1
Turkey’s Economy ... 3
2.2
Overview of FDI in Turkey ... 3
2.3
Previous Studies ... 6
3
Theoretical Framework ... 8
3.1
Definition of FDI ... 8
3.2
Different Types of FDI ... 8
3.3
Benefits and Disadvantages of FDI ... 9
3.4
Determinants of FDI ... 10
3.5
FDI Theories ... 11
3.5.1
The Evolution of FDI Theories ... 11
3.5.2
The Eclectic Paradigm ... 11
3.5.2.1Ownership Advantage (O) ... 11
3.5.2.2Location Advantage (L) ... 12
3.5.2.3Internalization Advantage (I) ... 12
3.6
Location Advantages of Turkey ... 13
4
Method ... 14
5
Empirical Analysis ... 16
5.1
Descriptive Data ... 16
5.2
Granger Causality ... 16
5.2.1
Data Statistics ... 17
5.2.2
Unit root test ... 17
5.2.3
Granger Causality ... 17
5.3
Regression Results and Analysis ... 18
6
Conclusion and Suggestions for Further
Research ... 21
7
References ... 22
8
Appendices ... 27
8.1
Determinants of international products ... 27
8.2
Summary of Previous Studies ... 28
8.3
Turkey’s location advantages for FDI ... 29
8.4
Correlation Matrix of FDI and Growth ... 29
8.5
FDI Inflows % and GDP %, 1970-2007 ... 30
8.6
Descriptive statistics of Granger Causality ... 30
8.7
D (FDI) Correlograms Table ... 30
8.8
D (GDP) Correlograms Table ... 31
8.9
Level and First differences of FDI and GDP ... 31
v
Figure 1: FDI Inflows to Turkey and World ... 1
Table 1: Augmented Dickey-Fuller Test ... 17
Table 2: Unrestricted Cointegration Tests ... 17
Table 3: Pairwise Granger Causality Tests ... 18
1
Introduction
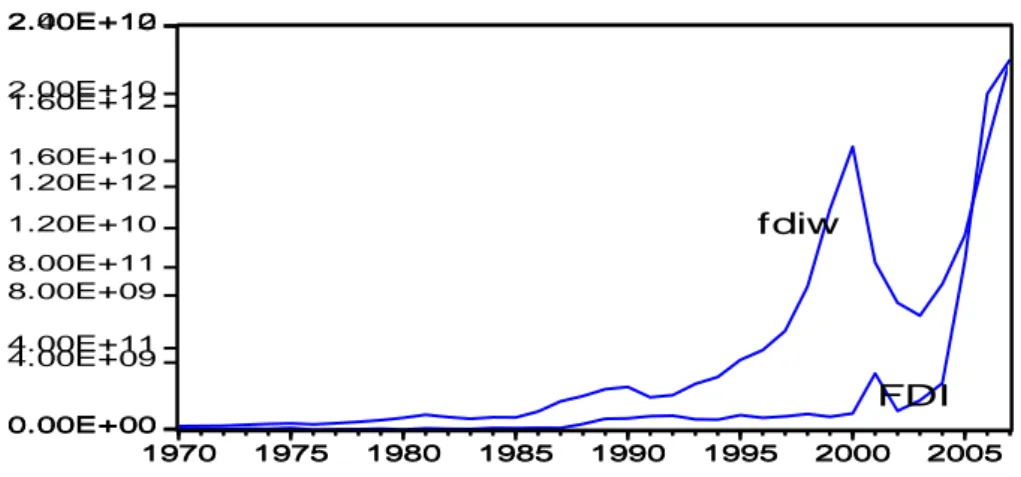
Figure 1: FDI Inflows to Turkey and World
Source, WID (2008), where fdiw represents FDI inflows in world and fdi is representing inflows in Turkey.
0.00E+00 4.00E+09 8.00E+09 1.20E+10 1.60E+10 2.00E+10 2.40E+10 1970 1975 1980 1985 1990 1995 2000 2005 FDI 0.00E+00 4.00E+11 8.00E+11 1.20E+12 1.60E+12 2.00E+12 1970 1975 1980 1985 1990 1995 2000 2005 fdiw
2
Background
This section is divided into three parts. The first part presents Turkey’s economic history starting
from 1960s and continuing until the present time. The effect of FDI in Turkey is introduced in the second
part. And in the last part the previous empirical studies are presented.
2.1
Turkey’s Economy
6
2.3 Previous Studies
8
3
Theoretical Framework
This section is divided into six parts. First part gives brief different definitions of FDI. In the
second part types of FDI are introduced. The following part presents advantages and disadvantages of the
FDI inflows by the view of MNEs and host country. The fourth part presents the theories of FDI and
growth. The most common used FDI theory, eclectic paradigm, is presented in the fifth part with its specific
advantage stages. And finally in the sixth part location advantages of Turkey is introduced.
3.1 Definition of FDI
10
3.4 Determinants of FDI
3.5 FDI Theories
3.5.1
The Evolution of FDI Theories
3.5.2
The Eclectic Paradigm
12
’
ö
3.5.2.2
Location Advantage (L)
3.5.2.3
Internalization Advantage (I)
14
4
Method
2 The explanatory variables did not give any significant results on the dependent variable. Due to getting the best result all variables are lagged one year.
16
5
Empirical Analysis
In the first part of this section descriptive data of GDP growth and FDI inflows are presented.
The log-run and short-run relationship of economic growth and FDI is analyzed in the second part. And
finally in the last part the regression model analysis is presented.
5.1 Descriptive Data
5.2.1
Data Statistics
’
5.2.2
Unit root test
Table 1: Augmented Dickey-Fuller Test
Variable
t-statistic
Probability(5% level)
Growth
-6.860497 -2.948404FDI
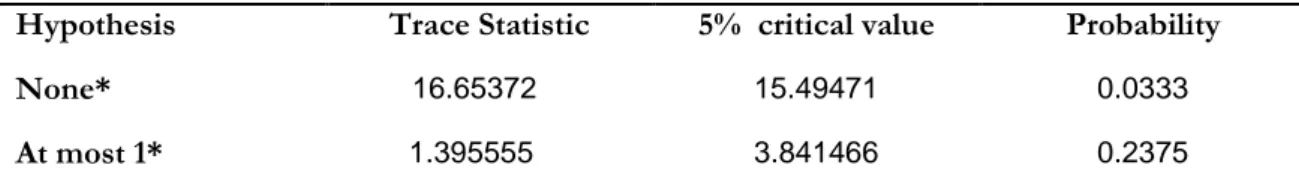
-3.705381 -2.951125Table 2: Unrestricted Cointegration Tests
Hypothesis
Trace Statistic
5% critical value
Probability
None*
16.65372 15.49471 0.0333At most 1*
1.395555 3.841466 0.2375*denotes rejection of the hypothesis at 5% level
18
Table 3: Pairwise Granger Causality Tests
Hypothesis
F-Statistics
Probability
GROWTH does not Granger Cause FDI
4.27135
0.04644
FDI does not Granger Cause GROWTH
0.22509
0.63823
5.3 Regression Results and Analysis
20
Variable
1
2
3
4
5
6
GROWTH
t-1 2.97E+08(1.48) 2.31E+08 (1.45) 2.41E+08 (1.58) 76424570 (0.52) 1.14E+08 (1.71)* 1.11E+08 (1.70)*
OPEN
t-1 2.17E+10(4.71)*** 8.99E+09 (1.18) 1.02E+10 (1.51) -1.27E+09 (-0.39)
POP
t-1 -4.98E+09(-2.05)*** -4.80E+09 (-2.21)** -3.04E+09 (-3.03)*** -2.76E+09 (-3.98)***
INFL
t-1 -65459375 (-3.07)*** -20010950 (-1.90)* -20731002 (-2.02)*FDI
t-1 1.042268 (11.09)*** (11.73)*** 1.030671R
2 0.059010 0.431012 0.495159 0.609888 0.921540 0.921157Adj.R
2 0.032125 0.397542 0.449262 0.561124 0.908885 0.911302N
37 37 37 37 37 37 DW Stat. 1.859655 1.83766122
7
References
Berkoz, L. & Turk, S.S (2007). Yabancı Yatırımların Yerseçimini Etkileyen Faktörler: Türkiye
örneği, from
http://www.itudergi.itu.edu.tr/tammetin/itu-a_2007_6_2_L_Berkoz.pdf
Doğrudan
ı
24
http://www.fdimagazine.com/news/fullstory.php/aid/1266/EU_entry_poses_threat_to_f
ree_zones.html
http://www.econ.ku.dk/Research/Publications/pink/2004/0430.pdf
ö ö
’
TUIK (2008). Statistics Data
http://www.turkstat.gov.tr/AltKategori.do?ust_id=4
Turkish Embassy (2007). Recent Economic Developments and Buying Property in Turkey,
presentation paper written by Aziz Dogan on June, 5, 2007, from
http://www.turkisheconomy.org.uk/TBCCI_Presentation.pdf
26
’
Türkiye için Doğrudan Yabancı Yatırım Stratejisi’ne Doğru, from
http://www.iaw.uni-bremen.de/~jtholen/tagungen/papers/Yilmaz.pdf
8
Appendices
8.1 Determinants of international products
Types ofin-ternational production
Ownership
advantages Location ad-vantages Internalization advantages Strategic goals of MNEs Types of ac-tivity that favor MNEs Natural re-source seek-ing Capital, tech-nology, access to markets. Possession of natural re-sources. To ensure stabil-ity of supplies at right price; con-trol markets. To gain privi-leged access to resources vis-a-vis competitors. Oil, copper, bauxite, bana-nas, hotels. Market
seek-ing Capital, tech-nology, man-agement and organizational skills; surplus R&D and other capaci-ty; economies of scale; trademarks. Material and labor costs; market size; government policy. Wish to reduce high transaction or information costs, buyer un-certainty, etc; to protect property rights. To protect exist-ing markets, counteract be-havior of com-petitors; to prec-lude rivals from gaining new markets. Computers, pharmaceuticals, motor vehicles, cigarettes Efficiency
seeking As above but also access to markets. Low labor costs incen-tives to local production by host govern-ments. The economies of vertical inte-gration As part of re-gional or global product rationa-lization and to gain advantages of process spe-cialization. Consumer elec-tronics, textiles and clothing, cameras, etc. Strategic asset
seeking Any of first three that of-fer opportuni-ties for syner-gy with exist-ing assets
Any of first three that of-fer technology, markets and other assets in which firm is deficient Economies of common gover-nance; improved competitive or strategic advan-tage; to reduce risks. To strengthen global innovato-ry or production competitiveness; to gain new product lines or markets. Industries that record a high ra-tio of fixed to overhead costs and which offer substantial economies of scale.
28
Author Data Method Result
Balasubrama-nyam et al. (1996) Cross-section data ,46 developing countries between 1970-1985
OLS regressions. FDI has positive effect on export supported countries rather than im-port substituting
Borensztein
et al. (1998) Cross-section data, 69 countries between 1970-1989
Regression analysis. FDI and growth are positively related if the host country has high level of human capital
Alfaro et al.
(2004) Panel data, data set of credit market and eq-uity market indicators in OECD and non-OECD countries be-tween 1975-1995
OLS regression. FDI affects the growth positively, if the country has good financial market
Chowdhury and Mavrotas (2006)
Time series, Chile, Malaysia and Thailand between 1969-2000
Toda and Yamamoto
causality test FDI and growth affect each other only in Chile; other two countries have only bidirectional causality.
Johnson
(2005) Cross-section panel data. 90 devel-and oping and developed countries between 1990 and 2002
OLS regression and
REM FDI inflow and domestic investment have positive effects on economic growth in developing countries but not in developed ones. FDI is affected by corruption negatively in developing countries.
Hansen and
Rand (2006) Panel data, 31 coun-tries between 1970-2000
Granger causality test If the gross capital of FDI increases, the growth will increase too.
Pramadhani
et al. (2007) Cross-section Indonesia between data, 1994-2000
Granger causality test FDI and exports are positively related.
Busse and Groizard (2008)
Panel data, 84 coun-tries between 1994-2003 Cross-country growth regression, generalized method of moments (GMM)
Growth and FDI have limited relation by government regulations.
Carkovic and
Levine (2002) Panel section data, 72 coun-and cross-tries between 1960-1995
Dutt (1997) Cross-country data, North- South coun-tries between 1985-1994
GLS There is no significant relationship be-tween FDI and growth.
Basu et al.
(2003) Panel data, selected 23 developing countries, between 1990-1999
Two-way causality test In closed economy the short-run cau-sality is bidirectional but in the long-run it is from growth to FDI.
De Mello
(1997) Survey Analysis The direction of causality between FDI and economic growth depend on the impacts of FDI determinants. De Mello
(1999) Cross section data, 32 OECD and non-OECD
Causality test In the non-OECD countries FDI and growth have no significant relation-ship.
8.3 Turkey’s location advantages for FDI
Key location factors Competitive position
Market seeking FDI Economic size Economic growth Population size Per capita incomes Efficiency seeking FDI Labor cost
Labor productivity Regional integration zone Labor skills and supply Asset seeking FDI
Supply of engineers and technicians R&D and innovation base
FDI enabling environment Independent FDI Privatization FDI Facilitation process Political commitment Incentives Investment promotion Institutional-Political environment Economic stability Policy certainty
Political interference and corruption Justice system and intellectual property rights
Internal social tensions
Strong Strong Strong Medium Strong Strong Strong Strong Strong Weak Strong Weak Medium Weak Strong Weak Weak Weak Weak Weak Weak
Adopted from Loewendahl & E-Loewendahl (2001)
8.4 Correlation Matrix of FDI and Growth
Correlation FDI GROWTH
30
8.5 FDI Inflows % and GDP %, 1970-2007
8.6 Descriptive statistics of Granger Causality
Variable Mean Maximum Minimum Std. Deviation
GROWTH 0.037491 12.54641 -12.47193 5.809606
FDI 5.94E+08 9.96E+09 -2.22E+09 2.08E+09
8.7 D (FDI) Correlograms Table
Autocorrelation Partial Correlation AC PAC Q-Stat Prob . *| . | . *| . | 1 -0.161 -0.161 1.0366 0.309 . *| . | . *| . | 2 -0.068 -0.096 1.2251 0.542 .**| . | .**| . | 3 -0.226 -0.262 3.3858 0.336 . |* . | . | . | 4 0.128 0.035 4.1065 0.392 . |**. | . |**. | 5 0.197 0.199 5.8574 0.320 . | . | . | . | 6 -0.040 -0.004 5.9301 0.431 . | . | . |* . | 7 0.003 0.082 5.9306 0.548 . | . | . | . | 8 -0.053 0.044 6.0730 0.639 -40 -30 -20 -10 0 10 20 30 1970 1975 1980 1985 1990 1995 2000 2005 gdp% -100 0 100 200 300 400 500 1970 1975 1980 1985 1990 1995 2000 2005 FDI%
8.8 D (GDP) Correlograms Table
Autocorrelation Partial Correlation AC PAC Q-Stat Prob ****| . | ****| . | 1 -0.548 -0.548 12.038 0.001 . |* . | .**| . | 2 0.095 -0.293 12.410 0.002 . |* . | . | . | 3 0.094 0.002 12.788 0.005 .**| . | .**| . | 4 -0.281 -0.289 16.230 0.003 . |**. | . *| . | 5 0.225 -0.131 18.517 0.002 . *| . | .**| . | 6 -0.175 -0.229 19.940 0.003 . |* . | . | . | 7 0.139 -0.046 20.872 0.004 . *| . | .**| . | 8 -0.146 -0.288 21.934 0.005
8.9 Level and First differences of FDI and GDP
-4.00E+09 -2.00E+09 0.00E+00 2.00E+09 4.00E+09 6.00E+09 8.00E+09 1.00E+10 1.20E+10 -4.00E+09 -2.00E+09 0.00E+00 2.00E+09 4.00E+09 6.00E+09 8.00E+09 1.00E+10 1.20E+10 1970 1975 1980 1985 1990 1995 2000 2005 dfdi -15 -10 -5 0 5 10 15 -15 -10 -5 0 5 10 15 1970 1975 1980 1985 1990 1995 2000 2005 dgdpgrowth 0.00E+00 4.00E+09 8.00E+09 1.20E+10 1.60E+10 2.00E+10 2.40E+10 0.00E+00 4.00E+09 8.00E+09 1.20E+10 1.60E+10 2.00E+10 2.40E+10 1970 1975 1980 1985 1990 1995 2000 2005 FDI -8 -4 0 4 8 12 -8 -4 0 4 8 12 1970 1975 1980 1985 1990 1995 2000 2005 gdpgrowth
32
FDI GROWTH OPEN POP INFL
Mean 1.89E+09 4.462564 0.284083 2.009154 46.23112 Median 4.81E+08 5.150450 0.252861 2.068482 47.89100 Maximum 2.20E+10 10.46118 0.568831 2.593257 103.0160 Minimum 10000000 -5.697477 0.083215 0.617152 7.084290 Std. Dev. 4.88E+09 3.977765 0.145387 0.446993 27.84345 Skewness 3.423021 -0.895921 0.444170 -0.909220 0.228418 Kurtosis 13.54841 3.203863 2.127382 3.821983 1.914954 Jarque-Bera 250.3838 5.149409 2.455135 6.305432 2.194539 Probability 0.000000 0.076176 0.293005 0.042736 0.333781 Sum 7.20E+10 169.5774 10.79515 76.34784 1756.782
Sum Sq. Dev. 8.80E+20 585.4368 0.782083 7.392715 28684.54
Observations 38 38 38 38 38
8.11 Correlation Matrix of Estimated Model Variables
FDI
GROWTH
OPEN
POP
INFL
FDI
1
0.098791741
0.624087039 -0.576680624 -0.374071302
GROWTH
0.098791741
1
0.085678947 -0.053968863 -0.354011396
OPEN
0.624087039
0.085678947
1
-0.832385391 -0.050119850
POP
-0.576680624 -0.053968863 -0.832385391
1
0.052812134
8.12 Summary of Variables
Variable Explanation Data Source, Period Expected sign
Dependent variable
Explanatory variables