solutions
+
+
+
+
Ke i th Paust i an
C
O L O R A D OS
TAT EU
N I V E R S I T YJohn M . Ant l e
M
O N TA N AS
TAT EU
N I V E R S I T YJohn She ehan
N
AT I O N A LR
E N E WA B L EE
N E R G YL
A B O R AT O RYEl dor A . Paul
C
O L O R A D OS
TAT EU
N I V E R S I T YAgriculture’s Role
Prepared for the Pew Center on Global Climate Change
by
Ke i th Paust i an
D
E PA R T M E N T O FS
O I L A N DC
R O PS
C I E N C E S& N
AT U R A LR
E S O U R C EE
C O L O GYL
A B O R AT O RYC
O L O R A D OS
TAT EU
N I V E R S I T YJohn M . Ant l e
D
E PA R T M E N T O FA
G R I C U L T U R A LE
C O N O M I C S A N DE
C O N O M I C SM
O N TA N AS
TAT EU
N I V E R S I T YJohn She ehan
S
T R AT E G I CE
N E R G YA
N A LY S I SC
E N T E RN
AT I O N A LR
E N E WA B L EE
N E R G YL
A B O R AT O RYEl dor A . Paul
N
AT U R A LR
E S O U R C EE
C O L O G YL
A B O R AT O RYC
O L O R A D OS
TAT EU
N I V E R S I T YS
E P T E M B E R2 0 0 6
Agriculture’s Role
+
+
Contents
Foreword
ii
Executive Summary
iii
I.
Introduction
1
II.
Mitigation Opportunities: Increased Sinks and Reduced Emissions
7
A. Opportunities to Increase Soil Carbon
7
B. Reducing Agricultural Nitrous Oxide and Methane Emissions
14
C. Measurement, Modeling, and Information Needs
18
D. Additional Benefits of Agricultural Greenhouse Gas Mitigation
23
E. Summary and Policy Implications
24
III. Economic Feasibility of Agricultural Carbon Sequestration
26
A. Economic Studies of Carbon Sequestration
26
B. Factors Other than Opportunity Costs
34
C. Summary and Policy Implications
38
IV.
Bioenergy From Agricultural Lands
40
A. Agricultural Bioenergy’s Potential to Displace Fossil Energy
42
B. Bioenergy’s Impact on Greenhouse Gas Emissions
54
C. Summary and Policy Implications
56
V.
Summary and Conclusions
58
Appendix A
63
References
64
+
+
Foreword
Eileen Claussen, President, Pew Center on Global Climate Change
This Pew Center report is the fourth in our series examining key sectors, technologies, and policy options to construct the “10-50 Solution” to climate change. The idea is that we need to tackle climate change over the next fifty years, one decade at a time. This report is also a companion paper to
Agriculture and Forest Lands: U.S. Carbon Policy Strategies, being published simultaneously.
Our reports on electricity, buildings, and transportation described the options available now and in the future for reducing greenhouse gas emissions from those sectors. Agriculture may be less important than those other sectors in terms of its overall contribution to U.S. greenhouse gas emissions, but it has an important role to play within a strategy to address climate change. Agriculture is important not only because of the potential to reduce its own emissions, but because of its potential to reduce net emissions from other sectors. Agriculture can take carbon dioxide, the major greenhouse gas, out of the atmosphere and store it as carbon in plants and soils. Agriculture can also produce energy from biomass that can displace fossil fuels, the major contributor to greenhouse gas emissions.
Looking at options available now and in the future, this report yields the following insights for agriculture’s potential role in greenhouse gas mitigation:
• If farmers widely adopt the best management techniques to store carbon, and undertake cost-effective reductions in nitrous oxide and methane, aggregate U.S. greenhouse gas emissions could be reduced by 5 to 14 percent.
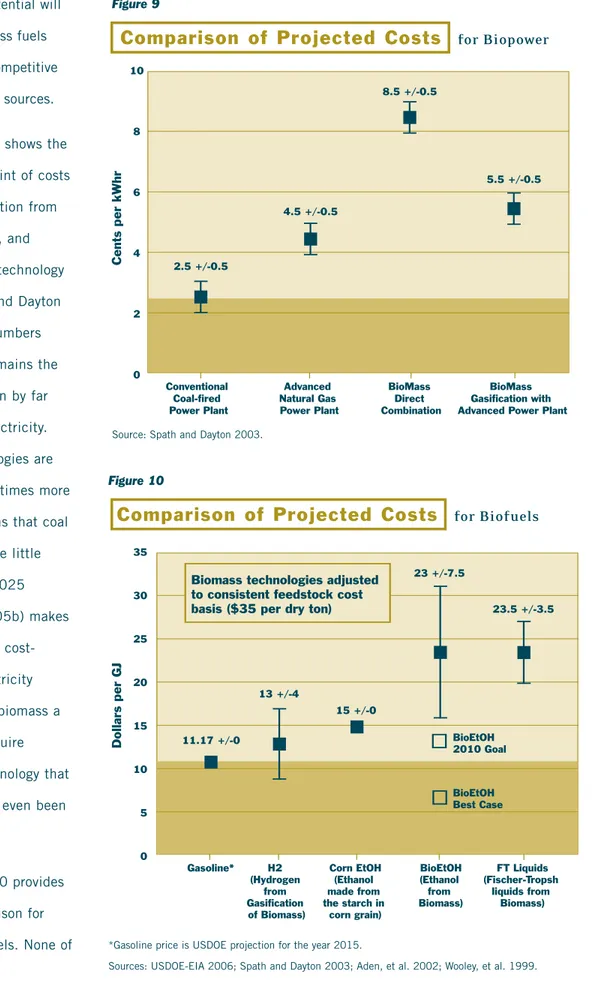
• With technological advances, biofuels could displace a significant fraction of fossil fuels and thereby reduce current U.S. GHG emissions by 9 to 24 percent. Using biomass to produce transportation fuels could also significantly reduce our reliance on imported petroleum.
• Further research is needed to bring down the costs of biofuels and, particularly if agriculture is to participate in a GHG cap-and-trade system, to better assess the impacts of practice changes. • The level of reductions achieved will strongly depend on the policies adopted. Policies are needed to make it profitable for farmers to adopt climate-friendly practices, and to support needed research.
The authors and the Pew Center would like to thank John Bennett, Henry Janzen, Marie Walsh, John Martin, and David Zilberman for their review of and advice on a previous draft of this report.
+
+
Executive Summary
The impact of human activities on the atmosphere and the accompanying risks of long-term global climate change are by now familiar topics to many people. Although most of the increase in greenhouse gas (GHG) concentrations is due to carbon dioxide (CO2) emissions from fossil fuels, globally
about one-third of the total human-induced warming effect due to GHGs comes from agriculture and land-use change. U.S. agricultural emissions account for approximately 8 percent of total U.S. GHG emissions when weighted by their relative contribution to global warming. The agricultural sector has the potential not only to reduce these emissions but also to significantly reduce net U.S. GHG emissions from other sectors. The sector’s contribution to achieving GHG reduction goals will depend on economics as well as available technology and the biological and physical capacity of soils to sequester carbon. The level of reductions achieved will, consequently, strongly depend on the policies adopted. In particular, policies are needed to provide incentives that make it profitable for farmers to adopt GHG-mitigation practices and to support needed research.
The agricultural sector can reduce its own emissions, offset emissions from other sectors by removing CO2from the atmosphere (via photosynthesis) and storing the carbon in soils, and reduce
emissions in other sectors by displacing fossil fuels with biofuels. Through adoption of agricultural best management practices, U.S. farmers can reduce emissions of nitrous oxide from agricultural soils, methane from livestock production and manure, and CO2from on-farm energy use. Improved management
practices can also increase the uptake and storage of carbon in plants and soil. Every tonne of carbon added to, and stored in, plants or soils removes 3.6 tonnes of CO2from the atmosphere. Furthermore,
biomass from the agricultural sector can be used to produce biofuels, which can substitute for a portion of the fossil fuels currently used for energy.
Carbon stocks in agricultural soils are currently increasing by 12 million metric tonnes (MMT) of carbon annually. If farmers widely adopt the best management techniques now available, an estimated 70 to 220 MMT of carbon could be stored in U.S. agricultural soils annually. Together with attainable nitrous oxide and methane reductions, these mitigation options represent 5 to 14 percent of total U.S. GHG emissions. The relevant management technologies and practices can be deployed quickly and at costs that are low relative to many other GHG-reduction options. To achieve maximum results, however, policies must be put in place to promote, and make attractive to farmers, practices that increase soil carbon and efficiently use fertilizers, pesticides, irrigation, and animal feeds. It is also important to ensure funding to improve the measurement and assessment methods for agricultural GHG emissions and
+
+
In particular, this inventory needs to include a network of permanent sites where key management activities and soil attributes are monitored over time. Such sites would provide information vital to helping farmers select the most promising management practices in specific locations.
Profitability of management practices varies widely by region, as does the amount of carbon storage attainable. Initial national-level studies suggest that, with moderate incentives (up to $50/tonne of carbon, or $13 per tonne of CO2), up to 70 MMT of carbon per year might be stored on agricultural
lands and up to 270 MMT of carbon per year might be stored through converting agricultural land to forests. Mitigation options based on storage of carbon in soils would predominate in the Midwest and Great Plains regions; whereas in the Southeast, agricultural land would tend to be converted to forestland. Information on the costs and supply of GHG reductions from reducing nitrous oxide and methane emissions are very limited, and more studies in these areas are needed.
Agriculture can also reduce GHG emissions by providing biofuels—fuels derived from biomass sources such as corn, soybeans, crop residues, trees, and grasses. Substitution of biofuels for fossil fuels has the potential to reduce U.S. GHG emissions significantly and to provide a major portion of
transportation fuels. The contribution of biofuels to GHG reductions will be highly dependent on policies, fossil fuel prices, the specific fossil fuels replaced, the technologies used to convert biomass into energy, and per acre yields of energy crops. In a “best-case” scenario, where energy crops are produced on 15 percent of current U.S. agricultural land at four-times current yields, bioenergy could supply a total of 20 exajoules (EJ)—almost one-fifth of the total U.S. year-2004 demand for energy. This corresponds to a 14 to 24 percent reduction of year-2004 U.S. GHG emissions, depending on how the biomass is used. If advanced conversion technologies are not widely deployed, or if yield gains are more modest, GHG reductions would be on the order of 9 to 20 percent. For biofuels to reach their full potential in reducing GHG emissions, long-term, greatly enhanced support for fundamental research is needed.
Application of best management practices in agriculture and use of biofuels for GHG mitigation can have substantial co-benefits. Increasing the organic matter content of soils (which accompanies soil carbon storage) improves soil quality and fertility, increases water retention, and reduces erosion. More efficient use of nitrogen can reduce nutrient runoff and improve water quality in both surface and ground waters. Similarly, improving manure management to reduce methane and nitrous oxide emissions is beneficial to water and air quality and reduces odors. Biofuel use, particularly substituting energy crops for imported petroleum for transportation, has important energy security benefits. However, as biofuel use expands, it will be important to ensure that biomass is produced responsibly, taking both environmental and socio-economic impacts into consideration.
+
+
Although challenges remain, agriculture has much to offer in helping to reduce net GHG emissions to the atmosphere, while at the same time improving the environment and the sustainability of the agricultural sector. Further research and development will result in improved assessments of GHG contributions from agriculture, increases in agriculture’s contribution to renewable energy for the nation, better ways to manage lands, and design of more efficient policies. Government policy plays an important role in making best management practices and biofuel production economically attractive, and farmers will adopt best management practices for GHG reduction only if they seem profitable. Perceived risks and availability of information and capital play important roles in perceptions of profitability. Thus, risk reduction, availability of information, and access to capital are some of the key issues that must be addressed through policies. With the right policy framework, U.S. farmers will be important partners in efforts to reduce GHG emissions while reaping multiple co-benefits.
+
+
+
I. Introduction
All three of the major greenhouse gases—carbon dioxide (CO
2), methane,
and nitrous oxide—are components of the earth’s natural cycling of carbon
and nitrogen.
Agricultural lands, because of their large extent and intensive management,1havea significant impact on the earth’s carbon and nitrogen cycles, and agricultural activities result in releases of all three of these greenhouse gases (GHGs). While currently a substantial source of GHGs, agriculture has great potential to reduce the buildup of these gases in the atmosphere. Importantly, studies to date suggest that a significant portion of the agricultural practices that could reduce emissions or remove CO2from the atmosphere are relatively low-cost.
The impact of human activities on the atmosphere and the accompanying risks of long-term, global-scale climate change are by now familiar topics to many people. Changes in the atmosphere’s composition have occurred through the buildup of GHGs, which act to trap outgoing long-wave radiation and emit it back to the earth’s surface. The concentrations of these gases have been measured directly over several decades and indirectly (from air bubbles trapped within deep polar ice-cores) over many millennia. This historical record clearly shows an accelerating increase in atmospheric GHG concentrations over the past 150 years, caused by a variety of human activities (IPCC 2001). While most of the increase is due to CO2emissions from fossil fuels, land use and agriculture play significant roles.
Overall, land use change (predominantly in the tropics) and agricultural activities globally account for about one-third of the warming effect from increased GHG concentrations (Cole et al. 1997).
However, ecosystem processes also act to dampen these GHG increases, primarily through the uptake and storage of CO2in plants and soil on land and in oceans. These uptake and storage
processes—referred to hereafter as carbon “sinks”—play a significant role in the global CO2cycle, so that
only about one-half of the CO2emitted from fossil fuels accumulates in the atmosphere. The other half is
absorbed by the oceans and terrestrial ecosystems (IPCC 2001). Without these sinks, the rate of increase in atmospheric CO2concentrations would be roughly twice the present rate.
+
+
Thus, within a broad-based approach to GHG mitigation, in addition to reducing emissions, there is a need to preserve and enhance the sink capacity of the world’s ecosystems, including agriculture. Throughout this report, the term mitigation is used in a broad sense, encompassing both GHG emission reductions and GHG removals from the atmosphere by sinks.
GHG emissions and sinks due to U.S. agriculture, as shown in Figure 1, are reported annually by the U.S. Environmental Protection Agency (USEPA) as part of the U.S. commitment to the United Nations Framework Convention on Climate Change. While these estimates of emissions and sinks are based on the best available scientific information, and are derived by using internationally accepted accounting
procedures, there is considerable uncertainty in their magnitude.
Figure 1
Sources of U.S. Agricultural GHG Emissions
and Sinks (Shown as Negative Emissions) Since 1990
Rice CH4 Fossil Fuels Manure CH4 Manure N2O Fertilizer N2O Ruminant2CH4
Organic soils & liming Soil C sequestration M M T C e q . 1 -30 30 0 60 90 120 150 180 1990 1992 1994 1996 1998 2000 20022003
Sources: USEPA 2005, USDA 2003.
Note: fossil fuel use by agriculture is shown here, although it is reported as part of the energy sector of the U.S. national GHG inventory. 1C eq. stands for carbon equivalent. The carbon equivalents for CH
4and N2O are calculated by using GWPs and carbon equivalents (see Box 1). 2Animals that release methane as part of their normal digestive processes, e.g. cows and sheep.
+
+
Over the past decade, U.S. agricultural soils overall have acted as a small net sink of
approximately 12 million metric tons (MMT) of carbon per year, mainly due to improved soil management practices and the establishment of conservation reserve lands (USEPA 2006). These practices are helping to sequester about 23 MMT of carbon per year in mineral soils, which make up greater than 99 percent of annual cropland area. However, net carbon emissions of about ten MMT of carbon per year from the small area (about 1.3 million hectares [Mha]) of cultivated organic (i.e., peat and muck) soils2offset 40
percent of the carbon gain in non-organic (mineral) soils. Emissions from agricultural liming contribute an additional one MMT of carbon per year, so that—taking into account both soil emissions and sinks—the result is a net sink of about 12 MMT of carbon per year.
CO2emissions from U.S. agricultural energy use amount to about 25 to 30 MMT of carbon per
year. Nitrous oxide emissions (76 MMT carbon-equivalent per year in 2004) are the dominant agricultural contribution to the greenhouse effect when expressed on the basis of their global warming potential (GWP), a measure commonly used to equate the warming effects of different GHGs. (See Box 1 for explanations of GWP and carbon equivalents.) The main sources of nitrous oxide are nitrogen fertilizers
Box 1. Global Warming Potentials; Carbon and CO
2Equivalents
While the physics of the greenhouse effect are similar for all gases, each gas differs in its overall effect on the earth’s radiation balance, depending on the concentration of the gas, its residence time in the atmosphere, and its physical properties with respect to absorbing and emitting radiant energy. A common measure, termed the global warming potential (GWP), is used to equate the effect of different greenhouse gases on a mass basis. By convention, the effect of carbon dioxide (CO2) is assigned a value of one (1) and the
warming potential of other gases are expressed relative to that standard, i.e., on a CO2– equivalent basis. For
the U.S. national inventory, the GWP values used are 310 for nitrous oxide and 21 for methane (slightly different values have been estimated in the report Climate Change 2001 The Scientific Basis from the Intergovernmental Panel on Climate Change). This means that one tonne of nitrous oxide is deemed to have the same warming effect as 310 tonnes of CO2, and one
tonne of methane is deemed to have the warming effect
of 21 tonnes of CO2. Despite its lower GWP relative to
the other gases, the total contribution of CO2to
greenhouse warming is much greater, about 60 percent versus 20 percent and 6 percent for CH4and N2O,
respectively, owing to the much higher concentration of CO2in the atmosphere compared to the other two gases.
Most of the carbon in soils is in the form of complex organic compounds and inorganic carbonates. Consequently carbon in soils is generally quantified in terms of the carbon mass, not CO2(although when this
carbon is released to—or removed from—the atmosphere it is mainly as CO2). A mass of carbon can be expressed
in terms of its CO2equivalent by using the masses
of one atom of carbon (12) and two atoms of oxygen (12 + 2 x 16 = 44) and carbon’s contribution to a molecule of CO2. Thus the CO2equivalent of one tonne
of carbon is 3.66 (44/12) tonnes of CO2. Similarly CO2
can be expressed in terms of its carbon equivalent; the carbon equivalent of one tonne of CO2is .27 (12/44)
+
+
and manure applied to cropland and pastures, leguminous crops, and crop residues. Some nitrous oxide emissions also occur from stored manure. Annual U.S. agricultural methane emissions are approximately 44 MMT carbon-equivalent per year (2004 estimate) and stem mainly from livestock, animal waste, and rice cultivation. In aggregate, agricultural GHG emissions account for roughly 8 percent of total U.S. emissions from all sources (USEPA 2006), on a carbon-equivalent basis.
Historical changes in American agriculture have greatly influenced past trends in GHG emissions. The agricultural activities of Native Americans were small in scale and probably had a negligible effect on GHG emissions,3although their use of fire may have affected carbon stocks by promoting the expansion
of the prairie grassland (replacing forestlands) in the central United States. With the onset of European settlement, the clearing of forests, prairies, and wetlands for agriculture resulted in a large net source of CO2to the atmosphere. In fact, prior to the 1900’s, land use was the dominant global source of CO2from
human activity, and since 1850 an estimated 160 billion metric tons of carbon from biomass and soils have been emitted worldwide as a consequence of land use and land-use changes (Houghton 2003). On farmland, intensive cultivation practices, along with comparatively low productivity, harvesting and removal of residues, and soil erosion depleted the carbon stocks of many agricultural soils by 30 to 50 percent or more compared to their condition under native vegetation. A cycle of soil exhaustion and land abandonment, in part, fueled the westward expansion of agriculture in North America.
Since the 1940’s, the emergence of modern agriculture has dramatically altered the relative sources and magnitudes of agricultural GHG fluxes. Steadily increasing productivity, improved cropping practices, erosion control measures, and reduced tillage intensity (see Chapter II) have stabilized and begun to rebuild the organic carbon stocks of many agricultural soils. As a result, on a net basis, U.S. croplands currently remove more CO2from the atmosphere than they release to it; i.e., they now act as a
net sink for CO2. Reforestation of marginal agricultural lands, particularly in the eastern United States, has
also contributed to the present carbon sink (about 174 MMT of carbon per year) attributed to U.S.
forestland (USEPA 2006). On the other hand, the development and growing use of industrial fertilizers over the past 50 years has greatly increased the input of nitrogen to soils, resulting in nitrogen losses to the environment in various forms, including as nitrous oxide emissions. Growth in livestock numbers,
+
+
particularly within large, confined operations, has increased emissions of methane from livestock and manure over the same period.
Current and future trends in the structure of American agriculture will affect both future
emissions and opportunities for GHG mitigation. Crop yields have been increasing 1 to 2 percent per year over recent decades, and increases are likely to continue for the foreseeable future (Reilly and Fuglie 1998). These increases, along with continued adoption of conservation tillage and maintenance of conservation set-aside programs (see Box 2, page 11), are likely to support further increases in soil carbon stocks. Higher crop yields also increase the potential for shifting some land from food production to energy crop production. Nitrogen fertilizer use has tended to level off over the past 15 years, likely reflecting regulatory pressures in some regions as well as higher fertilizer costs and retirement of cropland under the Conservation Reserve Program (See Box 2). Consequently, nitrous oxide emissions from U.S. agriculture have flattened out since 1990 (USEPA 2006). Since 1990, a decline in cattle and sheep populations has been counterbalanced by a rise in swine and poultry populations, resulting in roughly stable agricultural methane emissions since 1990 (USEPA 2006). These trends reflect the current technical, economic, and policy environment, in the absence of explicit management decisions and policies to mitigate GHGs.
As detailed in the following chapters, the current technical potential to mitigate GHGs through improved agricultural practices over the next 10 to 30 years is substantial, estimated at approximately 102 to 270 MMT carbon-equivalent per year. This estimate derives from a combination of carbon sequestration (70 to 221 MMT carbon), nitrous oxide reductions (23 to 31 MMT carbon-equivalent), and methane reductions (9 to 18 MMT carbon-equivalent). This mitigation potential equals or exceeds present emissions from U.S. agricultural sources (about 160 MMT carbon-equivalent in 2004) and represents 5 to 14 percent of year-2004 U.S. GHG emissions from all sources and for all gases. In addition, energy produced from agricultural biomass sources, if substituted for fossil fuels, represents a mitigation potential of 510 to 1,710 MMT CO2-equivalent per year (140 to 470 MMT carbon-equivalent per year)
or 7 to 24 percent of total 2004 U.S. GHG emissions (see Chapter IV). However, the mitigation levels that can be achieved economically are likely to be substantially lower than these technical potentials.
+
+
As discussed in Chapter III, a variety of economic and social factors will influence the adoption of
alternative practices and production systems, although studies to date suggest that a significant portion of agricultural mitigation practices can be characterized as low-cost options (i.e., relative to many mitigation options in energy, industry, transportation, etc). Further, Chapter IV points out that significant research efforts to reduce biofuel conversion costs and increase energy crop yields would be needed for biofuels to reach their full mitigation potential. Finally, changes in land use and management to achieve GHG mitigation can contribute to overall environmental improvements. Hence, a broader consideration of the costs and benefits of improved agricultural practices, beyond the realm of climate change concerns, is merited. The practices that could be implemented to stimulate GHG mitigation, the resulting economic opportunities, a review of biofuel options, and the policy implications of these opportunities are discussed in the
+
+
II. Mitigation Opportunities: Increased Sinks and Reduced Emissions
Agriculture offers a diversity of means for addressing greenhouse gases.
This chapter covers opportunities to alter agricultural management practices in ways that increase storage of carbon and reduce emissions of carbon dioxide, methane, and nitrous oxide. Section A below
delineates opportunities to increase soil carbon content, thereby removing CO2from the atmosphere.
Section B reviews opportunities to mitigate methane and nitrous oxide emissions and discusses the need for a comprehensive multi-gas approach. Section C describes measurement and monitoring methods essential for guiding policy and implementation and the need for further research and development to improve their accuracy. Finally, Section D highlights added benefits for water, air, and soil quality from practices that reduce GHG emissions.
A. Opportunities to Increase Soil Carbon
Historically, agricultural practices have caused large carbon losses
from U.S. cropland soils.
If half or more of the original carbon stock of croplands could be regained, tens to hundreds of million metric tons of carbon could be stored (i.e., added to and sequestered) in soils annually over the next several decades. Carbon additions to soil are favored by management practices that increase plant residues. Reducing carbon losses, i.e., by slowing the rate of soil organic matter decay, also increases soil carbon stocks. Land-use changes such as conversion of annual cropland to grassland or forest and restoration of degraded lands can also increase soil carbon. Following adoption of practices or land uses that increase carbon stocks, soil carbon may increase for 20 to 30 years, after which soil carbon contents tend to stabilize and there is no further increase in carbon storage due to the new system (CAST 2004).1(a). Cropland Management
Numerous field experiments show that soil carbon stocks tend to attain levels that are roughly proportional to the annual rate of carbon added (e.g., see Paustian et al. 1997; Huggins et al. 1998). A
+
+
achieving high productivity. Carbon inputs to soil can also be increased by using crop rotations with high residue yields, by reducing or eliminating the fallow period between successive crops in annual crop rotations, and by making efficient use of fertilizer and manure. On annual croplands, soil carbon losses can be reduced by decreasing the frequency and intensity of soil tillage, in particular through conversion to no-till practices.
Use of high-residue crops and grasses. Annual crops that produce large amounts of residues (plant
matter left in the field after harvesting), such as corn and sorghum, typically result in higher soil carbon levels than many other crops. Hay and pasture lands also tend to have high carbon inputs because perennial grasses allocate a large portion of their total carbon assimilation to root growth. For example, long-term experiments at two sites in Ohio (Dick et al. 1998) show about ten tonnes per hectare more soil carbon after 30 years under continuous corn crops or with oat-hay rotations than for corn-soybean rotations, equal to an average gain of 0.3 tonnes per hectare per year (t/ha/yr).4Conversion from
continuous cereal cropping to cereal-hay rotations was estimated to increase soil carbon by about 1 percent per year, or about 0.5 t/ha/yr, for average European conditions (Smith et al. 1997a).
Reduction or elimination of fallow periods between crops. In semi-arid regions like the Great Plains,
summer fallow (a practice where soil is left unplanted for an entire cropping year) was developed as a way of storing soil moisture to improve yields and reduce crop failure. However, summer fallow practices caused high rates of soil carbon loss and soil degradation in large areas of the western United States (Haas et al. 1957). More recently, new cropping systems that combine winter wheat with summer season crops (e.g., corn, sorghum, millet, bean, sunflower) in rotation using no-till practices (see below) have proved successful in both improving soil moisture and increasing soil carbon (Peterson et al. 1998).
In more humid regions, where fields may be left fallow in winter, it is often feasible to grow winter cover crops, usually legumes or annual grasses, and thus maintain vegetation year-round. Cover crops serve several functions, including taking up excess soil nutrients (e.g., nitrogen) to reduce leaching or other losses to the environment, fixing atmospheric nitrogen (e.g., legumes), and controlling weeds; but they also serve to augment the input of plant residues, thereby increasing soil carbon content.
Efficient use of manures, nitrogen fertilizers, and irrigation. As a general rule, promoting the
efficient use of inputs such as fertilizer, manure, and irrigation will yield the best results for GHG mitigation (Paustian et al. 2000). Efficiency in this context is defined as maximizing crop production per
+
+
unit of input. If high rates of crop production (with attendant carbon input increases) are achieved primarily through increased nitrogen fertilization and irrigation, increases in other GHG emissions, particularly nitrous oxide (see section B below), can offset part or all of the gains in soil carbon. Tailoring fertilizer and manure applications to satisfy crop nitrogen demands, so that less nitrogen is left behind in the soil, can reduce nitrous oxide emissions while building soil carbon stocks. Efficient use of irrigation water will similarly reduce nitrogen losses,5including nitrous oxide emissions, and minimize CO
2
emissions from energy used for pumping while maintaining high yields and crop-residue production.
Use of low- or no-till practices. Reducing soil carbon losses on croplands is primarily
accomplished through reducing the frequency and intensity of soil tillage. Soil tillage tends to accelerate organic matter decomposition—including the oxidation of carbon to CO2—by warming the soil, breaking
up soil aggregates (i.e., soil’s granular structure), and placing surface residues into the moister environment within the soil (Reicosky 1997; Six et al. 2000). Traditional tillage methods such as moldboard plowing, which fully inverts the soil, cause the greatest degree of disturbance and
consequently tend to cause the most degradation of soil structure and loss of soil carbon stocks. In many areas, the trend over the past several decades has been towards reduced tillage practices that have shallower depths, less soil mixing, and retention of a larger proportion of crop residues on the surface.
No-till, a practice in which crops are sown by cutting a narrow slot in the soil for the seed and herbicides are used in place of tillage for weed control, causes the least amount of soil disturbance. Recent reviews (West and Marland 2002; Ogle et al. 2005) have summarized no-till effects on soil carbon. For example, Ogle et al. (2005) analyzed data from 126 studies worldwide and estimated that soil carbon stocks in surface soil layers (to 30 centimeter [cm] depth) increased by an average of 10 to 20 percent over a 20-year time period under no-till practices compared with intensive tillage practices. The relative increases in carbon stocks were higher under humid than dry climates and higher under tropical than temperate temperature regimes. Using U.S. data only, an overall average increase of 15 percent in carbon stocks was estimated. To put this in perspective, many U.S. cropland soils contain 40 to 80 metric tons per hectare (t/ha) of carbon in the top 30 cm, which would imply an increase of 6 to 12 t/ha over a 20-year period (equivalent to 0.3–0.6 t/ha of carbon per year). West and Marland’s (2002) estimate of average annual rates of 0.34 metric tons per hectare per year (t/ha/yr) of carbon increase under no-till conditions, based on long-term experiments in the United States, falls within this
+
+
70 percent for no-till, relative to conventional tillage (West and Marland 2002), contributing to further reductions in GHGs from reducing tillage intensity.
1(b). Grazing Land and Hayland Management
Permanent grasslands used as pastures, rangelands, and hayfields can maintain large soil carbon stocks due to several characteristics. Perennial grasses allocate a high proportion of photosynthetically fixed carbon below ground, maintain plant cover year-round, and promote formation of stable soil
aggregates. However, the potential for increasing soil carbon in such systems is highly dependent on past management and the extent to which plant productivity and carbon inputs can be enhanced through management improvements. Grassland systems that have been degraded in the past or maintained under suboptimal management conditions are most conducive to sequestering additional carbon.
Management activities can include boosting plant productivity through fertilization, irrigation, improved grazing, introduction of legumes, and/or use of improved grass species. Intensive management strategies are usually restricted to more humid regions with high productivity potential or regions where irrigation is used. In semi-arid western rangelands, manipulating grazing systems and altering species composition are the principal management tools available. See the companion paper, Richards et al. 2006, for a discussion of the feasibility of management changes on U.S. rangelands.
Conant et al. (2001) summarized more than 115 studies of grassland management effects on soil carbon and estimated rates of soil carbon increase ranging from 0.1 to 3 t/ha/yr for different management improvements. The highest rates occurred with introduction of deep-rooted African grasses in South American savannas (Fisher et al. 1994), whereas most of the higher rates for temperate grasslands in the United States showed carbon gains of around 1 t/ha/yr. Average rates of carbon increase were approximately 0.3 t/ha/yr for fertilization and improved grazing systems and approximately 0.7 t/ha/yr for introduction of legumes.
2. Land-use Changes to Increase Soil Carbon
Conversion of annual cropland to grasslands or forest and restoration of severely degraded lands offer significant opportunities to increase soil carbon. Conversion can occur through set-asides (see Box 2) or through moving land from annual crop production into use as hay or pasture lands. Land set-asides and restoration projects typically involve the establishment of perennial grasses or trees that mimic
+
+
conditions prevalent under native vegetation. In most instances, conversion of agricultural lands to forest will increase soil carbon stocks as well as aboveground woody biomass. Post and Kwon (2000) found mean rates of soil carbon change of 0.35 t/ha/yr following afforestation. Interactions between tree species and soil type seem to be important in governing how soil carbon stocks change. Converting cultivated cropland to grassland typically increases soil carbon at rates of 0.3 to 1.0 t/ha/yr for a period of a few decades (Lal et al. 1998; Conant et al. 2001). Carbon accumulation rates at the upper end of this range are representative of cropland conversion to managed pastures in more humid areas, while grassland set-asides in semi-arid climates, for example, might have carbon increases at the lower end of this range. See the companion paper, Richards et al. 2006, for a discussion of options for increasing aboveground carbon in U.S. forests.
Highly degraded sites, such as severely eroded areas, reclaimed surface mines, and saline soils represent situations with high potential carbon sequestration rates but also higher costs and technical difficulties associated with the reclamation. Where vegetation has been absent and/or topsoil removed, the initial carbon contents prior to restoration will be very low. Hence, the capacity for accruing soil carbon is large, provided that a productive plant cover with high rates of carbon inputs from residues can be established and maintained. Lal et al. (1998) cite studies reporting several-fold increases in carbon stocks over a 5 to 15 year period following restoration of severely degraded sites.
Cultivated organic soils represent another land restoration opportunity. These lands are a significant source of agricultural CO2emissions, with high rates of up to 10 to 20 t/ha/yr of carbon
(Ogle et al. 2003). Hence, wetland restoration may be a mitigation option. However, restored wetlands may emit methane, which would need to be considered in assessing the overall mitigation potential of this type of restoration.
Box 2. Carbon Sequestration in the
Conservation Reserve Program
In the United States, the Conservation Reserve Program (CRP) was initiated in 1985 and currently encompasses over 13 million hectares (ha), mainly highly erodible and/or marginally productive annual cropland that has been set aside. Several studies show that set-asides are effective at sequestering carbon (e.g., Gebhardt et al. 1994; Paustian et al. 2001; Conant et al. 2001; Follett et al. 2001). From an extensive review of the literature, Ogle et al. (2003) estimated soil carbon stocks increased under grassland set-asides by an average of 16% in the top 30 cm, over a 20-year period, equivalent to average gains of almost 7 MMT per year on the 13.4 million ha of CRP land in the United States. In general, soil carbon gains under CRP tend to be correlated to productivity and hence are higher in more humid regions, compared to semi-arid areas.
+
+
3. Total Agricultural Soil Carbon Sequestration Potential
Carbon sequestration rates vary by climate, topography, soil type, past management history, and current practices. Various global and national estimates for potential soil carbon sequestration have been made. These estimates are usually based on overall carbon gain for a suite of practices and the available area on which these practices could be applied, resulting in estimates of biological or technical potential. Paustian et al. (1998) estimated a global potential from improved agricultural soil management of 400 to 600 MMT of carbon per year, and the Intergovernmental Panel on Climate Change (IPCC 2000) estimated potential rates from improved cropland, grazing land, and agroforestry of 390 MMT of carbon per year by the year 2010 and 780 MMT of carbon per year by 2040, assuming a lag-time in the adoption of improved practices. In the United States, Lal et
al. (2003) estimated an overall potential for soil carbon sequestration (excluding forest-related activities) of 70 to 221 MMT of carbon per year for a combination of practices
including land set-asides, restoration of degraded lands, conservation tillage, irrigation and water management, and improved cropping and pasture systems. This overall figure represents net increases, taking into account increased GHG emissions associated with the management improvements. A more detailed, regionalized assessment for U.S. annual cropland alone estimated a total soil
sequestration potential of 83 MMT carbon per year (see Box 3 and Figure 2).
There are numerous uncertainties surrounding such estimates of carbon sequestration potential. On the one hand, development of new technologies specifically targeted at increasing soil carbon (through plant breeding or new soil amendments) could increase potentials. On the other hand, rising temperatures
Box 3. U.S. Cropland Carbon
Sequestration Potential
A regional assessment of U.S. soil carbon sequestration potential was carried out by Sperow et al. (2003). Several scenarios entailing widespread adoption of ‘best management practices’ for carbon sequestration were analyzed. Potential sequestration rates for U.S. cropland ranged up to 83 MMT carbon per year. The highest amounts were attributed to conversion to no-till (47 MMT carbon per year), followed by use of cover crops (22 MMT carbon per year), set-asides (11 MMT carbon per year) and elimination of summer fallow (3 MMT carbon per year). Potential soil carbon sequestration (from combined practices) was highest in the northern Corn Belt region and in the Mississippi delta, with somewhat lower amounts in the Piedmont region of the Southeast and the Northern, Central and Southern Great Plains.
+
+
due to global warming will likely stimulate soil organic matter decomposition, which may reduce or eliminate the potential to further increase soil carbon stocks. Finally, the amount of carbon sequestration which is actually achieved will depend on economic, social, and policy factors (see Chapter III and the companion Pew report, Richards et al. 2006) and is likely to be substantially less than the biological and technical potential cited above.
Figure 2
Geographic Distribution of Potential Soil Carbon Sequestration
on Agricultural Land with Widespread Adoption of Current Best Management Practices
Source: Sperow et al. 2003.
Note: MLRA = Major Land Resource Area.
0 <0.1 0.1 to 0.5 0.5 to 1.0 1.0 to 1.5 1.5 to 2.0 2.0 to 2.5 >2.5 Annual soil carbon increase in MMT by MLRA
+
+
B. Reducing Agricultural Nitrous Oxide and Methane Emissions
Nitrous oxide (N
2O) and methane (CH
4) emissions result from both crop
and livestock operations and account for approximately 80 percent of U.S.
agricultural greenhouse gas emissions on a GWP basis.
Despite challenges, there is considerable scope for reducing these emissions. Nitrous oxide constitutes the largest agricultural source of GHG emissions in terms of warming potential (48 percent), and almost 70 percent of total U.S. nitrous oxide emissions are from soils. The best option for reducing these emissions is to use fertilizers more efficiently; adoption of best fertilization practices could reduce agricultural N2O emissions by 30 to 40percent (CAST 2004). Livestock are the main source of agricultural CH4emissions (see Figure 1, page 2,
Ruminant CH4). Increasing the efficiency of production (meat, milk) per animal can decrease these
emissions and also reduce costs. Manure management accounts for 25 percent of U.S. agricultural CH4
emissions; anaerobic (i.e., oxygen-free) digesters that capture and use the methane as an energy source— thereby displacing fossil fuels—offer a nearly ideal solution for these emissions. Adoption of best
practices could reduce total U.S. agricultural methane emissions by 20 to 40 percent (CAST 2004).
1. Reducing Nitrous Oxide and Methane Emissions From Soils
A characteristic of modern agriculture is the huge increase in nitrogen supplied—not only as mineral fertilizer but also through nitrogen-fixing crops (e.g., alfalfa, clover, and soybeans) and animal manure—to boost crop productivity (Mosier et al. 2001). Because N2O emissions are strongly influenced
by the availability of nitrogen in soil, some N2O emissions are an unavoidable consequence of
maintaining highly productive crop and pastureland. However, improved control of the amount, timing, and placement of fertilizer can minimize these emissions. Methane emissions from agricultural soils are mainly associated with flooded soils such as rice-growing areas and wetlands. Most soils are not a major source of CH4and, in fact, most non-flooded soils remove some CH4from the atmosphere.
Nitrous oxide. Unlike the case for CO2and CH4, there are no significant biological sinks for
atmospheric N2O. Since agricultural N2O emissions correlate with the amount of nitrogen available in soils,
mitigation rests largely on increasing the efficiency of nitrogen use without compromising crop yields.
Using nitrogen more efficiently means better matching its availability to plant needs. However, because of variable weather conditions, it is hard to predict crop nitrogen needs at the start of the
+
+
growing season when most fertilizer is applied. Since fertilizer is relatively inexpensive in comparison with other farm costs, over-fertilization (applications in excess of plant needs) is common as farmers hedge against inadequate nutrients. Greater than 50 percent of the major cropland area in the United States is rated as having high nitrogen balances, resulting in soils highly susceptible to losses of N2O to the
atmosphere and nitrate (NO3–) to water bodies (USDA 2003).6Where animal manure is applied, farmers
may not adequately account for its nitrogen contributions and, therefore, add too much supplemental fertilizer. Also, with increasing size and concentration of confined animal feeding operations (CAFOs), manure supply and transport costs lead to application of manure at higher than recommended rates on nearby fields (Edmonds et al. 2003).
In addition to application rate, timing is a factor in the efficiency of nitrogen use. Currently about 30 percent of the U.S. area cropped to corn, cotton, and potatoes was fertilized in the autumn (USDA 2003). Fall application of fertilizer (motivated by lower fertilizer costs in the fall and to save time during spring planting) results in high concentrations of mineral nitrogen remaining in soils over a several-month period with no plant uptake, making that nitrogen vulnerable to losses. Applying fertilizer only after the start of the growing season—and ideally as split applications over time—provides better synchrony with plant demands because crop uptake capacity is low at the beginning of the growing season, increases rapidly during vegetative growth, and then drops sharply as the plant nears maturity. Slow-release fertilizers, such as sulfur-coated urea, which delay the release of fertilizer applied at planting time until plant nitrogen uptake capacity is higher, can also be used.
Where and how fertilizer is applied also influences the efficiency of nitrogen use. Surface application of fertilizer and manure is subject to greater volatilization losses, predominantly as ammonia gas, than injected fertilizer. Ammonia is eventually deposited downwind in environments where it may result in N2O emissions. In 1997, fertilizer was surface-applied on about 30 percent of corn, 60 percent
of wheat, and more than 70 percent of cotton and potato acreage (USDA 2003). Injecting fertilizer and manure into the soil, near the zone of active root uptake, both reduces nitrogen losses and increases plant nitrogen use, resulting in less residual nitrogen that can be lost as N2O.
Methane. Methane is produced in soils by bacteria, termed methanogens, which function under
+
+
largely restricted to flooded soils, such as those used for rice cultivation and other cultivated wetland crops (e.g., cranberry bogs), where water-saturated conditions inhibit the diffusion of oxygen into much of the soil. Because the area of flooded rice land and other wetland crops in the United States is small, total CH4emissions from these sources in the United States are also relatively small— about 0.4 MMT of
CH4per year (two MMT carbon-equivalent) from 1.4 million hectares (Mha) of rice lands in California, the
Gulf Coast and Mississippi delta region, and Florida (USEPA 2005).7However, on a per-hectare basis the
emissions are significant. Potential mitigation options include changes in crop breeding and management of water, fertilizer, and residues. Perhaps most promising is the selection and breeding of new rice varieties that are less conducive to transport of CH4through the plant to the atmosphere (Aulakh et al.
2002). Because 60 to 90 percent of CH4emissions from growing rice occur via transport through the
plant tissues,8choosing rice cultivars with a high resistance to CH
4transport could reduce emissions by
as much as 50 percent (Sass 1994).
Under aerobic (oxygenated) conditions, other soil bacteria consume CH4, oxidizing it to CO2.
Because CH4has a GWP 21 times greater than CO2(see Box 1, page 3), the conversion of CH4to CO2
yields an overall decrease in total GHG warming. Globally, soils eliminate about 20 to 60 MMT of CH4 per
year (115 to 345 MMT carbon-equivalent) through oxidation. The highest rates of CH4oxidation occur in
undisturbed, native ecosystems. Cultivated soils have much lower rates of CH4oxidation—for example,
CH4oxidation was reduced by 80 percent in annual cropland compared with deciduous forests in
southern Michigan (Robertson et al. 2000), and similar reductions (80 to 90 percent) were found when cropland was compared with native prairie in eastern Colorado (Bronson and Mosier 1993). In general, conversion of marginal cropland to permanent set-aside and use of no-till methods on annual cropland are the practices that will be most beneficial to strengthening the CH4sink on agricultural soils.
2. Reducing Livestock-Related Methane and Nitrous Oxide Emissions
Livestock-related emissions from digestive processes and animal wastes account for 26 percent of total agricultural emissions. Although enteric (digestive tract) emissions are more significant (70 percent of agricultural CH4emissions), emissions from livestock wastes have a greater potential for mitigation.
Improving manure-handling facilities, for example by covering animal-waste lagoons and capturing and burning the CH4, can reduce emissions while providing renewable energy and income. Capture and
+
+
nitrate pollution. Overall the best option for reducing digestive process emissions is to increase the efficiency of livestock production.
Manure storage and management. Manure management in the United States currently accounts for
25 percent of agricultural CH4and 6 percent of agricultural N2O emissions. In addition to GHG
production, problems associated with odor and nutrient pollution from animal wastes are widespread. Hence, improvements in manure handling that address both GHG reductions and odor and nutrient problems are of great interest.
Manure produced by livestock can emit N2O and/or CH4during storage and following application
to soil. The type and rate of these emissions are highly dependent on the storage conditions and
characteristics of the manure. In general, storage under anaerobic conditions (lacking oxygen, such as in waste lagoons) will produce CH4while N2O emissions will be suppressed.9Conversely, piled storage and
composting of manure will promote largely aerobic decomposition, suppressing CH4emissions but
promoting N2O emissions. Both types of handling and storage methods are widely used in the United
States. Lagoon storage is frequently used for large dairy facilities and other confined animal operations, while piled storage is typical for smaller farms and for some confined operations such as beef feedlots. Anaerobic digesters10in conjunction with lagoon storage systems offer a nearly ideal option—N
2O
emissions are suppressed and CH4can be used as an energy source, thereby displacing fossil fuels.
Opportunities for mitigating N2O emissions from stockpiled or composted manure are relatively
limited. One way to reduce N2O emissions is by increasing the ratio of bedding material (straw or
sawdust) to manure. This immobilizes more nitrogen by converting it into organic compounds. Perhaps the most effective measure for reducing manure-related N2O emissions from stockpiled or composted
manure is to apply the manure at rates based on crop needs, thus maximizing plant uptake of manure-derived nitrogen, and minimizing the amount of residual nitrogen left in the soil.
Enteric fermentation. Methane is produced in the digestive tract of animals, particularly in
ruminants such as cows, sheep, goats, and camels. This source of CH4emissions is termed enteric
fermentation. In the United States these emissions amount to about 5.4 MMT of CH4per year (30.7 MMT
carbon-equivalent), which represents about 70 percent of agricultural CH4emissions and 20 percent of
+
+
Because CH4emissions from enteric fermentation are influenced by the feed quality and
digestive efficiency of the animals, improving these will reduce CH4emissions. In simple terms, the more
rapidly food is processed and passed through the rumen (first stomach of ruminants), the less time there is for CH4production. For most confined livestock in the United States, feed quality and digestibility are
already at a relatively high level, and further improvements from conventional changes in feed rations are likely to be modest. However, where diets are not optimal, incorporating more digestible feed such as grain, silage,11 and legume hay (e.g., clover or alfalfa) in the diet can reduce emissions. One area where
substantial improvements are possible is in improving forage quality for grazing animals on smaller livestock operations through better pasture management (DeRamus et al. 2003). Various feed additives such as edible vegetable oils and certain antibiotics can also be used to inhibit the rumen bacteria that produce CH4(Teather and Forster 1998).
For a given animal type and food quality, CH4production will be roughly proportional to food
intake. Thus, increasing the amount of product (meat, milk) per unit of food consumed will effectively reduce CH4emissions per unit of product. Ways to increase the production efficiency of individual
animals include improved animal genetics (breeding) and animal health.
C. Measurement, Modeling, and Information Needs
Reliable measurements and models are necessary to design and assess
policies for mitigating GHG emissions.
As the United States intensifies its efforts to include the agricultural sector in efforts to address climate change, it will be important to improve the accuracy and robustness of estimates of the GHG implications of adopting practices described above. In particular, the capacity to estimate methane and nitrous oxide emissions and emission changes needs to be strengthened, and a national monitoring system to provide measurements of soil carbon stocks over time should be established. A combination of field measurements and models provides the best means to estimate national- and regional-scale agricultural emissions and sinks and to forecast changes inemissions due to changes in management practices, environmental and economic conditions, or government policies. To provide better data for GHG inventories and models, additional information on specific management activities should be collected together with measurements of soil attributes as part of a national soil inventory network.
+
+
1. Measurement of Greenhouse Gas Emissions and Carbon Sinks
Both emissions and sinks of GHGs can be measured directly through measurement of gas fluxes.12
To date, however, measuring GHG fluxes from soils has been largely restricted to research applications. In the case of CO2, net emissions between the atmosphere and the land surface can also be inferred from
changes over time in carbon stocks (i.e., the amount of carbon in soils and vegetation) (see below). The carbon content of a soil sample can be determined with a high degree of precision. Thus, the challenges in estimating changes in carbon stocks are not in measuring soil carbon content at a specific location per se but rather in designing accurate and cost-efficient sampling designs to provide estimates of changes for fields and across larger areas. Measurement techniques available for gas fluxes and for carbon stocks, as well as their relative strengths and limitations, are described below.
Measurement of greenhouse gas fluxes. Rates of GHG emissions from soils and/or uptake of CO2,
and CH4can be measured directly (see Box 4).
However, measuring flows of these gases over areas and time periods of interest poses significant difficulties because emission rates are highly variable in both space and time. For instance, emissions rates of N2O can
change 100-fold or more following a rainstorm or fertilization (Smith et al. 1997b), and similar changes in CO2emission rates occur
following tillage (Reicosky 1997). Hence, deriving annual flux rates (see endnote 12 for definition of “flux”) requires frequent sampling so that large, short-term fluxes are adequately represented. The high spatial variability in flux rates implies that either several small areas within a field need to be sampled and then averaged or that the measurement technique
itself needs to integrate fluxes over a fairly large area.
Box 4. Gas Flux Measurement
Two basic methods can be used to measure fluxes from soils: chambers and micrometeorological techniques. Use of chambers is restricted to low-growing vegetation or bare soils, and their small size (usually less than one square meter) means that several chambers are needed for a given area to account for the high spatial variability of gas fluxes. Chamber methods also generally require highly labor-intensive, repeated sampling to obtain annual flux estimates. A few automated chamber systems have been developed, but they require sophisticated facilities. Micrometeorological techniques use measurements of air movement to and from the land surface, together with measurements of gas concentrations within the air mass. Integrating these measurements provides an estimate of gas fluxes between the land surface and the atmosphere. Applications range in scale from small tower-based measurements that estimate fluxes from tens or hundreds of square meters to aircraft-based measurements that integrate fluxes from tens or hundreds of square kilometers of land area. However, micrometeorological approaches are also subject to limitations and the relative expense and sophistication of the instrumentation largely restrict their application to research purposes, at least at present.
+
+
Measurement of soil carbon stocks. Changes in soil carbon stocks can be used as an integrated
measure of net soil CO2flux over time because the predominant flows of carbon between soils and the
atmosphere are in the form of CO2.13Soils that are accumulating carbon represent a net flux of CO2from
the atmosphere (via the plant) to the soil, and soils that are losing carbon represent a net flux of CO2to
the atmosphere. Hence, measurements of soil carbon stocks at a set location, over a known time period (e.g., [Cyr = 2005– Cyr = 2000]/5 years = average annual carbon flux between year 2000 and year 2005)
provide an estimate of the net CO2flux at that location over that period.
Soil carbon content can be accurately measured using modern dry-combustion carbon-nitrogen analyzers, and even older methods (e.g., wet-oxidation) provide acceptable accuracy and precision.14
Consequently, designing cost-effective sampling schemes is the main challenge in estimating carbon stock changes over larger areas. As with gas
fluxes, soil carbon content typically exhibits high spatial variability, showing as much as five-fold differences, even within uniformly managed fields (Robertson et al. 1997). Furthermore, most soils contain substantial amounts of carbon. Typical agricultural soils in the midwestern United States contain 30 to 60 tonnes of carbon per hectare in the upper 20 centimeters, whereas annual changes in stocks rarely exceed one t/ha/yr. Therefore, several years (perhaps five years or more) between sampling times is usually required to reliably
detect and measure stock changes. In short, soil-monitoring networks need designs that account for both the spatial variability of soils and the response time of soil carbon stocks. (See Box 5.)
Because much of the variability in soil organic matter content occurs within short distances (i.e., variability is expressed at fine spatial scales), the sampling intensity required to detect an average change in carbon stocks at a specified confidence level15diminishes sharply as the area of land being considered
increases (Conant and Paustian 2002). While hundreds of sample locations might be required to
Box 5. Direct Measurement
of Soil Carbon
Key elements of an appropriate sampling procedure include: (1) use of precisely geo-referenced sites for repeated sampling; (2) use of sufficiently large diameter cores to enable accurate determination of bulk density and carbon concentration on the same soil sample (see endnote 14); (3) consistent accounting of carbon in surface debris; and standardization of sampling time (i.e., season), equipment, and soil preparation procedures; (4) appropriate use of nested or stratified sampling designs to account for influences of soil type, topographic position, and hydrologic conditions; (5) archiving of samples for subsequent study or reanalysis; and (6) acquisition and use of verified soil standards (i.e., a soil sample where carbon content is very precisely known and which is used to calibrate instruments).
+
+
adequately characterize soil carbon stocks for a single county, several thousand locations might suffice to characterize stocks for the entire country. Options that can significantly reduce sampling requirements include accepting lower statistical confidence levels (e.g., 90 percent vs. 95 percent) and lengthening the resampling period in order to increase the ability to detect change relative to background variability. However, such options necessarily involve tradeoffs between the accuracy and precision16of the estimates
and the cost of obtaining the information.
2. Modeling and Information Needs
The factors that control GHG fluxes and soil carbon stock changes can be articulated in mathematical models. There are two basic types of models: empirical models and “process-oriented” models. Empirical models use data from field measurements to determine statistical relationships between soil carbon stocks and environmental and management factors (e.g., IPCC 1997; Ogle et al. 2003), whereas more dynamic, “process-oriented” models attempt to simulate the biological, chemical, and physical processes controlling GHG dynamics. Process-oriented models are particularly useful
because they can represent many combinations of management practices and soil and climate conditions. A number of dynamic, process-based models have been developed to simulate soil carbon stock changes (reviewed in McGill 1996) and nitrous oxide and methane fluxes from soil (reviewed in Frolking et al. 1998). Previously process models were used primarily for research purposes, but applications to provide estimates for policy and decision makers on soil carbon and GHG mitigation are increasing rapidly (e.g., Paustian et al. 2001, 2002; Brenner et al. 2002; Del Grosso et al. 2005; USEPA 2006).
For regional applications, models require input data on environmental conditions—such as climate, soil type, and topography—and on management activities, and how all these data vary over time and location within the region. In the United States, high-quality spatial data are generally available for climate, soil type, and topography; and the variety of spatial data sets available, especially from remote sensing, is increasing. However, accurate data on land use and management activities are generally less available and are the most limiting data component for model-based estimates. While there is a great deal of aggregate data on agricultural management practices at county, state and national levels, this aggregate data has significant limitations for analyzing relationships between GHGs and management practices. For example, agricultural cropping systems are comprised of crop rotations; and practices such
+
+
as fertilizer application, tillage, and manuring vary for the different crops within the rotation. Thus, for example, county-level data on total fertilizer use fails to provide adequate detail for models attempting to forecast GHG changes due to specific changes in crop rotations.
The National Resources Inventory (NRI) is a land-use inventory that has collected general data on land use and management (e.g., land cover and crop rotations) at several hundred thousand points on non-federal land across the entire United States since 1982. Hence, the NRI is one of the primary sources of data used in models for estimating national-level agricultural GHG emissions and sinks (USEPA 2006). However, information on many management practices such as tillage, fertilization, and manuring has not been routinely collected in the NRI survey. Thus, available aggregate data on these management practices must be adjusted and interpolated for use in the models, resulting in greater uncertainty in estimates of soil carbon and GHG fluxes than if more detailed management data were available.
Collecting additional information on specific management activities—such as tillage practices and crop-specific fertilizer use on croplands and grazing practices and fertilizer use on pastures—at some or all of the NRI locations would provide a more comprehensive and consistent set of data for estimating GHG fluxes.17Furthermore, direct measurements of soil carbon at a small subset of NRI points could form the
basis for a soil-monitoring network. Currently, the United States lacks a system of permanent benchmark locations where soil carbon is measured over time in conjunction with collection of data on management practices.18Pilot soil carbon inventory systems with permanent benchmark sites have been established
in the Canadian prairies (McConkey and Lindwall 1999), and a national system has been instituted in New Zealand (Tate et al. 2003). Over time, such a system in the United States would provide valuable information to improve models and provide more accurate and reliable inventory estimates.
Existing long-term field experiments have played an essential role in developing models to
estimate carbon sequestration and GHG emissions (Paul et al. 1997; Ogle et al. 2003; Smith et al. 1996). In addition to the distributed, on-farm network of soil monitoring locations linked to the NRI (described above), more long-term field experiments are needed in which different management systems are analyzed while controlling for the key management variables affecting soil carbon and GHG emissions, such as fertilizer use. This is especially important in underrepresented areas and systems—including sites that measure nitrous oxide and methane fluxes—to improve empirical models and to test and validate process-based models.
+
+
D. Additional Benefits of Agricultural Greenhouse Gas Mitigation
Adopting management practices that reduce GHG emissions and/or
increase soil carbon will contribute additional environmental benefits.
Most of the environmental problems stemming from agricultural activities have a basic underlying cause— inefficient (wasteful) use of resources. For instance, inefficient use of nitrogen fertilizers and animal manure—either applying amounts in excess of crop needs or poor choices in timing, form, or placement— is the key source of high nitrous oxide emissions, as well as nitrate leaching into groundwater, nitrogen loss in runoff, and ammonia volatilization. More efficient nitrogen fertilizer use can reduce pollution of groundwater, lakes, and streams. Methane digesters for treatment of animal waste can provide on-farm energy as well as help reduce odors and pollution from wastes. Hence, the true value of improvements in agricultural management should be measured by considering all associated environmental benefits, including GHG mitigation.Many of the management practices suggested for carbon sequestration protect the soil surface, dramatically decrease erosion rates, and increase soil organic matter. The importance of organic matter to maintaining healthy and productive soil is well recognized by any weekend gardener. Organic matter in soil performs numerous key functions, acting as a repository for soil nutrients, promoting favorable soil structure for plant rooting and water-holding capacity, and acting as a filter for pesticides and other organic compounds. Soils that are rich in organic matter and are well aggregated, with a granular structure, also tend to be less susceptible to soil erosion from both rain and wind. Reduced sediment runoff translates into improved water quality, reduced costs for water treatment, less dredging for navigation, longer life spans for reservoirs, and healthier aquatic ecosystems. Reduced wind erosion means better air quality, less dust, and a cleaner viewscape. Thus, the buildup of soil organic matter that accompanies carbon sequestration provides many environmental, social, and economic co-benefits.
If all of the above benefits result from more conservation-oriented management practices, why aren’t these practices being used everywhere? On the surface, this seems particularly puzzling given that the vast majority of farmers and ranchers view stewardship of the land as an important value. The answer is complex and involves many technical, social, and political factors—in particular, how agricultural activities translate into economic values in the marketplace, as discussed in Chapter III.