ADSORPTION CHARACTERISTICS OF POLYMER ELECTROLYTE MEMBRANE CHEMICAL DEGRADATION PRODUCTS AND THEIR IMPACT ON OXYGEN
REDUCTION REACTION ACTIVITY FOR PLATINUM CATALYSTS
by Jason M. Christ
A thesis submitted to the Faculty and the Board of Trustees of the Colorado School of Mines in partial fulfillment of the requirements for the degree of Doctor of Philosophy (Applied Chemistry). Golden, Colorado Date ____________________________ Signed: ___________________________ Jason M. Christ Signed: ___________________________ Dr. Ryan M. Richards Thesis Advisor Golden, Colorado Date _________________________ Signed: __________________________ Dr. David T. Wu Professor and Head Department of Chemistry and Geochemistry
ABSTRACT
Developments in membrane-electrode assembly and stack technology have significantly improved the performance of polymer electrolyte membrane fuel cells; such that systematic studies focused on improving major challenges of overall cost and durability have become increasingly important. Consequently, interest in the examination of system derived impurities and their subsequent effects on performance durability has grown.
Studies involving commercial polymer electrolyte membranes and model compounds have shown that when perfluorinated sulfonic acid (PFSA) membranes are exposed to hydroxyl radicals during fuel cell operating conditions, several chemical decomposition products can be generated. Along with losses in membrane conductivity and structural integrity, such PFSA membrane degradation products may also adsorb on the platinum based electrocatalyst, possibly leading to a loss in catalyst electrochemical surface area (ECA), oxygen reduction reaction (ORR) activity, or both.
This work investigates adsorption characteristics and effects from model compounds in the forms of fluorinated organic acids, representing PFSA membrane chemical degradation species, on ECA and ORR activity for platinum based electrocatalysts including polycrystalline Pt, high surface area carbon supported Pt, and extended surface Pt. A reproducible method was developed in order to investigate surface coverage and adsorption properties due to carboxylate and sulfonate functional groups, fluorocarbon chain length, and model compound concentration. Data was obtained using a variety of electroanalytical techniques including mainly cyclic and linear sweep voltammetry, and electrochemical quartz crystal microbalance analysis. Information gleaned from this work shows that reversible adsorption occurs initially through carboxylate
anions, while intermolecular forces involving fluorocarbon chain length and ether and sulfonate moieties play a secondary role in molecular ordering at the electrode surface. Reversible losses in Pt electrocatalyst activity in regards to the ORR were realized most heavily for diacid compounds (greater than 44% loss in kinetic current) containing both carboxylate and sulfonate functional groups, followed by longer chain fluorinated carboxylic acids (17% loss in kinetic current). Fluorinated sulfonic acids and shorter chain carboxylic acids showed little to no effects on ORR activity at the concentrations (0.001 mM – 1 mM) studied.
TABLE OF CONTENTS
ABSTRACT ... iii
TABLE OF CONTENTS ...v
LIST OF FIGURES ... viii
LIST OF TABLES ... xiii
ACKNOWLEDGEMENT ... xiv
DEDICATION ... xvi
CHAPTER 1 INTRODUCTION TO SYSTEM CONTAMINATON FOR POLYMER ELECTROLYTE MEMBRANE FUEL CELLS ...1
1.1 Introduction to PEMFCs ...1
1.2 Oxygen Reduction Reaction (ORR) ...5
1.3 System Contamination of PEMFCs ...11
1.3.1 Air Source PEMFC Contaminants ...12
1.3.2 Fuel Source PEMFC Contaminants ...13
1.3.3 Balance of Plant Source PEMFC Contaminants ...14
1.4 Polymer Electrolyte Membrane Chemical Degradation ...16
1.5 Thesis Organization ...21
1.6 References ...23
CHAPTER 2 METHOD DEVELOPMENT FOR STUDYING THE ELECTROCHEMICAL IMPACT OF CONTAMINATING CHEMICAL COMPOUNDS ON ELECTROCATALYST PERFORMANCE USING A ROTATING DISK ELECTRODE ...28
2.1 Experimental Apparatus and Setup ...29
2.2 Determination of Stable Adsorption Time for Model Compounds ...30
2.3 Measuring Impact on Polycrystalline Pt ECA and Oxide Formation Using CV ...34
2.4 Conclusions ...37
2.5 References ...37
CHAPTER 3 IMPACT OF POLYMER ELECTROLYTE MEMBRANE DEGRADATION PRODUCTS ON OXYGEN REDUCTION REACTION ACTIVITY FOR PLATINUM ELECTROCATALYSTS ...39
3.1 Abstract ...39
3.2 Background and Introduction ...40
3.3 Experimental ...43
3.3.1 Electrochemical Baseline Procedure ...43
3.3.2 Model Compound Contamination Procedure ...44
3.3.3 ORR Performance Recovery Procedure ...45
3.4 Results and Discussion ...45
3.4.1 Adsorption Impact of Perfluorosulfonic Acids (SA1 and SA2) on Electrode Performance ...45
3.4.2 Adsorption Impact of Perfluorocarboxylic Acids (TFA, HFA, and UFA) on Electrode Performance ...47
3.4.3 Adsorption Impact of Li ion on Pt Electrode Performance ...51
3.4.4 Adsorption Impact of Perfluorinated Diacids (DA-Naf and DA-3M) ...52
3.5 Conclusions ...59
CHAPTER 4 CONCENTRATION EFFECTS OF POLYMER ELECTROLYTE MEMBRANE CHEMICAL DEGRADATION PRODUCTS ON ELECTROCHEMICAL SURFACE AREA AND OXYGEN REDUCTION REACTION ACTIVITY FOR VARIOUS PLATINUM CATALYSTS ...66
4.1 Abstract ...66
4.2 Introduction ...66
4.3 Experimental ...68
4.4 Results and Discussion ...70 vi
4.4.1 DA-Naf / DA-3M Adsorption Characteristics ...71
4.4.2 DA-Naf / DA-3M Impact on ORR ...79
4.5 Conclusions ...82
4.6 Acknowledgements ...83
4.7 References ...83
CHAPTER 5 SURFACE COVERAGE OF POLYMER ELECTROLYTE MEMBRANE CHEMICAL DEGRADATION PRODUCTS FOR A POLYCRYSTALLINE PLATINUM ELECTRODE: AN ELECTROCHEMICAL QUARTZ CRYSTAL MICROBALANCE STUDY ...86
5.1 Abstract ...86
5.2 Introduction ...87
5.3 Experimental ...89
5.4 Results and Discussion ...91
5.5 Conclusions ...106
5.6 Acknowledgements ...107
5.7 References ...107
CHAPTER 6 CONCLUSIONS AND PERSPECTIVES ...111
6.1 Conclusions and Perspectives ...111
6.2 Future Research ...112
6.2.1 Electrochemical SEIRAS-ATR ...113
6.2.2 In-Situ Studies ...113
APPENDIX A CONTROL STUDIES REPRESENTING MODEL COMPOUND EXPERIMENTS WITH INCREASING CONCENTRATIONS ...115
APPENDIX B PERMISSIONS FOR USE OF CHAPTERS 3, 4, AND 5...120
LIST OF FIGURES
Figure 1.1 A PEMFC where the hydrogen oxidation reaction (a) occurs at a., and the
oxygen reduction reaction (b) occurs at b ...3 Figure 1.2 A side view of a PEMFC, illustrating the relative location of its material
components. ...4 Figure 1.3 General relationship between voltage and power for a common hydrogen PEMFC. ....8 Figure 1.4 Summary of losses for different PEMFC components due to increases
in overpotential. ...9 Figure 1.5 Summary (2012) of cost distribution among PEMFC system components28...14 Figure 1.6 Main-chain degradation mechanism; unzipping of the main chain by radical
attacks to COOH groups44 ...18 Figure 1.7 Side-chain degradation mechanism; unzipping the side chain via radical
attack to the C-S bond44 ...19 Figure 1.8 Side-chain degradation mechanism; radical attack to the CF backbone carbon.
The same mechanism can be assumed for the attack to the tertiary carbon in the side chain.44 ...20 Figure 1.9 Chemical structures of studied diacid model compounds representing Nafion
(DA-Naf) and 3M (DA-3M) PEM chemical degradation products ...21 Figure 2.1 Baseline CV trace for polycrystalline Pt RDE in 0.1 M HClO4, scan rate 50 mV/s. ...29
Figure 2.2 Electrochemical cell and potentiostat used. ...30 Figure 2.3 Time (10 seconds) required for HCl to interact and equilibrate on polycrystalline Pt electrode in 0.1 M HClO4, scan rate 100 mV/s, rotation at 2500 rpm. Initial impact
observed at ca. 5 seconds; steady state CV observed after ca. 10 seconds. Black dash:
baseline; blue dash: initial scan after injection; red solid: steady state CV. ...31 Figure 2.4 Time required for caprolactum to interact and equilibrate on polycrystalline
Pt electrode surface in 0.1 M HClO4, scan rate 100 mV/s, rotation at 2500 rpm. Initial
impact observed after ca. 10 seconds; steady state CV observed at ca. 2.5 minutes ...32 Figure 2.5 Time required for hexanediol to interact and equilibrate on polycrystalline
Pt electrode surface in 0.1 M HClO4, scan rate 100 mV/s, rotation at 2500 rpm. Initial
impact observed after ca. 5 seconds; steady state CV observed at ca. 2.5 minutes. ...33 Figure 2.6 Time required for electrode impact and CV stabilization for hexanediol
and caprolactam ...34 viii
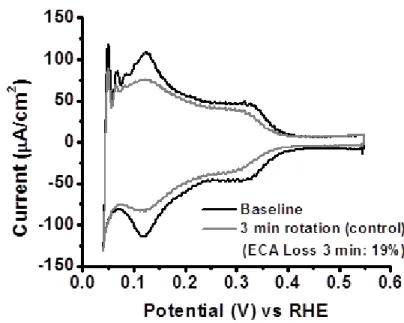
Figure 2.7 Effect on ECA for polycrystalline Pt RDE after rotating at 2500 rpm in 0.1 M HClO4 electrolyte, scan rate 50mV/s. Black: baseline; red: 1 min rotation; blue: 2 min
rotation; gray: 3 min rotation; purple: 4 min rotation; green: 5 min rotation ...35 Figure 2.8 Control adsorption scan for polycrystalline Pt after rotating at 2500 rpm for
3 min in 0.1 M HClO4 electrolyte, scan rate 50mV/s ...35
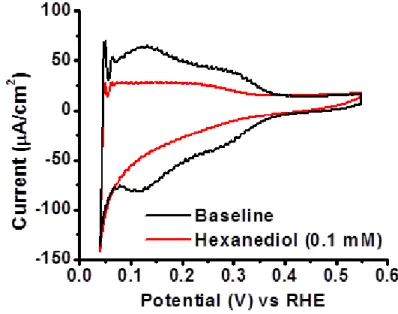
Figure 2.9 Partial CV scans for hexanediol (0.1 mM) in 0.1 M HClO4; scan rate
50 mV/s. Electrode was rotated at 2500 rpm for 2.5 minutes after compound injection ...36 Figure 2.10 Partial CV scans for HCl (0.1 mM) in 0.1 M HClO4; scan rate 50 mV/s.
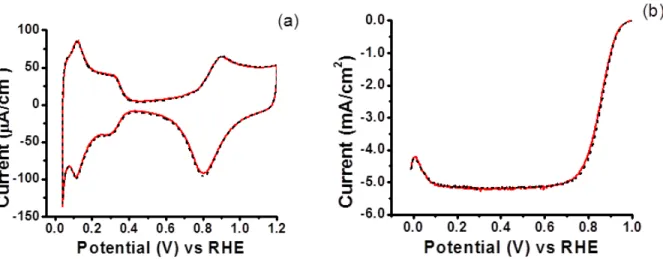
Electrode was rotated at 2500 rpm for 2.5 minutes after compound injection ...37 Figure 3.1 Structures and acronyms of model compounds studied ...42 Figure 3.2 Impact of SA1 (0.1 mM) on CV (a) and ORR (b) for polycrystalline Pt in
0.1 M HClO4. Baseline: black dash; SA1: red solid ...46
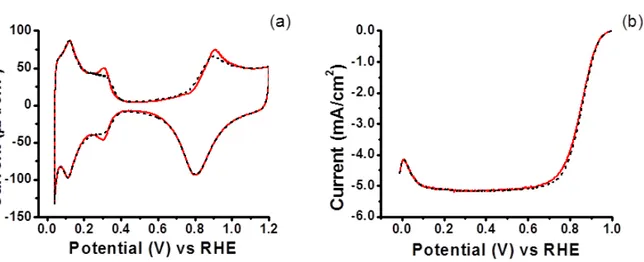
Figure 3.3 Impact of SA2 (0.1 mM) on CV (a) and ORR (b) for polycrystalline Pt in
0.1 M HClO4. Baseline: black dash; SA2: red solid ...47
Figure 3.4 Impact of TFA (0.1 mM) on CV (a) and ORR (b) for polycrystalline Pt in
0.1 M HClO4. Baseline: black dash; TFA: red solid...48
Figure 3.5. Impact of HFA (0.1 mM) on CV (a) and ORR (b) for polycrystalline Pt in
0.1 M HClO4. Baseline: black dash; HFA: red solid ...49
Figure 3.6 Impact of UFA (0.1 mM) on CV (a) and ORR (b) for polycrystalline Pt in
0.1 M HClO4. Baseline: black dash; UFA: red solid; ORR recovery: gray dash ...50
Figure 3.7 Impact of LiOH on CV (a) and ORR (b) for polycrystalline Pt in 0.1 M HClO4. Baseline: black dash; 0.1 mM LiOH: red dot; 1 mM LiOH: gray dash; 2 mM
LiOH: blue solid. ...52 Figure 3.8 Impact of DA-Naf (0.1 mM) on CV (a) and ORR (b) for polycrystalline Pt in
0.1 M HClO4. Baseline: black dash; DA-Naf: red solid; ORR recovery: gray dash ...53
Figure 3.9 Impact of DA-3M (0.1 mM) on CV (a) and ORR (b) for polycrystalline Pt in
0.1 M HClO4. Baseline: black dash; DA-3M: red solid; ORR recovery: gray dash ... 53
Figure 3.10 Summary of the effect on polycrystalline Pt ORR activity due to model
compound adsorption. Control performance loss is represented by dashed line ...55 Figure 3.11 Summary of the effect on polycrystalline Pt ORR activity due to model
compound adsorption comparing kinetic current loss at 0.8 V (red) and 0.9 V (black) ...56 ix
Figure 3.12 Summary of the effect on Pt/Vu ORR activity due to model compound
adsorption. Control performance loss is represented by dashed line ...57 Figure 3.13 Summary of the effect on Pt/Vu ORR activity due to model compound
adsorption comparing kinetic current loss at 0.8 V (red) and 0.9 V (black) ...58 Figure 3.14 Ring currents measured by RRDE during exposure of DA-Naf and DA-3M
(both 0.1 mM) for Pt/Vu ORR ...58 Figure 4.1 Chemical structures of studied diacid model compounds representing Nafion
(DA-Naf) and 3M (DA-3M) PEM chemical degradation products ...67 Figure 4.2 Voltammograms (a-c) and ORR polarization curves (d-f) of polycrystalline Pt
(top row), Pt/Vu (middle row), and NSTF (bottom row) electrodes in the presence of
DA-Naf at increasing concentrations. Baseline curves (black dash), 0.01 mM (gray),
0.1 mM (red), 1 mM (blue) ...72 Figure 4.3 Voltammograms (a-c) and ORR polarization curves (d-f) of polycrystalline Pt
(top row), Pt/Vu TKK (middle row), and NSTF (bottom row) electrodes in the presence of DA-3M at increasing concentrations. Baseline curves (black dash), 0.01 mM (gray),
0.1 mM (red), 1 mM (blue) ...73 Figure 4.4 Low potential CV scans (after 2.5 minutes continuous cycling upon model
compound injection) of polycrystalline Pt (top row), Pt/Vu (middle row), and NSTF (bottom row) electrodes in the presence of increasing concentrations of DA-Naf (a-c)
and DA-3M (d-f). Baseline curves (black dash), 0.1 mM (red), 1 mM (blue) ...76 Figure 4.5 ECA loss vs. log of concentration of DA-Naf, obtained at low potential CV
scans, for polycrystalline Pt (a), Pt/Vu (b), and NSTF (c) electrodes ...77 Figure 4.6 Surface tension measurements (IFT vs log concentration) for DA-Naf ...78 Figure 4.7 Summary of ORR activity loss vs. concentration of DA-Naf (left) and DA-3M
(right) for polycrystalline Pt (black), Pt/Vu (gray), and NSTF (striped) electrodes ...80 Figure 4.8 ORR activity loss vs log of concentration of DA-Naf (a-c) and DA-3M (d-f)
for polycrystalline Pt (top row), Pt/Vu (middle row), and NSTF (bottom row) electrodes ...81 Figure 5.1 Structures and acronyms of model compounds studied ...88 Figure 5.2 Voltammetric and EQCM response for polycrystalline Pt. Black: baseline;
red: SA1 (0.1 mM) CV; blue: SA1 (0.1 mM) EQCM ...92 Figure 5.3 Voltammetric and EQCM response for polycrystalline Pt. Black: baseline;
red: TFA (0.1 mM) CV; blue: SA1 (0.1 mM) EQCM ...93 x
Figure 5.4 Voltammetric and EQCM response for polycrystalline Pt. Black: baseline;
red: UFA (0.1 mM) CV; blue: SA1 (0.1 mM) EQCM ...95 Figure 5.5 Voltammetric and EQCM response for polycrystalline Pt. Black: baseline;
red: DA-Naf (0.1 mM) CV; blue: SA1 (0.1 mM) EQCM ...96 Figure 5.6 Voltammetric and EQCM response for polycrystalline Pt. Black: baseline;
red: DA-3M (0.1 mM) CV; blue: SA1 (0.1 mM) EQCM ...96 Figure 5.7 Voltammetric and EQCM response for polycrystalline Pt. Black: baseline,
red: DA-Naf (0.1 mM), gray: DA-Naf (0.5 mM), blue: DA-Naf (1 mM) ...100 Figure 5.8 Voltammetric and EQCM response for polycrystalline Pt. Black: baseline,
red: DA-3M (0.1 mM), gray: DA-3M (0.5 mM), blue: DA-3M (1 mM) ...100 Figure 5.9 Plot of surface coverage at 0.9 V vs concentration for DA-Naf.
Inset represents concentration on log scale ...102 Figure 5.10 Plot of surface coverage at 0.9 V vs concentration for DA-3M.
Inset represents concentration on log scale ...103 Figure 5.11 Plot of surface coverage at 0.5 V vs concentration for DA-Naf.
Inset represents concentration on log scale ...104 Figure 5.12 Plot of surface coverage at 0.5 V vs concentration for DA-3M.
Inset represents concentration on log scale ...105 Figure 5.13 Summary of surface coverage at 0.5 V and 0.9 V vs concentration for
model compounds DA-Naf and DA-3M. Black: DA-Naf at 0.5 V; red: DA-Naf at 0.9 V;
gray: DA-3M at 0.5 V; blue: DA-3M at 0.9 V ...106 Figure A-1a Control CV studies representing model compound concentration increases
for polycrystalline Pt. Black dash: baseline; pink dot: 1st cycle; gray: 2nd cycle;
red: 3rd cycle; blue: 4th cycle ...116 Figure A-1b Control ORR LSV studies representing model compound concentration
increases for polycrystalline Pt. Black dash: baseline; pink dot: 1st cycle; gray: 2nd cycle;
red: 3rd cycle; blue: 4th cycle ...116 Figure A-2a Control CV studies representing model compound concentration increases
for Pt/Vu. Black dash: baseline; pink dot: 1st cycle; gray: 2nd cycle; red: 3rd cycle; blue:
4th cycle ...117
Figure A-2b Control ORR LSV studies representing model compound concentration increases for Pt/Vu. Black dash: baseline; pink dot: 1st cycle; gray: 2nd cycle;
red: 3rd cycle; blue: 4th cycle ...117 Figure A-3a Control CV studies representing model compound concentration increases
for NSTF. Black dash: baseline; pink dot: 1st cycle; gray: 2nd cycle; red: 3rd cycle;
blue: 4th cycle ...118 Figure A-3b Control ORR LSV studies representing model compound concentration
increases for NSTF. Black dash: baseline; pink dot: 1st cycle; gray: 2nd cycle; red:
3rd cycle; blue: 4th cycle ...118 Figure A-4 Summary of control ORR activity losses for polycrystalline Pt (black),
Pt/Vu (red) and NSTF (blue) electrodes ...119
LIST OF TABLES
Table 1.1 ORR exchange current densities for various electrocatalyst materials and conditions ...7
Table 1.2 Summary of potential airborne contaminants present in PEMFCs...12
Table 1.3 Summary of potential hydrogen fuel stream contaminants present in PEMFCs ...13
Table 1.4 Summary of various BOP materials found in PEMFC subsystems ...15
Table 1.5 Summary of potential BOP contaminants found in PEMFCs ...15
Table 1.6 Summary of reactive oxygen species that can lead to chemical attack of PFSA membranes during PEMFC operation.42 ...17
Table 5.1 Summary of surface coverages and ORR kinetic current losses22 measured for PEM degradation model compounds at 0.1 Mm ...98
Table 5.2 Summary of calculated surface coverages at 0.9 V for DA-Naf and DA-3M at different concentrations ...101
Table 5.3 Summary of calculated surface coverages at 0.5 V for DA-Naf and DA-3M at different concentrations ...104
ACKNOWLEDGEMENTS
There are a number of people who I would like to thank for their help and guidance over the past five years. Without their support and generosity, the completion of this thesis would not have been possible, and I would not be the scientist I am today.
First I would like to thank my advisor, Prof. Ryan M. Richards. Without his guidance, respect, and addictive sense of optimism there is no way I could have made it this far.
Much appreciation also goes out to my thesis committee: Prof. Cristian Ciobanu, Prof. Kim Williams, Prof. Yuan Yang, Prof. Yongan Yang, and Dr. Huyen Dinh. Thank you for your time and assistance. I would also like to thank Dr. Daniel Knauss and Dr. David Wu for their support as department heads during my tenure.
Thank you to the members of Dr. Richard’s research group, who have helped me with presentations, ideas, and allowed my graduate school experience to be enjoyable. Special thanks goes to present members: Dr. Jeremy Leong, Dr. Chris Caskey, Kazuma Shinozaki, Martin Menart, Sarah Schulda, Yazhou Ji, and Mengze Xu; and also to past members: Dr. Chris Cadigan, Dr. Feng Lin, Dr. April Corpuz, and Dr. Xue Wang.
There are numerous people I must acknowledge at the National Renewable Energy Laboratory (NREL), where the majority of my research was conducted. First is Dr. Huyen Dinh, my NREL advisor, for continually supporting and believing in me over the last four years. Second is Dr. K.C. Neyerlin, for his knowledge of electrochemistry of which I will never be able to match, and for his time and effort in helping me develop my experimental methodology, writing skills, and overall approach to scientific research. Thanks to Dr. Bryan Pivovar, for managing the Chemical Materials and Science Center and maintaining a comfortable and creative atmosphere. Many thanks go out to Dr. Shyam Kocha and Clay Macomber, for their
guidance and perspectives on matters involving research and beyond. Thank you to Jason Zack, Kazuma Shinozaki, and Dr. Shaun Alia for helping me with electrochemistry and for making the ECCL an enjoyable lab to work in. Thank you to Dr. Heli Wang and Dr. Guido Bender for helping me with various aspects of my research and professional insight. Also thank you to Drs. Gina Chupka, Erica Gjersing, Earl Christensen, Anna Duda, Tim Olson, Svitlana Pylypenko, and Katie Hurst for assistance along the way.
Thank you to Dr. Steve Hamrock and Dr. Andy Steinbach from 3M, and also to Dr. Balsu Lackshmanan and Dr. Taichiang Yu from GM, for all of your insights, suggestions, and discussions.
Finally I would like to thank my family: my beautiful wife Sarah and step-daughter Alyssa, my parents, and my brother and sisters. Without their love and support nothing would be possible.
DEDICATION
To my family and those who have supported me
CHAPTER 1
INTRODUCTION TO SYSTEM CONTAMINATON FOR POLYMER ELECTROLYTE MEMBRANE FUEL CELLS
Over the past couple decades the search for alternative clean energy sources has intensified, with much of the focus falling on fuel cells. A fuel cell, specifically one of the polymer electrolyte membrane genre, is an electrochemical device which takes gaseous hydrogen and oxygen and allows them to react electrochemically, producing usable energy in the form of electric current. The commercial implementation of fuel cells however, considered to be only a few years away from a reality, still has to overcome key issues such as overall cost and system component degradation and durability before feasible levels of mass production and profitability can be realized.
While there are many underlying causes for performance durability / degradation when regarding fuel cells, this thesis specifically focuses on problems associated with the contamination / poisoning of the platinum catalysts that drive the electrochemical reactions at the heart of the fuel cell energy process.
1.1 Introduction to PEMFCs
The main difference between fuel cells and internal combustion engines (ICE) is that power in a fuel cell is derived electrochemically, whereas ICE automobiles use combustion to provide energy. When compared to ICE systems, fuel cells lend themselves to several advantages in regards to environmental impact and energy efficiency. Since the only exhaust component produced in a hydrogen fuel cell system is water, greenhouse gas emissions e.g. CO2,
NOx, and SOx, are essentially reduced to zero. Also, since chemical energy is directly converted
to electrical energy, fuel cells are not limited by the Carnot efficiency typically associated with combustion and/or heat producing processes. The relationship between the theoretical maximum possible energy from combustion and electrochemical reactions with identical reactants is shown in Eq. 1.1: o eq o nFE K RT G =− =− ∆ ln [1.1]
where ∆Go is the standard Gibbs free energy available from combustion, R is the universal gas constant, T is temperature, Keq is an equilibrium constant, n is the number of electrons involved
in the reaction, F is Faraday’s constant, and Eo is the reversible equilibrium potential available from an electrochemical reaction. Eq. 1.1 can be rearranged to take on a more familiar look in the form of the Nernst equation, presented in Eq. 1.2:
Q nF RT E
E = o + ln [1.2]
where E is the theoretical cell potential under non-equilibrium conditions. Note the equilibrium constant Keq has been replaced by Q, the ratio of reactant activities, since this ratio is an
equilibrium constant only at equilibrium.
In a PEMFC, depicted in Figure 1.1, the hydrogen oxidation reaction (HOR) (reaction a. in Figure 1.1) occurs at the anode, and the oxygen reduction reaction (ORR) (reaction b. in Figure 1.1) occurs at the cathode. These two half-cell reactions combine to make an electrochemical cell, whose potential can be described by Eq. 1.3:
+ = * 2 * 2 2 2 2 ln O O H H o p p p p nF RT E E [1.3] 2
where 2 H p and 2 O
p are the actual partial pressures of hydrogen and oxygen in an operating cell,
* 2 H p and * 2 O
p are reference partial pressures of 101.3 kPa and n is electrons transferred.
Figure 1.1 A PEMFC where the hydrogen oxidation reaction (a) occurs at a., and the oxygen reduction reaction (b) occurs at b.
The electrons formed at the anode (area b. on the left-hand-side of the membrane in Figure 1.2) are then utilized in an outside circuit, while the protons are conducted to the cathode (area b. on the right-hand-side of the membrane in Figure 1.2) through an electrolyte membrane (area a. in Figure 1.2). Prior to arriving at the catalyst layers (CLs), hydrogen and oxygen must first flow into the channels of their respective flow fields (area f. in Figure 1.2), which serve to distribute the gaseous reactants across the catalyst layers. The flow field (FF) (area e. in
H2 in Unused H2 + water out a.
H
→
Pt2
H
++
2
e
− 2 a. H+ Motor etc. e- e- O 2/ Air in b. b.O
H
e
PtH
O
2 22
2
2
1
→
+
+
+ − Unused O2 + water out 3Figure1.2) has two functional parts, the channels mentioned prior and the lands (area g. in Figure 1.2).
Figure 1.2 A side view of a PEMFC, illustrating the relative location of its material components.
While the channels serve to supply reactant gas and remove product water, the land portion of the flow field permits electron flow to another cell placed in series, or to an outside power sink. The diffusion media (DM) (area c. in Figure 1.2), also serves as a pathway for electron flow, but does so from the CL to the FF. In addition, much like FF channels, the porous, carbon based DM aids in the distribution of reactants while allowing product water to pass into the flow field channels. As is evident from their described functions, both the FF and DM are major areas of interest in the realm of PEMFC water management and gas phase mass transport resistance.
Side View (Slice) a. Membrane (18~50um)
b. Catalyst Layers (2~50um)
c. Diffusion Media (180~300um) d. Gasket e. Flow Field f. Flow Channels g. Lands d. d. d. 4
The Nernst equation for a PEMFC (Eq. 1.3) represents the theoretical maximum voltage possible when no current is being drawn from the system, and is a function of reactant partial pressures as well as temperature. However, the reversible equilibrium potential (Eo, first term on the RHS of Eq. 1.3) is a function of temperature only, as displayed in Eq. 1.4:1
) 298 ( 10 9 . 0 23 . 1 − × 3 − = − T Eo [1.4]
where 1.23 V is the reversible equilibrium potential at 25oC (298 K), 0.9×10⁻³ is an empirically derived constant, and T is in K. Note that the thermodynamic contribution to the reversible equilibrium potential with respect to temperature is negative. Combining Eq. 1.3 and Eq. 1.4 the overall Nernst relationship for a PEMFC can be described by Eq. 1.5.
⋅ + − × − = − * 2 * 3 2 2 2 2 log 4 303 . 2 ) 298 ( 10 9 . 0 23 . 1 O O H H p p p p F RT T E [1.5]
As in any electrochemical system the theoretical maximum voltage (E) is not nearly the same as the observed cell voltage (Ecell). For a PEMFC this difference is due to slow oxygen
reduction reaction kinetics as well as resistive and mass transport losses.
1.2 Oxygen Reduction Reaction (ORR)
As mentioned above, the two main electrochemical reactions responsible for producing power in hydrogen PEMFCs are the HOR and the ORR, which occur at the anode and cathode respectively. Due to inherent differences between the two reactions in regards to the electron transfer mechanism, the kinetics responsible for the ORR are much more slow and sluggish when compared to the HOR. For this reason, power generation in a fuel cell is typically limited by the rate of the ORR generated at the cathode, and is why the majority of catalysis and performance durability research is directed towards the ORR process.
In a fuel cell, the ORR must occur at what is known as a “triple-phase boundary;” a region where electronically connected free catalyst sites (typically Pt), PEM ionomer electrolyte (for proton supply) and oxygen gas are present at the same time and space. Coupled with the 4-electron transfer mechanism which occurs in the overall reaction expressed in Eq. 1.6:
𝑂2+ 4𝐻++ 4𝑒− → 2𝐻2𝑂 [1.6]
(compared to a 2-electron process for the HOR), the difference in reaction rates occurring at the anode and cathode starts to become apparent. Both reactions can be expressed by the Butler-Volmer equation describing electrode kinetics, shown in Eq. 1.7:
𝑖 = 𝑖𝑜�𝑒𝑥𝑝 �𝛼𝑅𝑇𝑎𝐹𝜂� − 𝑒𝑥𝑝 �−𝛼𝑅𝑇𝑐𝐹𝜂�� [1.7]
where i is electrode current density, io is exchange current density, αa is anodic charge transfer
coefficient, αc is cathodic charge transfer coefficient, n is number of electrons transferred, F is
Faraday’s constant, η is activation overpotential, R is universal gas constant, and T is absolute temperature.
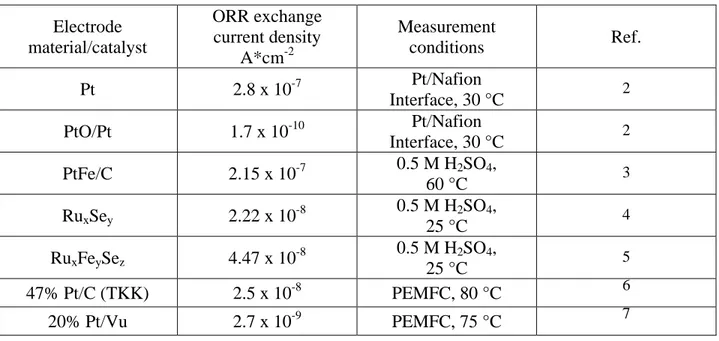
The exchange current density, along with overpotential, are two key kinetic parameters found in Eq. 1.7 that help explain the limiting nature of the ORR. During electrochemical equilibrium, the forward and reverse reactions equal each other, creating a net electrode current of zero. This electrochemical reaction rate found at equilibrium is known as the exchange current density, and indicates how rapidly the electrochemical reactions are intrinsically occurring at the electrode surface, i.e. how well the electrocatalyst facilitates the reaction. The exchange current density depends on the type of electrochemical reaction as well as the nature of the electrode surface on which the reaction occurs. Thus, catalyst and electrode materials have a strong influence on the exchange current density. The data in Table 1.1 shows exchange current densities in relation to the ORR ranging several orders of magnitude for various electrocatalyst
materials and conditions. Comparatively, exchange current densities in relation to the HOR are on the order of several hundreds of mA/cm2Pt; or approximately eight orders of magnitude higher
than those for ORR.
Electrode material/catalyst ORR exchange current density A*cm-2 Measurement conditions Ref. Pt 2.8 x 10⁻⁷ Pt/Nafion Interface, 30 °C 2 PtO/Pt 1.7 x 10⁻¹⁰ Pt/Nafion Interface, 30 °C 2 PtFe/C 2.15 x 10⁻⁷ 0.5 M H2SO4, 60 °C 3 RuxSey 2.22 x 10⁻⁸ 0.5 M H2SO4, 25 °C 4 RuxFeySez 4.47 x 10⁻⁸ 0.5 M H2SO4, 25 °C 5 47% Pt/C (TKK) 2.5 x 10⁻⁸ PEMFC, 80 °C 6 20% Pt/Vu 2.7 x 10⁻⁹ PEMFC, 75 °C 7
Table 1.1 ORR exchange current densities for various electrocatalyst materials and conditions.8
The overpotential in Eq. 1.7 represents the bias one must apply to the electrode in order to drive the net electrochemical reaction forward and allow measureable current to flow, and is further detailed in Eq. 1.8:6
𝜂𝑂𝑅𝑅 = 2.303𝑅𝑇𝛼𝑐𝐹 log �10𝐿𝑐𝑎𝐴𝑃𝑡,𝑒𝑙𝑖+𝑖∙𝑖𝑥
𝑜,𝑠(𝑇,𝑝𝑂2)� [1.8]
where αc is the cathodic transfer coefficient, Lca (mgPt/cm2) is the cathode Pt loading,
APt,el(m2Pt/gPt) is the electrochemically available Pt surface area in the MEA, and 𝑖𝑜,𝑠(𝑇,𝑝𝑂2)
(A/cm2Pt) is the catalyst-specific exchange current density for the ORR. Although Eq. 1.7 shows
that current increases exponentially with increasing overpotential, the overall power of the fuel cell does not necessarily improve according to Eq. 1.9.
𝑊 = (𝐸 − 𝜂) ∗ 𝑖 [1.9]
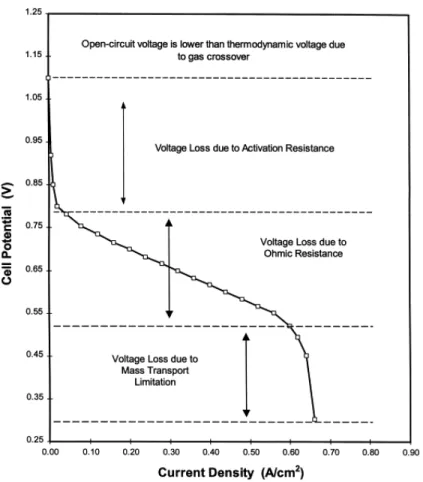
where W is power, E is the Nernst (thermodynamic) potential, η is overpotential, and i is current density. Eq. 1.9 shows that as overpotential increases, the overall cell potential decreases, lowering the total power output of the cell. A representation of the relationship between power and voltage is shown in Figure 1.3.
Figure 1.3 General relationship between voltage and power for a common hydrogen PEMFC.8
Although Figure 1.3 illustrates processes found in an actual PEMFC, which includes voltage losses other than those purely kinetic e.g. ohmic and mass transport losses, the influence of overpotential on current and power density can still be seen. Figure 1.4 shows a summary of the different component voltage losses due to: kinetic losses at the cathode, ohmic losses in the membrane, and oxygen mass transport losses.
Figure 1.4 Summary of losses for different PEMFC components due to increases in overpotential.8
In order to understand the kinetic properties of a given catalyst in regards to the ORR, certain metrics have been established in the electrochemical community. The three most important measurable quantities used to describe an ORR catalyst are electrochemical surface area (ECA), specific activity, and mass activity. In contrast to the geometric surface area of a catalyst coated electrode, the ECA represents all sites available for catalysis to occur. For very high surface area catalysts, the ECA value can be several orders of magnitude higher than the geometric area of the electrode surface.
Specific activity and mass activity both give an indication of a given electrocatalyst’s performance towards the ORR, however they represent fundamentally different attributes. Specific activity is the current (measured at 0.9 V in an oxygen atmosphere) normalized to the
ECA of the catalyst, and represents the intrinsic reaction rate taking place at the catalyst surface. In order to determine an electrocatalyst’s true activity, the exchange current density is of
fundamental interest and the desired value to be measured. Practically, however, this value cannot be measured explicitly due to the extremely low currents typically associated. The way exchange current density is surmised is through extrapolation of measured values back to a calculated Nernst potential. This extrapolation method in turn lends itself to a high degree of uncertainty. Empirically measurable numbers (current at 0.9V) used to determine specific and mass activities are easier to cross compare and contain no extrapolation errors. Therefore, current at 0.9 V is used as the representative parameter since it can be easily measured and is still
considered part of the “kinetic region” of a typical i-V curve. Mass activity is the current measured at 0.9 V normalized to the mass of catalyst (in this case Pt) present in the
electrocatalyst layer. Fundamentally, specific activity gives a more accurate assessment of the actual capability of a given catalyst to perform oxygen reduction. Economically, however, mass activity becomes the more important metric since it describes the effectiveness of a given mass (directly related to cost) of catalyst’s ability to perform oxygen reduction.
In order to physically measure ECA, specific activity, and mass activity, both in-situ and ex-situ techniques can be utilized. In-situ techniques can be labor intensive as they require assembling an MEA and an actual PEMFC, and measurements taken accordingly either through current vs potential (i-V) curves or cyclic voltammetry (CV) at the anode or cathode. Conversely, ex-situ measurements can give accurate assessments of catalyst performance without the need for an actual PEMFC assembly. Ex-situ experiments typically involve the use of a rotating disk electrode (RDE) for use in a three-electrode electrochemical cell. ECA can be measured by a variety of techniques; with the two most common using CV for analysing
integration of the hydrogen underpotential deposition (HUPD) region, and CO stripping measurements. Specific and mass activities in regards to the ORR are measured simultaneously through the use of linear sweep voltammetry (LSV) performed in an oxygen atmosphere. RDEs are typically glassy carbon surfaces shrouded in a Teflon cylinder, and preparation involves the synthesis of a catalyst ink which is then applied to the electrode surface as a thin film. Polycrystalline surfaces represent another type of RDE and preparation involves polishing and cleaning the electrode surface.
1.3 System Contamination of PEMFCs
While there has been a concerted effort to develop membranes and electrocatalysts that significantly improve the performance of polymer electrolyte membrane fuel cells (PEMFCs), systematic studies on the magnitude and mechanism of electrocatalyst performance degradation due to foreign chemical species i.e. contaminants, have been less prevalent. Contaminants in this case are defined as any chemical species present in a PEMFC that doesn’t contribute to the basic fuel cell reactions; converting hydrogen and oxygen into water, heat, and electricity.9 With a Department of Energy 2017 target of less than 10% voltage degradation over 5000 hours of automotive fuel cell performance, and a 2013 status of 3600 hours, improvement in the area of durability is still required.10 Air, fuel, and system i.e. balance of plant (BOP), derived chemical impurities represent significant contributors to irreversible performance loss. However due to the wide variety of possible factors affecting durability, many component degradation and failure mechanisms are not well understood.11 Researchers have however determined that degree of performance loss can be severe, and in some cases catastrophic, when certain chemicals come into contact with the cell. Results for these studies show, in many cases, severe effects on fuel cell performance due in large to chemisorption of poisoning anionic and organic compounds in
the catalyst layer, as well as foreign cation uptake in the membrane. Membrane conductivity, specific and mass activity, and ECA have all been found to be affected under certain conditions. Gas diffusion media, flow fields, filters, and bipolar plates have also shown the ability to become obstructed and/or corroded when certain chemicals are present.
1.3.1 Air Source PEMFC Contaminants
Air intake foreign chemical compounds have the ability to negatively impact the cathode, membrane, and also the anode to a small degree based on gas crossover rates through the membrane. Airborne contaminants have been extensively studied. Likewise, due to the almost innumerable different compositions of contaminants that can be drawn from the atmosphere, including automotive exhaust and industrial manufacturing processes, the list of potential impurities found in the air intake of a fuel cell is immense. Table 1.2 shows a summary of potential contaminants originating from the atmosphere and is by no means exhaustive.
Component Contaminant (organic) Contaminant (inorganic) Reference Ambient air C6H6, C3H8 CNCl, CH3POFOCH(CH3)2, ClCH2CH2SCH2Cl, diesel emissions HCN, NH3, NH4+ (created from NH3 in
contact with the membrane), O3, H2S,
SOx (SO2, SO3), NOx, ( NO, NO2),
COx (CO, CO2), rock-derived particles
(containing Na, Mg, Al, Si, P, S, Cl, K, Ca, Ti, Cr, Fe, Ni, Cu, Zn, Pt, Pb), Cl-
9, 12-23
Table 1.2 Summary of potential airborne contaminants present in PEMFCs.
Contamination at the cathode is of great concern due to the already sluggish behaviour of the ORR. SOx, NOx, COx, O3, and other organic species have all been found to contaminant
PEMFCs, resulting in severe damage to the MEA leading to performance degradation.13, 20-24
Since the ORR is the kinetically limiting reaction in a PEMFC, any decreases in ECA at the cathode (resulting from contaminant adsorption to the catalyst layer) or activity (resulting from adsorbed contaminants affecting the ORR direct pathway) have detrimental effects on overall performance. Because it is not economically viable to run pure oxygen through the cell, the cathode air intake is always subject to a multitude of foreign chemical species which the intake filters are sometimes unable to capture. Subsequently, research continues on studying air stream contamination, specifically, the pathways and mechanisms by which poisoning from different chemical species occurs and mitigation strategies designed to limit performance loss.
1.3.2 Fuel Source PEMFC Contaminants
Hydrogen fuel stream contamination occurs on the other side of the fuel cell and mainly affects the anode, membrane, and to a small degree the cathode based on the rate of gas crossover through the membrane. Numerous studies focusing on the performance impact of impurities found in the anode fuel stream have been conducted. Although the hydrogen fuel used in PEMFCs is not subject to nearly as many foreign species as atmospheric air is, the purity of the hydrogen is still directly related to cost. Coupled with the fact that the majority of hydrogen being produced today is synthesized through steam reformation of natural gas, impurities exist in actuality, and Table 1.3 shows a summary of those identified in the hydrogen fuel stream of a PEMFC. Component Contaminant (organic) Contaminant (inorganic) Reference Hydrogen fuel stream CH4, HCOOH CO, CO2, H2S, NH3 23, 25-28
Table 1.3. Summary of potential hydrogen fuel stream contaminants present in PEMFCs.
All the contaminants listed in Table 1.3 have been shown to cause severe performance losses. CO has long been known to be one of the strongest poisons for Pt catalysts, irreversibly binding to the metal surface and effectively blocking any reaction from otherwise proceeding. Contamination at the anode is typically not as detrimental as that of the cathode. However, compared to the cathode, catalyst loadings at the anode are substantially lower, and any loss in ECA due to adsorbed species can still lead to severe performance losses.
1.3.3 Balance of Plant Source PEMFC Contaminants
The last main source of contaminants present in PEMFCs arises from the PEMFC itself, specifically, through the chemical degradation of BOP and MEA components. While extensive research has significantly reduced the cost of the MEA materials over the last decade, a more recent push to reduce the cost of BOP materials is underway. A summary of the cost shared by various components of a PEMFC is shown in Figure 1.5.
Figure 1.5 Summary (2012) of cost distribution among PEMFC system components.29 14
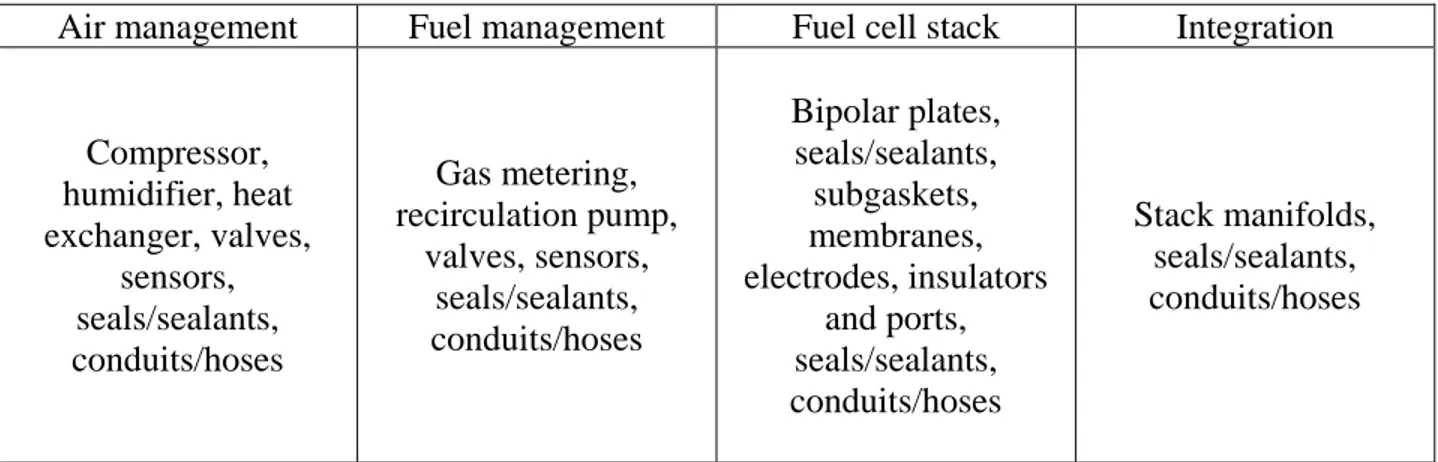
Through the use of cheaper “off the shelf” materials, costs can be significantly reduced. However, as cost of materials decrease, so does their resistance to chemical degradation, and therein a problem occurs. Tables 1.4 and 1.5 show a summary BOP components associated with various sub-systems of a PEMFC, and the common contaminants found to originate from these materials. As Table 1.4 suggests, the variety and complexity of PEMFC system components is vast, making the goal of understanding degradation rates and pathways of all potential materials a daunting challenge.
Air management Fuel management Fuel cell stack Integration
Compressor, humidifier, heat exchanger, valves, sensors, seals/sealants, conduits/hoses Gas metering, recirculation pump, valves, sensors, seals/sealants, conduits/hoses Bipolar plates, seals/sealants, subgaskets, membranes, electrodes, insulators and ports, seals/sealants, conduits/hoses Stack manifolds, seals/sealants, conduits/hoses
Table 1.4 Summary of various BOP materials found in PEMFC subsystems.
Component Contaminant (organic) Contaminant (inorganic) Reference Balance of Plant e.g. structural materials, assembly aids, seals, gaskets,
hoses
Hydrocarbons and aromatics (e.g. hexanediol, glycol, methylbenzenediamine, phenol, caprolactam, methacrylates) Si, Al, S, K, Fe, Cu, Cl, F, SOx, Na, Ca, oils 23, 30-32
Table 1.5 Summary of potential BOP contaminants found in PEMFCs.
Recent studies investigating balance of plant components (e.g. structural materials and assembly aids) have shown fuel cell performance loss occuring due to additives and compounds that leach out of certain materials over time.30, 31, 33-36Additional studies have investigated the performance impact of foreign metal ions (e.g. Fe3+, Ni2+, Cu2+, Cr3+, Al3+ and Co2+), originating from the bipolar plates and catalyst layer.32, 37-42 Finding the right balance between material cost and chemical stability will be a key milestone for the commercial implementation of PEMFCs.
Impurity studies such as those previously mentioned have made it clear that a detailed understanding of the mechanisms and sources of all fuel cell contamination pathways is required in order to develop effective performance loss mitigation strategies. Additionally, another possibility exists in regards to sources of PEMFC contamination. In this scenario, the polymer electrolyte membrane itself could be a source of impurities. Through the unavoidable formation of membrane chemical decomposition products arising from normal fuel cell operation, it is hypothesized that these compounds can migrate and adsorb into the cathode catalyst layer, leading to performance loss. This phenomenon is the focus of this thesis.
1.4 Polymer Electrolyte Membrane Chemical Degradation
While there are many different chemical families of PEMs, perfluorinated sulfonic acid (PFSA) membranes have seen widespread use due to their relatively high ion conduction properties and chemical stability. However, although PFSA membranes are typically more stable than membranes based on hydrocarbon linkages, they are by no means immune to stresses encountered during fuel cell operation, and can be prone to degradation under many types of conditions. Degradation of PFSA PEMs can be characterized in two main categories: mechanical and chemical. Mechanical degradation is commonly associated with physical stresses (e.g.
freezing, drying, swelling) leading to membrane fatigue, cracking, and/or pin-hole formation. Chemical degradation, on the other hand, can be characterized by an overall thinning of the membrane, leading to the release HF along with other small molecules cleaved off the polymer chain. Stresses causing chemical degradation of PEMs typically involve large amplitude voltage and humidity cycling, leading to free radical producing side reactions that in turn, are able to chemically attack certain parts of the polymer chain. Table 1.6 lists the reduction potentials of reactive oxygen species that can form in a PEMFC and lead to chemical attack.
Half Cell Reaction Reduction Potential at pH = 0 (SHE) ∙ 𝑂𝐻 + 𝐻++ 𝑒− → 𝐻 2𝑂 2.59 ∙ 𝐻 + 𝐻++ 𝑒− → 𝐻 2 2.30 ∙ 𝑂𝑂𝐻 + 𝐻++ 𝑒− → 𝐻 2𝑂2 1.48 𝐻2𝑂2+ 2𝐻++ 2𝑒− → 2𝐻2𝑂 1.74
Table 1.6 Summary of reactive oxygen species that can lead to chemical attack of PFSA membranes during PEMFC operation.43
Of all the oxidizing species listed in Table 1.6, ·OH is by far the most reactive and has the potential to create the most harm. Several mechanisms for hydroxyl radical formation in PEMFCs have been proposed, with the main pathways involving the break-down of hydrogen peroxide (formed during incomplete reduction of O2) or reactions between H2 and O2
(originating from gas-crossover through the membrane) at the catalyst surface. Regardless of the formation mechanism, chemical attack on the membrane by hydroxyl radical can proceed by a number of various routes due to a high propensity for hydrogen atom abstraction from O-H and C-H bonds, leading to formation of water molecules.
Previously, studies involving commercial membranes and model compounds have shown that when perfluorinated sulfonic acid (PFSA) membranes are exposed to peroxides and
hydroxyl radicals, several chemical decomposition products can be generated.44-46 Membrane degradation is suggested to occur by way of a polymer chain unzipping mechanism initiated by attack from the hydroxyl radical at various parts of the PFSA chain. Figures 1.6-1.8 describe the chemical degradation pathways in detail, with the main mechanism suggested to involve attack at the carboxylic acid groups, which are unintentionally introduced during the manufacturing process of Nafion® via hydrolysis of the persulfate initiators used for the polymerization process, and which releases fluoride (F-).45
Figure 1.6 Main-chain degradation mechanism; unzipping of the main chain by radical attacks to COOH groups.45 CF2 CF O CF2 CF CF3 O CF2 CF2 SO3H CF2 COOH + CF2 CF O CF2 CF CF3 O CF2 CF2 SO3H CF2 CF2 CF O CF2 CF CF3 O CF2 CF2 SO3H CF2OH CF2 CF O CF2CF CF3 O CF2 CF2 SO3H CFO CF2CF O CF2 CF CF3 O CF2 CF2 SO3H CF2 CF2 CF O CF2 CF CF3 O CF2CF2 SO3H CF2OH CF2 CF O CF2 CF CF3 O CF2 CF2 SO3H CFO CF2 CF O CF2 CF CF3 O CF2 CF2 SO3H COOH HO + HO + H2O + CO2 + H2O + HF + HF 18
Post fluorination of backbone end groups reduces degradation,47 although some residual fluorine release remains even when reactive end groups are virtually eliminated,44, 47 pointing toward additional mechanisms, for instance, from side-chain degradation.
Figure 1.7 Side-chain degradation mechanism; unzipping the side chain via radical attack to the C-S bond.45 CF2CF O CF2CF CF3 O CF2CF2SO3H CF2 + CF2CF O CF2CF CF3 O CF2CF2CF2 CF2 HO + SO3 + H2O CF2CF O CF2CF CF3 O CF2 CF2 + HO CF2 CF2CF O CF2CF CF3 O CF2 CF2 CF2OH CF2CF O CF2CF CF3 O CF2 CF2 CF2OH CF2CF O CF2CF CF3 O CF2 CF2 COF + HF CF2CF O CF2CF CF3 O CF2 CF2 COF + H 2O CF2CF O CF2CF CF3 O CF2 CF2 COOH + HF CF2CF O CF2CF CF3 O CF2 CF2 COOH ... ... CF2CF O CF2 + 9HF + 5CO2 CF2CF O CF2 CF2CF O + CF 2 19
Figure 1.8 Side-chain degradation mechanism; radical attack to the CF backbone carbon. The same mechanism can be assumed for the attack to the tertiary carbon in the side chain.45
Two compounds in particular, perfluoro(2-methyl-3-oxa-5-sulfonic pentanoic) acid (DA-Naf) and perfluoro(4-sulfonic butanoic) acid (DA-3M), both shown in Figure 1.9, arise along with HF as the main membrane degradation compounds of Nafion® and 3M™ commercial PFSA membranes, respectively.44, 46 CF2CF O CF2CF CF3 O CF2CF2 SO3H CF2 + H CF2C O CF2CF CF3 O CF2CF2SO3H CF2 + HF CF2C O CF2CF CF3 O CF2CF2SO3H CF2 + H2O2 CF2C O CF2CF CF3 O CF2CF2SO3H CF2 + H2O O CF2C O CF2CF CF3 O CF2CF2SO3H CF2 O CF2C O CF2CF CF3 O CF2CF2SO3H O + CF2 CF2C O CF2CF CF3 O CF2CF2SO3H O + H2O HO CF2CF CF3 O CF2CF2SO3H CF2C OH O + HO CF2CF CF3 O CF2CF2SO3H + H2O CF O CF2CF2SO3H HOOC CF3 + 2HF 20
Figure 1.9 Chemical structures of studied diacid model compounds representing Nafion (DA-Naf) and 3M (DA-3M) PEM chemical degradation products.
Along with losses in membrane conductivity and structural integrity, the aforementioned degradation products may adsorb on Pt based electrocatalysts, leading to a loss in catalyst ECA, ORR activity, or both. To date, little effort has been put forth in determining the impact PFSA chemical degradation compounds have on catalyst performance, and is the central focus of this thesis.
1.5 Thesis Organization
The overall approach of this research and thesis is to elucidate and quantify the impact that PEM degradation products have on Pt electrocatalyst ECA and oxygen reduction reaction activity. Through the use of ex-situ electrochemical experiments using model compounds, this research serves as a stepping stone to both aid in the assessment of new catalysts and materials as well as enable the determination of PEMFC voltage losses under operating conditions where PEM chemical degradation is occurring.
The main objective of chapter two was to develop a reliable and reproducible method for investigating the impact that contaminating compounds may have on Pt electrocatalyst performance. Studies involved the use of ex-situ, control studies monitoring the changes in Pt electrocatalyst ECA and activity, which inherently occur over time even in a clean system. The experimental methods developed were specifically designed to look at PEM chemical degradation products in the form of model compounds, however the generality and robustness of
the methods produced are able to encompass a wide variety of chemical families in future studies.
Chapter three assesses the effects that model compounds, representing PFSA membrane chemical degradation products, have on ECA and ORR activity for Pt electrocatalysts. Specific chemical functional groups and differences in perfluorocarbon chain length were investigated in order to elucidate the influence that model compound chemical structure has on Pt electrode adsorption. Results found in this chapter are discussed in the journal article, “Impact of Polymer Electrolyte Membrane Degradation Products on Oxygen Reduction Reaction Activity for Platinum Electrocatalysts,” (submitted to the Journal of the Electrochemical Society), Jason M. Christ, K.C. Neyerlin, Ryan Richards, Huyen N. Dinh.
In chapter four, ORR activity losses and changes in ECA are compared among three different Pt electrocatalyst surfaces in the presence of PFSA chemical degradation model compounds (DA-Naf and DA-3M) at increasing concentrations. Trends and differences in adsorption impact are discussed. Results found in this chapter are discussed in the journal article, “Concentration Effects of Polymer Electrolyte Membrane Degradation Products on Oxygen Reduction Activity for Platinum Catalysts,” (submitted to the Journal of the Electrochemical
Society), Jason M. Christ, K.C. Neyerlin, Ryan Richards, Huyen N. Dinh.
Chapter five examines Pt electrode surface coverage of PFSA PEM chemical degradation model compounds through the utilization of an electrochemical quartz crystal microbalance (EQCM). By studying changes in mass occurring at the electrode surface due to compound adsorption, percent coverage can be determined. Results are corroborated with ORR activity losses determined in previous chapters, and are discussed in the journal article, “Organic Perfluorinated Diacid Adsorption on Platinum Catalysts: An Electrochemical Quartz Crystal
Microbalance Study.” (in preparation), Jason M. Christ, Charles B. Staub, Ryan Richards, Huyen N. Dinh.
This thesis concludes with chapter six, where the performed work is summarized and future research proposals are discussed.
Appendix A contains control study results in regards to ORR activity losses for polycrystalline Pt, Pt/Vu, and NSTF electrodes in the presence of different concentrations of model compound contaminants.
Appendix B contains the permissions from the journals in which each chapter was submitted, as well as permissions from all co-authors to reuse the papers in this thesis.
1.6 References
1. D. M. Bernardi and M. W. Verbugge, J. Electrochem. Soc., 139, 2477 (1992). 2. A. Parthasarathy, S. Srinivasan, A. J. Appleby and C. R. Martin, Journal of the
Electrochemical Society, 139, 2530 (1992).
3. A. Stassi, C. D'Urso, V. Baglio, A. Di Blasi, V. Antonucci, A. S. Arico, A. M. Castro Luna, A. Bonesi and W. E. Triaca, Journal of Applied Electrochemistry, 36, 1143 (2006). 4. R. G. Gonzalez-Huerta, J. A. Chavez-Carvayar and O. Solorza-Feria, Journal of Power
Sources, 153, 11 (2006).
5. Y. Gochi-Ponce, G. Alonso-Nunez and N. Alonso-Vante, Electrochemistry Communications,
8, 1487 (2006).
6. K. C. Neyerlin, W. Gu, J. Jorne and H. A. Gasteiger, Journal of the Electrochemical Society,
153, A1955 (2006).
7. J. J. Zhang, H. J. Wang, D. P. Wilkinson, D. T. Song, J. Shen and Z. S. Liu, Journal of Power
Sources, 147, 58 (2005).
8. R. O'Hayre, S.-W. Cha, W. Colella and F. B. Prinz, Fuel Cell Fundamentals, 2nd Edition, John Wiley and Sons (2009).
9. J. St-Pierre, in Polymer Electrolyte Fuel Cell Durability, F. Büchi, M. Inaba and T. Schmidt Editors, p. 289, Springer New York (2009).
10. J. Kurtz, H. Dinh, S. Sprik, G. Saur, C. Ainscough and M. Peters, DOE Hydrogen and Fuel
Cells Program: FY 2013 Annual Progress Report (2013).
11. R. Borup, J. Meyers, B. Pivovar, Y. S. Kim, R. Mukundan, N. Garland, D. Myers, M. Wilson, F. Garzon, D. Wood, P. Zelenay, K. More, K. Stroh, T. Zawodzinski, J.
Boncella, J. E. McGrath, M. Inaba, K. Miyatake, M. Hori, K. Ota, Z. Ogumi, S. Miyata, A. Nishikata, Z. Siroma, Y. Uchimoto, K. Yasuda, K.-i. Kimijima and N. Iwashita,
Chemical Reviews, 107, 3904 (2007).
12. M. C. Betournay, G. Bonnell, E. Edwardson, D. Paktunc, A. Kaufman and A. T. Lomma,
Journal of Power Sources, 134, 80 (2004).
13. Y. Garsany, O. A. Baturina and K. E. Swider-Lyons, Journal of the Electrochemical Society,
154, B670 (2007).
14. R. Halseid, T. Bystron and R. Tunold, Electrochimica Acta, 51, 2737 (2006).
15. R. Halseid, P. J. S. Vie and R. Tunold, Journal of the Electrochemical Society, 151, A381 (2004).
16. R. Halseid, P. J. S. Vie and R. Tunold, Journal of Power Sources, 154, 343 (2006). 17. F. Jing, M. Hou, W. Shi, J. Fu, H. Yu, P. Ming and B. Yi, Journal of Power Sources, 166,
172 (2007).
18. J. St-Pierre, Journal of Power Sources, 196, 6274 (2011).
19. J. St-Pierre, International Journal of Hydrogen Energy, 36, 5527 (2011).
20. R. Mohtadi, W. K. Lee and J. W. Van Zee, Journal of Power Sources, 138, 216 (2004). 21. J. M. Moore, P. L. Adcock, J. B. Lakeman and G. O. Mepsted, Journal of Power Sources,
85, 254 (2000).
22. T. Okada, in, F. N. Büchi, M. Inaba and T. J. Schmidt Editors, p. 323, Springer New York (2009).
23. X. Cheng, Z. Shi, N. Glass, L. Zhang, J. J. Zhang, D. T. Song, Z. S. Liu, H. J. Wang and J. Shen, Journal of Power Sources, 165, 739 (2007).
24. D. J. Yang, J. X. Ma, L. Xu, M. Z. Wu and H. J. Wang, Electrochimica Acta, 51, 4039 (2006).
25. K. Kortsdottir, R. W. Lindstrom, T. Akermark and G. Lindbergh, Electrochimica Acta, 55, 7643 (2010).
26. J. J. Baschuk and X. G. Li, Int. J. Energy Res., 25, 695 (2001).
27. X. Zhang, H. M. Galindo, H. F. Garces, P. Baker, X. Wang, U. Pasaogullari, S. L. Suib and T. Molter, Journal of the Electrochemical Society, 157, B409 (2010).
28. X. Zhang, U. Pasaogullari and T. Molter, International Journal of Hydrogen Energy, 34, 9188 (2009).
29. D. S. Ginley and D. Cahen, Fundamentals of materials for energy and environmental
sustainability, Cambridge university press (2011).
30. C. S. Macomber, J. Christ, H. Wang, B. S. Pivovar and H. N. Dinh, ECS Transactions, 50, 603 (2013).
31. H.-S. Cho, M. Ohashi and J. W. Van Zee, ECS Transactions, 41, 1487 (2011).
32. M. S. Opu, M. Ohashi, H.-S. Cho, C. S. Macomber, H. N. Dinh and J. W. Van Zee, ECS
Transactions, 50, 619 (2013).
33. C. Macomber, H. Wang, K. O'Neill, S. Coombs, G. Bender, B. Pivovar and H. N. Dinh, ECS
Transactions, 33, 1637 (2010).
34. H. Wang, S. Coombs, C. Macomber, K. O'Neill, G. Bender, B. Pivovar and H. N. Dinh, ECS
Transactions, 33, 1617 (2010).
35. H. Wang, C. S. Macomber and H. N. Dinh, ECS Transactions, 50, 659 (2013).
36. H. Wang, C. Macomber, J. Christ, G. Bender, B. Pivovar and H. N. Dinh, Electrocatalysis,
5, 62 (2014).
37. M. J. Kelly, G. Fafilek, J. O. Besenhard, H. Kronberger and G. E. Nauer, Journal of Power
Sources, 145, 249 (2005).
38. M. Sulek, J. Adams, S. Kaberline, M. Ricketts and J. R. Waldecker, Journal of Power
Sources, 196, 8967 (2011).
39. H. Li, J. Gazzarri, K. Tsay, S. Wu, H. Wang, J. Zhang, S. Wessel, R. Abouatallah, N. Joos and J. Schrooten, Electrochimica Acta, 55, 5823 (2010).
40. H. Li, K. Tsay, H. Wang, J. Shen, S. Wu, J. Zhang, N. Jia, S. Wessel, R. Abouatallah, N. Joos and J. Schrooten, Journal of Power Sources, 195, 8089 (2010).
41. R. Jia, B. Han, K. Levi, T. Hasegawa, J. Ye and R. H. Dauskardt, Journal of Power Sources,
196, 3803 (2011).
42. T. Y. Paul, E. A. Bonn and B. Lakshmanan, (2013).
43. C. S. Gittleman, F. D. Coms and Y.-H. Lai, M. Mench, T. Nejat Veziroglu and EC Kumbur,
Elsevier, 15 (2011).
44. C. Zhou, M. A. Guerra, Z. M. Qiu, T. A. Zawodzinski and D. A. Schiraldi, Macromolecules,
40, 8695 (2007).
45. L. Ghassemzadeh, K.-D. Kreuer, J. Maier and K. Müller, The Journal of Physical Chemistry
C, 114, 14635 (2010).
46. J. Healy, C. Hayden, T. Xie, K. Olson, R. Waldo, A. Brundage, H. Gasteiger and J. Abbott,
Fuel Cells, 5, 302 (2005).
47. D. E. Curtin, R. D. Lousenberg, T. J. Henry, P. C. Tangeman and M. E. Tisack, Journal of
Power Sources, 131, 41 (2004).
CHAPTER 2
METHOD DEVELOPMENT FOR STUDYING THE ELECTROCHEMICAL IMPACT OF CONTAMINANTING CHEMICAL COMPOUNDS ON ELECTROCATALYST
PERFORMANCE USING A ROTATING DISK ELECTRODE
Understanding the behavior of an electrochemical system to be studied, while present in its clean, controlled, baseline state, is essential in order to accurately determine electrode surface adsorption effects caused by foreign chemical compounds. Failure to recognize the importance of control studies could result in severe inaccuracies and misrepresentations of specific chemical effects on electrochemical behavior and could lead the experimenter to erroneous conclusions about a given system. Several experiments were thus conducted in order to accurately assess several key metrics such as ECA and ORR activity losses during control studies, as well as the length of time required to reach steady state electrode behavior after injecting a foreign chemical species into the electrochemical cell. Results from these studies helped determine the experimental parameters used when studying the effects that model compounds, representing polymer electrolyte membrane (PEM) chemical degradation products, have on Pt rotating disk electrode (RDE) surfaces.
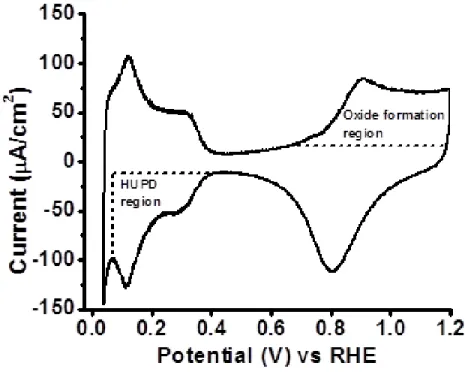
The initial phase in determining the adsorption effects of PEM degradation products on a polycrystalline platinum RDE involved using CV to monitor the impact that adsorbing compounds have on the hydrogen underpotential deposition (HUPD) region as well as on oxide formation. A polycrystalline Pt surface was initially chosen in order to gain fundamental insight on adsorption without interference from ionomer and/or carbon supports. Figure 2.1 shows a typical CV trace taken on a freshly polished and clean, polycrystalline Pt RDE. HUPD and oxide
formation regions are highlighted (dashed areas of Figure 2.1). Changes in ECA, along with any additional peaks or changes in the shape and/or overall size of the HUPD and oxide formation regions associated with the CV trace, provide a strong indication that compound adsorption is occurring at the electrode surface.
Figure 2.1 Baseline CV trace for polycrystalline Pt RDE in 0.1 M HClO4, scan rate 50 mV/s.
2.1 Experimental Apparatus and Setup
Electrochemical experiments performed in this thesis utilized a custom made, glass, 3-electrode cell, shown in Figure 2.2. Electrochemical measurements were taken using an Autolab PGSTAT302N. A reversible hydrogen electrode (RHE) and a platinum mesh were used as the reference and counter electrode respectively.
Figure 2.2 Electrochemical cell and RDE setup.
Data was collected at room temperature in a custom glass electrochemical cell purged with either 99.9999% pure nitrogen or 99.998% pure oxygen (Matheson Tri Gas). Electrochemical experiments utilized 0.1 M perchloric acid electrolyte (diluted from 70% HClO4 double distilled
veritas grade, GFS Chemical) along with a polycrystalline Pt rotating disk electrode (RDE) (Pine Instruments). The electrode surfaces were prepared by polishing with 0.05 μM alumina slurry followed by rinsing and sonication in 18.2 MΩ water.
2.2 Determination of Stable Adsorption Time for Model Compounds
Prior to investigating adsorption characteristics of PEM degradation model compounds, a study was performed to determine the time required for steady state compound adsorption while rotating the RDE at 2500 rpm. (Note: 2500 rpm was the lowest rotation speed at which purge gas bubbles were consistently removed from the electrode surface). A small aliquot of HCl, chosen
due to the well-known adsorption/poisoning effects of Cl- on Pt,1-3 was injected into the cell (resulting in a cell concentration of 0.1 mM HCl) while performing a continual CV scan. HCl injection occurred at the start of the cathodic potential sweep (1.4 V vs RHE), at a scan rate of 100 mV/s. Subsequent CV scans were performed until stable, sequential voltammograms were obtained. Figure 2.3 shows CVs for polycrystalline Pt baseline, initial HCl injection, and steady state post HCl injection. Results show subtle effects on the Pt oxide reduction region approximately 5 seconds after the initial injection, and a steady state CV reached after approximately 10 seconds, indicating that the time it takes for injected Cl- ions to reach the electrode surface was quite fast and likely dominated by convection. However, although a steady state CV was obtained only 10 seconds after injection in the case of HCl, we anticipated that this may not be the case for larger, more complex organic compounds.
Figure 2.3 Time (10 seconds) required for HCl to interact and equilibrate on polycrystalline Pt electrode in 0.1 M HClO4, scan rate 100 mV/s, rotation at 2500 rpm. Initial impact observed at
ca. 5 seconds; steady state CV observed after ca. 10 seconds. Black dash: baseline; blue dash: initial scan after injection; red solid: steady state CV.
In order to obtain a more complete understanding of the time required for stable adsorption of larger, organic molecules on the electrode surface, caprolactam and hexanediol, molecules with known adsorption effects and more representative (in regards to their organic nature and size) of the PEM degradation compounds of interest, were studied using the previously described injection procedure. Figures 2.4 and 2.5 show that time constant representations for caprolactam and hexanediol respectively, are in one aspect similar to HCl, since the time from injection to initial electrode interaction is fast (<10 seconds). However, time required for the CV to reach steady state was significantly greater (2.5 minutes compared to 10 seconds for HCl) for both compounds.
Figure 2.4 Time required for caprolactam to interact and equilibrate on polycrystalline Pt electrode surface in 0.1 M HClO4, scan rate 100 mV/s, rotation at 2500 rpm. Initial impact
observed after ca. 10 seconds; steady state CV observed at ca. 2.5 minutes.