BIOGAS PURIFICATION, COMPRESSION AND
STORAGE: A PROMISING ENERGY
RECOVERY AND DELIVERY TECHNOLOGY
FOR NEPAL
Sunil Prasad Lohani
Suraj Pandey
Bivek Baral
Department of Mechanical Engineering, Kathmandu University, Nepal
ABSTRACT
Municipal solid waste in the Kathmandu Valley and emerging cities has been a burden for the government of Nepal for over adecade. Nepal, these days, is notorious in illegal dumping of solid waste on riverbanks and crossroads at urban cities creating a serious environmental and public health problem besides destroying the city’s beauty and hindering cultural and religious activities. Time and again, conflict of poorly managed landfill sites have arisen which led to halt of solid waste collection in Kathmandu valley for several days in a place where daily solid waste generation is about 500 tones of which 69 percent is of organic materials and 24 percent recyclable materials (plastics, paper, metal, glass). In order to solve the solid waste management problem in urban cities, the country failed to introduce any reliable and sustainable technology. However, among several waste management technologies available, biogas production may prove to be viable and sustainable waste to energy conversion technology. But biogas can supply energy only near to the plant, which limits its wide spread application and, therefore, bottling of biogas is a must to supply it in and around the cities and villages. In this paper we evaluate the model used in bio-based energy laboratory, Kathmandu University to upgrade and bottle biogas in a cylinder. It is found that the biogas purification, compression and storage system of Kathmandu University has net energy output 180 kWhth per cycle.
KEYWORDS
Municipal Solid waste, Biogas, Upgrading, Compression, Pressure Swing Adsorption (PSA)
1 INTRODUCTION
The environmental acceptable management of municipal solid waste of Kathmandu valley (Capital city of Nepal) has become a great challenge to government of Nepal. The illegal dumping of solid waste on riverbanks and crossroads is not only a solid waste management or disposal problem but also a lack of public awareness in sanitation, health and clean and green energy system. In 2004, the Kathmandu Valley was estimated to generate about 308 tons, 0.416 kg/day-capita of solid waste per day [1]. In 2015, the figure will rise to 550 tons per day [1]. The reason is rapid and rampant urbanization, and change in consumer behavior pattern. A breakdown of the composition of the solid waste produced in the Kathmandu Valley shows
the similar trend of 65 to 70 percent organic materials and 20 to 25 percent recyclable materials (plastics, paper, metal, glass) [2,3 & 4]. In principle, the characteristics of the municipal solid waste are a significant parameter in deciding a type of collection and disposal mechanism.
Since energy is basic inputs for all economic activities, the energy requirements of the country are met mainly through unsustainable exploitation of biomass and petroleum products imported from other countries. The ever increasing oil and gas price, high health risk associated with firewood burning, and high importance to manage municipal solid wastes in a right way, it was necessary for the concerns to consider other alternatives which are sustainable and affordable. In order to solve these problems at once, an idea to turn municipal solid waste into energy came into the light.
The idea to turn municipal organic waste (about 70 percent in Kathmandu Valley) into energy (biogas) through anaerobic digestion could possibly handle more than 350 tones organic waste daily. This not only reduce solid waste management problem but also improves environment, city’s beauty and water quality. Moreover, it will produce large amount of clean energy (biogas) and nutrients rich fertilizer that could improve crop productivity and soil quality. Pokheral, [5] and Gautam et.al., [6] discuss the current status and potential of biogas production in Nepal. Gautam et.al, [6] reveal that the biogas has helped the nation in many ways; like income generation, life style improvements, cost savings, improvement in health, education, employment generation, reduction in fuel consumption etc. However, all these studies have been centered on household biogas production which is of 4m3 to 8m3 sizes and principal feeding material is cattle dung. Though there is more than 175,000 [7] (BSP, 2009) small-size domestic biogas plants are already installed in Nepal, all of these plants are installed near to the house and used for cooking energy of households requirements. These plants are not meant for converting municipal biodegradable solid waste to energy as well as not being able to deliver energy far away from the place of production. However, there is no or very less attempt to use municipal biodegradable solid waste as feeding materials and construct medium size plants (30 - 100 m3) to produce biogas from MSW as decentralized energy generation systems and then upgrade and bottle it to the cylinders to supply it all over the country which could possibly replace LPG cylinders that is being used for cooking energy, could be used to run engines to produce electricity as well as vehicle fuels. Therefore, a decentralized energy generation system which is independent of external influences and based on conversion of MSW into biogas offers an ample opportunity to solve many problems; energy, economic, social and environment at once. In order to achieve successful outcomes this paper aims to bridge a gap of lack of studies on the technical, social and economic benefits and challenges of the biogas upgrade and bottling technology for municipal solid waste in urban cities of Nepal.
2 BIOGAS UPGRADING
2.1 Biogas generation and upgrading
The biodegradable waste can be converted into energy by means of anaerobic digestion. This process produces biogas which is a mixture of gases produced by methanogenic bacteria in a methanization process of biodegradable materials in an anaerobic condition. Biogas is composed of various gases such as methane 50-70%, Carbon dioxide 30-40%, Nitrogen 1-2%, Hydrogen sulphide less than 1% and traces of water vapor [8].
In order to obtain energy from biogas in a more productive way, the biogas must be upgraded and its pollutants should eliminate. This means that mainly carbon dioxide, water and hydrogen sulphide must be removed so that an enriched methane (CH4) remains which is only energy source in biogas. The removal of H2S is important because it may deteriorate
metallic parts due to its corrosive property. Water must be removed because of its accumulation potential of condensate in the pipeline. And, last but not the least CO2 must be
removed if the biogas is to be upgraded to standard natural gas as vehicle fuels because CO2
reduces the energy content of the biogas [9] and it needs additional energy input to compress it.
Experience shows that removal of carbon dioxide is a must if biogas is to be compressed and stored in cylinders. But to run an engine it is found that presence of up to 30% carbon dioxide improve the engine performance whereas biogas containing more than 40% carbon dioxide needs scrubbing [10].
2.2 Technologies for upgrading biogas
Biogas upgrading is needed to fulfill the requirements of some appliances such as vehicle, fuel cell, engine etc.; in order to improve the heating value as well as quality of biogas. So it is pertinent to say that the desired quality of biogas depends strongly on the application [11]. Various methods can be used to remove carbon dioxide from biogas, these are pressure swing adsorption (PSA) with activated carbon or molecular sieves, physical absorption, chemical absorption, use of organic solvents, cryogenic separation and membrane separation [9,11]. However, to remove H2S from biogas commonly used process are dry oxidation process and
liquid phase oxidation process [12].
Among these various methods physical/chemical absorption are generally used as they are effective even at low flow rates of biogas which is in fact a real scenario of the plant [12]. One of the simple, economic, eco-friendly and realistic method for CO2 removal from biogas
even in rural areas is water scrubbing [8], which uses pressurized water as an absorbent and compressed biogas is fed into the packed column from the bottom and pressurized water sprayed from the top. This removes CO2 but also H2S from biogas since these gases are more
soluble in water than methane. High purity biogas (>95% methane content) can be achieved with this method (Wellinger, A. and A. Lindeberg, 1999).
The chemical absorption process involves formation of reversible chemical bonds between the solute and the solvent; therefore, regeneration of the solvent involves breaking of these chemical bonds. The chemical solvents generally used are either aqueous solution of amines or aqueous solution of alkaline salts. In this process CO2 content of biogas is reduced from
about 40% to 0.5-1.0% [8].
Membrane separation is based on the principle that gas to be purified flows through a thin membrane, which is more permeable to some gas components than the others. For high methane purity, permeability must be high; for example: solid membrane constructed from acetate-cellulose polymer has permeability for CO2 and H2S is up to 20 and 60 times higher
than CH4, respectively. However, high pressure 25-40 bars is required for the process [13].
The cryogenic separation process involves the separation of gas mixtures by fractional condensation and distillation at low temperatures. In this process biogas is compressed nearly to 80 bars and cooled with chillers nearly to -45 0C. More than 97% pure methane can be obtained by this process [12].
Adsorption process is such that when gas or liquid solute gets accumulated on the surface of a solid or liquid adsorbent for example silica, alumina, activated carbon or silicates, which are also known as molecular sieves [12]. The selectivity of adsorption is achieved by different mesh sizes and/or application of different gas pressures. Components such as CO2, water
vapor and H2S can be separated by using pressure swing adsorption (PSA) system where the
extracted compound from the biogas are desorbed when the pressure is released [9].
Dry oxidation process can be used to remove hydrogen sulphide from the biogas by converting it into sulpher or oxides of sulpher. This process is applied when sulpher content is low and relatively high purity is required [12].
Liquid phase oxidation process generally applied physical absorption process or chemical absorption process. Chemical absorption of H2S is extremely effective in reducing high level
of H2S.
3 DESCRIPTION OF THE PILOT PLANT
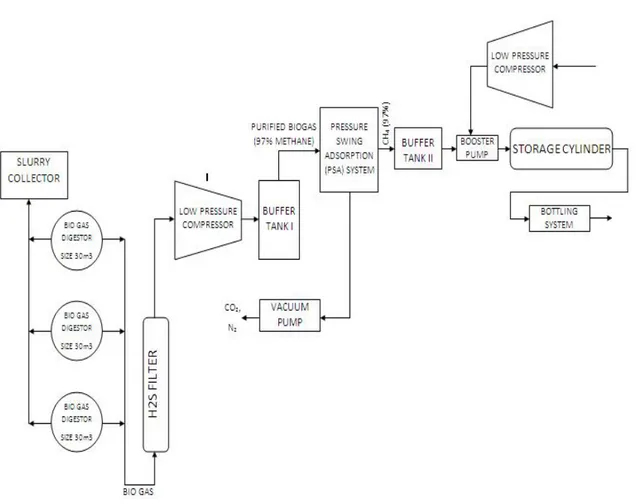
The model used in bio-based energy laboratory, Kathmandu University to generate, upgrade and bottle biogas into cylinders has shown in figure 1. It has three different stages:
Stage 1: generation of biogas through three different bio-digesters of 30 m3 each that could produce 18 m3 biogas per day in an optimal working condition. Biogas generation from
underground anaerobic digester is highly depended on atmospheric temperature and loading condition. The methanization process is optimal at 30-35 oC in a mesophilic condition of digestion process. However, the average temperature of bio-based energy laboratory, Kathmandu University site is around 25-30 oC in summer and about 10-15 oC in winter. So, biogas production in winter season is only about 20% of normal production rate.
Stage 2: removal of H2S, CO2, and water vapor by H2S filter and pressure swing adsorption
(PSA) system. The removal of hydrogen sulphide is done by dry oxidation process. Biogas is passed through iron oxide pellets to remove H2S. In this process iron oxide reacts with H2S to
form iron sulphide. Removal of carbon dioxide is possible by using PSA system which consists of three active carbon bed columns. Each column works independently with each other. Biogas that is stored in a buffer tank 1 is passed through a first activated carbon bed column under 3 bar pressure to remove carbon dioxide from the gas while the second and third columns gets prepared in that period. When the first column is in operation and second column completes its preparation to take up biogas and biogas passes through the second column. Similarly, the column works when first and second columns are under functional. This process produces about 97% pure methane from general biogas. The adsorbed carbon dioxide is desorbed when pressure is released and removed into the atmosphere by vacuum pump.
Stage 3: compression and bottling of purified biogas: The biogas composition is in general 60% methane and 40% carbon dioxide, but after purification 97% pure methane is produced. The daily biogas production from all three digesters is about 18 m3. Considering about 70% plant efficiency (taking account of seasonal and other factors) [4], and 40% carbon dioxide in a biogas, 6 m3 pure methane is available per day. After purification process, the purified gas is compressed up to 230 bars by using a high pressure compressor and a booster pump. Compressor supplies 6 bar pressure to a booster pump and the booster pump produce 230 bar compressed methane which is stored in a cylinder of water volume 585 Nliters. The stored gas is bottled into cylinders of different sizes at pressure of 120 bars for domestic and other purpose and at 200 bars for vehicle fuels.
Figure 1: Biogas Generation, Upgrading and Compression System
4 ENERGY BALANCE FOR BIOGAS UPGRADING AND BOTTLING
The energy balance of any energy generation system is a prominent factor to decide whether the system is feasible or not. If net energy output of the system is negative then the system is said to be not feasible option. However, it is not easy to decide how to calculate energy balance of the system; for example in the case of energy generation from municipal biodegradable solid waste it is wise to consider environment benefit, regain of aesthetic beauty of the city due to waste management and several other benefits associated with waste management. But in this energy balance we only consider net energy balance of the biogas purification, compression and bottling plant. This energy balance does not consider any energy input to the biogas generation and/or any other benefits associated during biogas generation as well as it does not consider distribution and transportation energy balance. The energy consumption of the system for upgrading and bottling is shown in table 1.
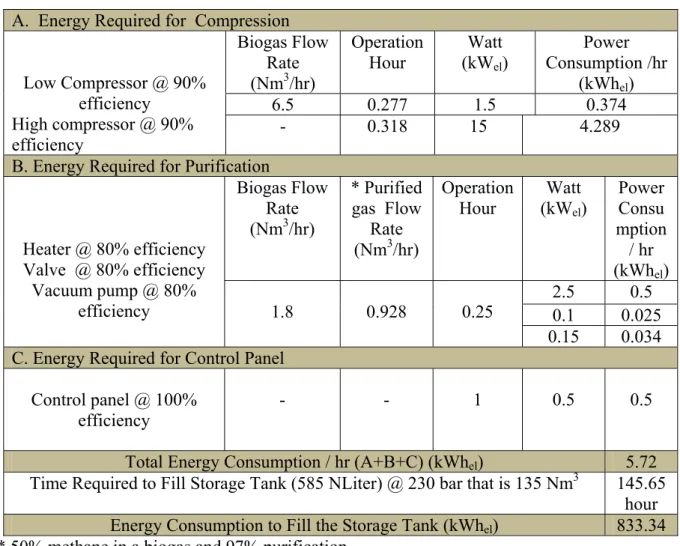
Table 1: Energy demand for Biogas Upgrading and Bottling
A. Energy Required for Compression Biogas Flow Rate (Nm3/hr) Operation Hour Watt (kWel) Power Consumption /hr (kWhel) 6.5 0.277 1.5 0.374 Low Compressor @ 90% efficiency High compressor @ 90% efficiency - 0.318 15 4.289
B. Energy Required for Purification
Biogas Flow Rate (Nm3/hr) * Purified gas Flow Rate (Nm3/hr) Operation Hour Watt (kWel) Power Consu mption / hr (kWhel) 2.5 0.5 0.1 0.025 Heater @ 80% efficiency Valve @ 80% efficiency Vacuum pump @ 80% efficiency 1.8 0.928 0.25 0.15 0.034 C. Energy Required for Control Panel
Control panel @ 100% efficiency - - 1 0.5 0.5 Total Energy Consumption / hr (A+B+C) (kWhel) 5.72
Time Required to Fill Storage Tank (585 NLiter) @ 230 bar that is 135 Nm3 145.65 hour Energy Consumption to Fill the Storage Tank (kWhel) 833.34
* 50% methane in a biogas and 97% purification
Above table shows that amount of energy required to purify, compress and bottle biogas into a cylinder. It further shows that flow rate of purified biogas and time needed to fill the storage tank of the plant. Based on these facts the net energy output of the system in other words energy balance of the plant can be derived. Table 2 shows energy balance of the biogas upgrading and bottling plant.
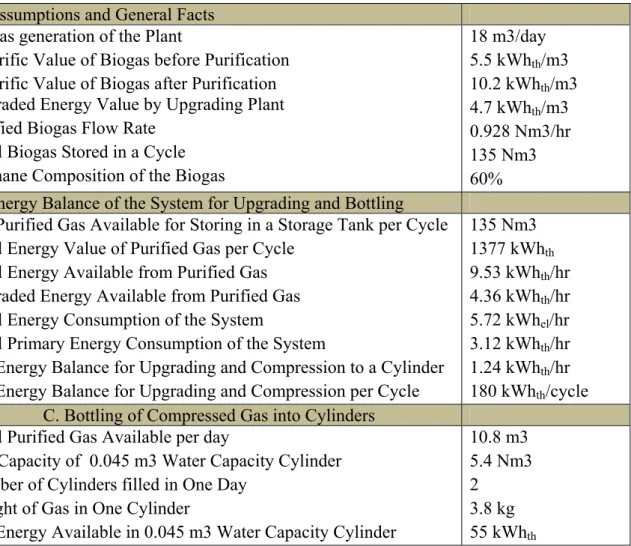
Table 2: Energy Balance for Biogas Upgrading and Bottling System
A. Assumptions and General Facts Biogas generation of the Plant
Calorific Value of Biogas before Purification Calorific Value of Biogas after Purification Upgraded Energy Value by Upgrading Plant Purified Biogas Flow Rate
Total Biogas Stored in a Cycle Methane Composition of the Biogas
18 m3/day 5.5 kWhth/m3 10.2 kWhth/m3 4.7 kWhth/m3 0.928 Nm3/hr 135 Nm3 60% B. Energy Balance of the System for Upgrading and Bottling
Net Purified Gas Available for Storing in a Storage Tank per Cycle Total Energy Value of Purified Gas per Cycle
Total Energy Available from Purified Gas Upgraded Energy Available from Purified Gas Total Energy Consumption of the System Total Primary Energy Consumption of the System
Net Energy Balance for Upgrading and Compression to a Cylinder Net Energy Balance for Upgrading and Compression per Cycle
135 Nm3 1377 kWhth 9.53 kWhth/hr 4.36 kWhth/hr 5.72 kWhel/hr 3.12 kWhth/hr 1.24 kWhth/hr 180 kWhth/cycle
C. Bottling of Compressed Gas into Cylinders Total Purified Gas Available per day
Gas Capacity of 0.045 m3 Water Capacity Cylinder Number of Cylinders filled in One Day
Weight of Gas in One Cylinder
Net Energy Available in 0.045 m3 Water Capacity Cylinder
10.8 m3 5.4 Nm3 2
3.8 kg 55 kWhth
The purified gas is compressed up to 230 bars using a high pressure compressor and booster pump and stored in a storage tank of 585 NLiter water capacities. The stored purified gas is then bottled into cylinders of 0.045 m3 water capacities CNG cylinders. About 2 cylinders per day can be filled with purified biogas as shown in table 2. The net energy balance of the system shows that 180 kWh/cycle energy positive, which means the biogas purification; compression and bottling can prove to be a viable energy recovery and delivery option for Nepal.
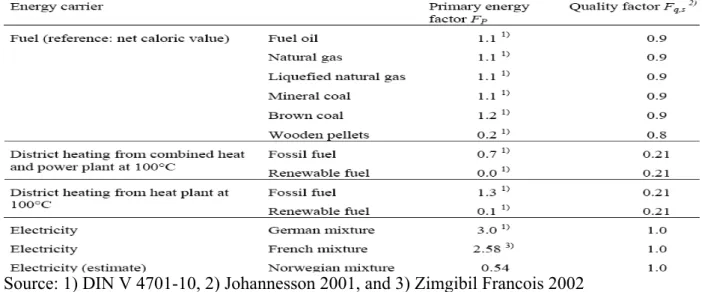
From the table 3 it is seen that primary energy factor for German mixture electricity is 3, that means most of the energy is generated from thermal power plant (using coal, gas and oil as fuel) whereas primary energy factor for Norwegian mixture electricity is estimated only 0.54. In Norway most of the electricity is generated from Hydropower. More than 99 percent electricity in Nepal is generated from Hydropower, so, primary energy factor for Nepal can be estimated about 0.54. This primary energy factor is used to calculate primary energy consumption of the biogas upgrading and bottling system in table 2 just to make sure the correct comparison of net energy value of the system.
Table 3: Primary energy factor and quality factor of different energy carrier (Schmidt, 2004)
Source: 1) DIN V 4701-10, 2) Johannesson 2001, and 3) Zimgibil Francois 2002
5 APPLICATION OF BOTTLED UPGRADED BIOGAS
Upgraded biogas can be used to run diesel or petrol engine by slight adjustment to the engine, which gives wonderful opportunities to run rural agro industries in a rural places of the country where electricity is not available. Similarly, the engine can run generator and then produce electricity in an isolated areas where no electricity is available. The bottled cylinders can also be used as cooking fuels in urban cities replacing LPG cylinders and kerosene stoves. Moreover, it has tremendous potential to use as CNG gases for vehicle fuels and fuel for fuel cells to generate electricity.
6 CONCLUSIONS
Biogas generation from municipal biodegradable solid waste is environmentally acceptable solution for solid waste management system. It has several advantages at once: improve city’s beauty, environment, health of city’s dwellers and most importantly energy recovery and fertilizer production. The technology to turn solid waste into energy ‘anaerobic digestion’ is simple and economy technology available in the society. To use biogas for some specific applications such as compress and bottle in cylinders for easy delivery of energy from place to place, to use for vehicle fuels, to run engines etc. biogas upgrading is necessary. Pressure Swing Adsorption system is highly reliable methods to purify biogas, it gives out about 97% pure methane. The net energy balance to upgrade and bottle biogas into cylinders has proved to be energy positive. It has 180 kWh per cycle net energy output during biogas upgrading and bottling process. This may prove to be a reliable source of decentralize energy and solid waste management system in future.
REFRENCES
[1] JICA, 2000. Clean Kathmandu Valley Study.
[2] Forum for Environmental Management and Research Nepal,
[3] UNEP, 2001. Nepal: state of the environment 2001. Published by United Nations Environment Programme (UNEP) in collaboration with MoPE HMGN, SACEP, ICIMOD and NORAD.
[4] Joshi, P.S., 2003. Okarpauwa is not a solution. In Himal a biweekly magazine (in Nepali), 2–16 November, pp. 36–37.
[5] Pokharel S., 2007. Kyoto protocol and Nepal’s energy sector. Energy Policy, Vol. 35, pp. 2514–25.
[6] Gautam R., Baral S., Heart S., 2007. Biogas as a sustainable energy source in Nepal: present status and future, Renewable and Sustainable Energy Reviews, Vol 13, pp 248-252. [7] Syed J. I., 2006. A Case study to bottle the biogas in cylinders as source of power for Rural Industry Development in Pakistan, World Applied Science Journal 1 (2): pp. 127-130. [8] Wellinger A., and A. Lindeberg., 1999. Biogas upgrading and utilisation. IEA Bioenergy Task 24: energy from biological conversion of organic waste.
[9] Bari S., 1996. Effect of carbon dioxide on the performance of biogas/diesel dual - fuel engine, World Renewable Energy Congress.
[10] Appels L., Baeyens J., Degre`ve J., Dewil R., 2008. Principles and potential of the anaerobic digestion of waste-activated sludge. Progress in Energy and Combustion Science, 34 pp. 755–81.
[11] Kapadi S.S., Vijay V.K., Rajesh S.K., Prasad R., 2005. Biogas scrubbing, compression and storage: Perspective and Prospectus in Indian context, Renewable Energy, Vol 30, pp. 1195-1205.
[12] Hagen M., Polman E., 2001. Adding gas from biomass to the gas grid. Final report submitted to Danish Gas Agency; pp. 26–47.