Centralization of inventory management for spare parts
- A case study on its performance compared to the current inventory control system at Arriva DK
Stefan Petersson Simon Sturesson
Faculty of Engineering at Lund University Division of Production Management
Background
Arriva DK has been part of Denmark’s public transport since 1997 after buying the Danish bus company Unibus. Today, after acquiring several different bus companies, Arriva is Denmark’s largest bus company with a market share of about 50 % and traffics most parts of Denmark with approximately 1300 buses.
The buses are serviced and repaired in different depots across Denmark that also functions as warehouses. Arriva DK currently has a decentralized organization where each depot is responsible for the inventory control of their spare parts. This type of organization often presents challenges when it comes to control and management.
Arriva DK suffers from high order costs due to lack of coordination between the depots and the suppliers. As a first step, Arriva DK has implemented a joint replenishment policy at the depots. This means that when a depot places an order with a supplier; all products from that supplier are ordered at the same time to reduce the order cost.
Arriva DK feels, however, that there are more room for improvement. With a central warehouse, which functions as a
bundling and distribution centre between the suppliers and the depots, even more products can be jointly replenished. The depots can then order a group of products, from the central warehouse; independent of which suppliers they originate from. At the same time, new costs, such as transportation costs, will arise. The possible benefits and drawbacks, of a central warehouse, will be impossible to scale and quantify without further analysis. Objective
The aim of this study is to optimize inventory management by creating simulation models that from a cost perspective explore the effects of introducing a central warehouse for spare parts.
Method
The thesis is built on Hillier and Lieberman’s Operations research method. Data used in the thesis consist of both primary and secondary quantitative and qualitative data. Literature studies have also been done and are the basis for the theory. Two simulation models were built. The first model represents an optimized decentralized situation that uses joint replenishment. The second model represents a system with a central
warehouse, which also uses joint replenishment. Thereafter the models were compared to determine if an investment in a centralized system is profitable.
Simulation models
Decentralized Set-Up (DC)
The DC set-up is constructed to reflect the flow of materials as of today.
Figure 1. The decentralized set-up
A total of four depots are considered. The depots operate all days of the week and the replenishment of the inventory is managed separately at each location. Each depot can carry up to 10 different products.
All suppliers operate during the weekdays. A maximum of eight different suppliers can be considered at the same time and each of them can carry up to five different products. They are assumed to have infinite stock of these products.
The (s,S) ordering policy is utilized for every product at all depots. Every product has its individual reorder point (s) and maximum inventory level (S). An order is triggered when a product’s inventory position is at – or below its reorder point (s).
All inventory positions are reviewed once every weekday, and not on weekends since the suppliers are closed. Products with the same supplier are replenished jointly. This means that all products with the same
supplier will be ordered when one of them reaches its reorder point.
The order quantities are matched so that each ordered product is at inventory position (S) when the order has been placed.
The suppliers can always deliver a complete order on set lead-time but never on weekends. If an inbound delivery should coincide with a weekend, the goods will not be delivered until the Monday after.
DC - Costs and Constraints
Holding Cost
The holding cost is calculated for every product at every depot. The annual holding cost ( for product at depot is
calculated through: ̅ where ̅ and Order cost
The order cost depends on the number of different products in an order and is calculated through: where
and
Service Constraints
The ready rate is measured individually for all products at all depots and the service level is set to 99 %.
This means that all products should have positive stock on hand at least 99 % of the time.
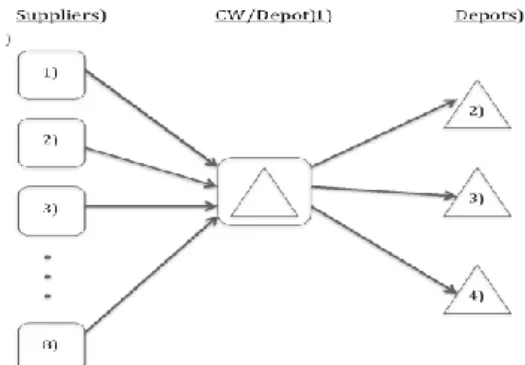
Centralized Set-Up (CW) The CW set-up introduces a central warehouse to the supply chain.
Depot 1 functions as a central warehouse while still continuing to serve its own bus fleet. It can generate demand for up to 10 different products but does not carry stock for any of the products. Instead, the demand is satisfied directly and immediately by the central warehouse stock.
Depots 2, 3 and 4 replenish their inventories from the central warehouse while the central warehouse replenishes its inventory from the outside suppliers. The replenishment is not supplier-dependent. When a depot places an order with the central warehouse, all products at that depot will be replenished jointly.
The Central Warehouse
The central warehouse operates all days of the week and can keep a maximum of 40 different products in stock from eight different suppliers. Because the central warehouse operates all days of the week, orders can be placed on all days. This means that reviews of a products inventory position in a depot is made twice every day as well.
The order process for the central warehouse is exactly the same as for a single depot in the DC set-up.
(s, S) policy
Joint (supplier-dependent) replenishment
No reviews or orders on weekends Contrary to the suppliers, the central warehouse does not have infinite stock. This means that a depots’ ordered quantity could exceed the available stock. If so, the depots’ ordered quantity is changed to match whatever quantity is available at the central warehouse. This policy makes it impossible for orders to be backlogged at the central warehouse.
From Central Warehouse to Depots
There is one van assigned to carry out the transports between the central warehouse and the depots. The van operates all days of the week.
The lead-time depends on the time it takes to drive between the central warehouse and the depot in question. Also, time for picking – and loading of the goods is added to the total lead-time. The time picking and loading of the goods is two hours.
CW – Costs and Constraints
Holding Cost
The holding cost is calculated individually for every product at the depots and the central warehouse.
The annual holding cost ( is calculated in exactly the same way as for the DC set-up:
̅
Order Cost
The cost for an order (C) to an outside supplier is calculated exactly as in the DC set-up:
Arriva DK does not practice internal billing. Hence, the order cost between a depot and the central warehouse will be:
The actual values of , and is estimated to be the same for both set-ups:
Transportation Cost
The cost for a transport ( ), between the central warehouse and depot j, consists of two parts: hourly pay for the chauffeur (p) and fuel cost per kilometre (g). Every transport is considered to be a round trip.
where, and,
The actual values of the hourly pay (p) and fuel cost (g) are based on costs for a similar, existing, transport operation within Arriva DK:
The distance and driving time between the central warehouse and the depots were obtained from Google MapsTM (Google, 2013).
Service Constraints
The ready rate is measured individually for every product at every depot and the service level is set to 99 %.
There are no individual service constraints for the central warehouse since it is only the level of service to external costumers that is of interest in this project.
Result and Analysis
What is common for all scenarios simulated is that the total cost of the CW up exceeds the total cost of the DC set-up.
With very few exceptions, both the order – and the holding cost are higher with a central warehouse. And on top of that, there is an additional cost for transportation, between the central warehouse and the depots, which does not directly occur in the DC set-up.
However, there are distinct trends that the CW up is closing the gap to the DC set-up, as the system gets bigger.
The central warehouse is forced to keep high inventories to be able to meet the depots’ demand. At the same time, the inventories at the depots can be reduced due the shorter lead times a central warehouse brings along. This reduction is, however, not enough to compensate for the increased holding cost at the central warehouse. This is mainly because the order – and transportation costs are too high to fully exploit the shorter lead times and with that, minimize the holding cost at the depots.
Analysis of Transportation Cost
The transportation cost stands for an average of 10, 5 % of the total cost in the CW set-up. A key to reduce the total cost of the CW set-up is to optimize the transportation. That is a project of its own and the values used in this project, concerning the transportation, are rough estimates.
Analysis of Order Cost
The order cost of the CW set-up exceeds that of the DC set-up for almost all scenarios.
The order cost for the CW set-up includes both external orders to suppliers and internal orders between the depots and the central warehouse. However, looking only at the number of orders to external suppliers, for both set-ups, it is clear that they are reduced with a central warehouse. On average, the CW set-up reduces the number of orders to external suppliers by 50 % compared to the DC set-up. The reduced number of orders and the fact that the suppliers only will have to deliver to one single location motivates discounts on the cost price of the products.
Analysis of Discount on the Cost Price The direct procurement cost (the cost price) is not included in the total cost since it is identical for both set-ups. However, with the benefits a central warehouse brings along, a discount on the cost price could be expected for the CW set-up. The discounts needed for the two set-ups to have the same total cost are quite low. The average discount needed for the same total cost is 0, 66%
Trend Analysis
From the results of the simulated scenarios some trends can be distinguished. The general trend is that the CW set-up holds an advantage over the DC set-up as the supply system increases regarding number of suppliers and depots.
Whether the number of suppliers or the number of depots is more decisive for the outcome of the simulations is hard to read from this data. It is, however, clear that both these parameters have a significant impact on the difference in total cost between the two set-ups.
Organizational Analysis
To control and manage the flow of spare parts is easier with a central warehouse since all goods pass through it. The credibility of this claim is strengthened by the reduced number of communication paths required with a central warehouse. Managing the supply chain from a centralized position increases the possibilities to have specialized personnel dedicated to fewer tasks. This will increase the efficiency of the supply chain operations and utilize the competence within the personnel better.
By moving the decision making away from the depots (the consumers), a perceived decrease in flexibility could occur. But by taking control of the transportations out to the depots, the flexibility and possibilities increases. It facilitates unique on-the-spot solutions to unexpected events as well as enables different, more efficient, transportation set-ups than considered in this project.
Conclusions
Under the conditions and restrictions of which the simulation models are built, the total cost for a CW set-up is unambiguously higher than for a DC set-up. However, if a CW set-up could motivate a discount on the cost price, it would immediately make it favourable. In most scenarios a discount on the cost price of as little as 0,66 % would cover the difference in total cost between the set-ups. A discount is motivated because a central warehouse reduces the number of orders to external suppliers by more than 50%. There are also significant trends that the difference in total cost between the two set-ups decreases as the number of suppliers and/or depots increases. From this, the conclusion can be made that the CW set-up is to prefer for larger supply systems.